BIOLOGICAL MONITORING
OF SOLAR
UV
RADIATION
AT
17
SITES
IN
ASIA,
EUROPE
AND
SOUTH
AMERICA FROM
1999
TO
2OO4Noeuo
MuNaKarR, SaNroso
CoRnnrN,Mpu
Keruoro,
Ketur
MuLyRot,
Snt LesraRI,Wroooo
WrRoHaoro.lo;o, DRvro80lSee,
Srelros
KezaDzrs,Vrcron
Meven-Rocnow,
NenoN
ScHUcH,Cmuoro Cesrccn,
MoroHtse KaNEro, CHuNc-MtNc LIu,
KowtcHt
Jtivleow, TosHrat<r SRrDe, CHrrnrco NtsHtcoRt,Knrsuvtr
OcnTe,
Kazunrno
INRFUKU,Koreno
HrEon eNoMesautrsu
IcHrunsutMade in United States of America
Repri nted from PuorocuEMrsrR y A:{ D Paorostor-ocv Vol. 82, No. 3. May/june 2006
Biological Monitoring
of
Solar
UV Radiation
al
17
Sites in
Asia,
Europe and South America
from
1999
to
2004
Nobuo
Munakata*1,
Santoso Cornain2, Mpu Kanoko2, Ketut Mulyadi3,
Sri
Lestaria,
Widodo Wirohadidjojos, David Bolse66,
dtetios
Kazadzis,T-,Victor
Meyer-Rochowt't,
Nelson Schuchlo,
|laudio
Casicciall,
Motohisa
Kaneko12,
Chung-Ming
Liu13,Kowichi Jimbowla, Toshiaki
Saida15,
Chikako Nishigoril6, Katsumi Ogatal7,
Kazuhiro lnafukulE, Kotaro Hiedal and Masamitsu lchihashil6
lBiophysics Laboratory and Frontier Project "Life's Adaptation Strategies
to
Environmental Changes," Facultyoi
Science, Rikkyo University, Tokyo, Japan2Depariment of Anatomic Pathology, University of lndonesia, Jakarta, lndonesia 3Department of Anatomic Pathology, Udayana University, Denpasar, lndonesia aDermatology and Venereology Department, Andalas University, Padang, lndonesia sDepartmenf of Dermatology, Gadjah Mada University, Yogyakarta, lndonesia 6Belgian lnstitute of Space Aeronomy, Brussels, Belgium
tphyiics
Department, Aristotle University of Thessaloniki, Thessaloniki, GreecesDepartment of Biology, University of Oulu, Oulu, Finland eSchool
of
Enqineerinq and Science, lUB, Bremen, Germanylosouthem Re!ional Space Research Centre (CRSPE/lNPE-MCT), Santa Maria, Brazil
ttOzone
and UV Radiation Laboratory, University of Magallanes, Punta Arenas, Chilet2Department of Biomedical Engineering, Jordan University of Science and Technology, lrbid, Jordan l3Department of Atmospheric Sciences, National Taiwan University, Taipei, China
laDepartment of Dermatology, Sapporo Medical University, Sapporo, Japan
lsDepartment of Dermatology, Shinshu University School of Medicine, Matsumoto, Japan l6Department of Dermatology, Kobe University, Kobe, Japan
lTDepartment of Dermatology, Miyazaki University, Kiyotake, Miyazaki' Japan
lsDivision of Dermatology, D'epartment of Organ Oriented Medicine, University of the Ryukyus, Nishihara, Okinawa, Japan
Received 7 July 2005; accepted 4 November 2005; published online 8 November 2005 DOI: 10.15622005-07-07-RA-602 Photochemistry and Photobiology, 2006,
82:
689-694ABSTRACT
A small and robust dosimeter for determining the biologically effective dose
of
ambientUV
radiation
has been developed using LlV-sensitive mutant sporesof
Bacillussnlrrlis
strainTKI6f
2. A membranefilter
with four spots of the spores was snapped to a slide mount. The slide was wrapped and coveredwith
twoor
more layersof
polyethylene sheetto
protect the sample from rain and snow and to reduce monthly-cumulative doseswitNn
the measurable range. From 1999, monthly data were collectedat
17 sitesfor
more than 1 year, and datafor
4 to 6 consecutive years were obtained
from
12 sites. Yearly total values of the spore inactivation doseiSID)
ranged from 3200at
subarcticOulu
to
96000at
tropical
Denpasar, andthe
meanyearly
valuesof
SID
exhibited
an
exponential dependence on latitudein
both hemisphereswith
a doublingfor
about every 14 degrees of change. During the observation period, increasing trends ofUV
doses have been observed at" all sites with more than 5 years of data available. Year'to-year variationsat
high
andmiddle latitude
sitesare
consideredtCorresponding author email: nobmunak@ric.rikliyo.ne.jp (Nobuo Munakata)
O ?006 Americm Society for Photobiology 0031-8655/06
due
mostly
to
climatic
variation.
At
three tropical
sites' negative correlations betrveen the yearly doses and the colum-n ozone amounts were observed. The results verified theappli-cability
of
spore dosimetryfor
globaland
long-timemoni-toring
of
solar
UV
radiation,in
particular
at
tropical
sites where no monitoring is taking place.INTRODUCTION
Solar
tIV
radiation is a ubiquitous environmental agent affecting many terrestrial and aquaticlife
forms. Harmful effectsof de
exposure are incurred mainty by the induction of DNA damage in cells.
In
the attemptto
quantify biologically effective dosesof
ambient
tfV
radiation, efforts have been made to develop dosirnesic systems using biological materials (1). We have been trying to establisha
simple, versatile and robust dosimeter, usingU1i
sensitive spores of a mutant strain of Bccillus subtilis (2,3). Bacerial spores are dormant forms of life endowed with survivability under exreme conditions such as high and low temperatures, desiccarion and various chemicals and radiations (4). The resisance to Lv-radiation has been studied by genetic and molecular analyses of8-srrbrilrs mutana producing highly UV-sensitiVe spores due to the dual delecs in nucleotide excision repair and spore-photoproduct l1'ase (4,5).The
spore dosimeteris
basedon lhe
extentof
inactivation of lhe mutant spores spotted and dried on membrane
690
Nobuo Munakata ef a/.Wavelength (nm)
300
35{t10, loo 1o'r
lo'!
1on
1o'
1o€
lo' lot lo{
a--a- --e+---a---r---a
++.--H
o--a---t+---a---.-a
r^J I t
280 300 320 340 360
380 [image:3.612.73.316.56.292.2]\Yavelength (nm)
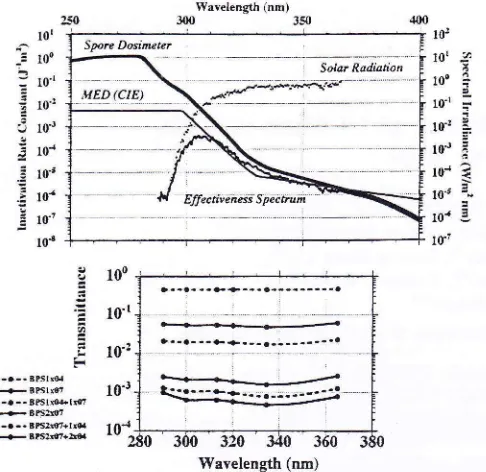
Figure 1. Spectral characteristics of the spore dosimeter and the filter sheets. The upper panei shows an irradiance spectrum, the inacrivation specmlm of the spore dosimeter and an effectiveness spectrum obtained
by multiplication of the inadiance and action at 0.5 nm intervals (6). A reference erythema action spectrum (11) is also shoun for comparison. In the lower panel. spectral transmissions of BPS07 and BPS04 in various combinations are shown.
filters. The inactivation is strictly exponential under constant fluence rates, and spectral inactivation rate constants ("inactivation action spectrum") have been determined in detail across the whole range of UV radiation (6). Attempts to apply this dosimetry under various conditions have been pursued (7,8), and comparisons with physical dosimeters have been performed (3,6). The dose rate could be
determined under natural sunlight
within
several minutes of exposure. However,in
orderto
determine cumulative doses in longer time spans, two problems need be circumvented; one is ro reduce the dose and the other is to protect the samples from various environmental assaults including rain and snow. For this purpose, we used blue polyethylene sheets. exhibiting uniform absorption characteristics in the range of UV radiation, to cover the samples. After several anempts of daily and weekly exposures, we initiated continual monthly measurements at various sites in the world. The results of the accumulated data are presented in this report.MATERIALS AND
METHODS
Preparations and assays of sitore dosimeter samples. Spore dosimeters were prepared and assayed in the laboratory of the first author as described before (2,3,6). In
briel
the spores of Bacillus srbnlrs strain TKJ63I:(uvrB splB his met leul were mixed wirh 0.67o molten low-melting agarose (SeaPlaque; Cambrex, Rocklend, ME). Four
5 gL
aliquotsof
the suspension, each containing approximately l0o spores. were spotted on a membrane filter (pore size,0.1 prm: A0l0A025A: Toyo Roshi, Tok1o, Japan) in a l2-place filtering device under a weak vacuum. Two spots rvere covered with two pieces of black paper and served as unexposed controls. Each filter was anached with adhesive labels to a glass cover of a slidemount. The samples were covered and dually wrapped
with
blue pol;"ethylene sheets described below and placed in a plastic slide holder. The samples could be stored in dark either betbre or afier the exposure aslong as needed. They were sent to each exposure site by mail. .{frer exposure, the samples were sent back for lhe assay. Each spot was cut out
and placed in a test tube. One milliliter of water was added to the tube and heated at 75"C for l6 min with vigorous shaking ar the midpoint. An eliquot of the suspension was overlaid on a casamino acid-supplemented minimal agar plate. The colonies were counted atter ovemight incubation at 37"C. The numbers ofcolony formers oltwo exposed spots were divided by those
of
trvo unexposed spotsto
obrain the surviving tmction. The spore inactivation dose (SID) was derived lrom the absolute value of natural logarithm of the surviving fraction: SID = -ln(surviving fraction). \lonthly SID va.lues were calculated by multiplying the factor of rcduction derived for each combination of filter sheets as described below.Characteri:ation of blue polyethylene sheet. Appropriate filter materials
that also served as protection against adversities were sougjrt by deter-mining optical properties of various materials found in the laboratory and at home.
It
was found that blue polyethylene sheets used as garbage bags exhibited favorable propenies. We ordered two rypes of the sheet (Umeya Sangyo. Tokyo, Japan) with different thickness, one 0.04 mm and another 0.07 mm (referred to as BPS0.I and BPS07, respectively). The ransminanceof BPS04 and BPS07 was determined using the faciliry of Okazaki Lar-se Spectrograph (9) with the sheet fining tightly over rhe photodiode. The results of the transmittance characreristics are shown in Fig. I together with the "effectiveness spectnlm" obtained from solar irradiance and action specra (5,10, I 1). The measurements indicare that in the range of pertinent
UV wavelengths (290-365 nm). the transmiuance was reasonably uniform for each and various combinations of the sheel and that with rwo layers of
BPS07 and BPS04. the transmission could be reduced to less than 0.17o. Exposure condirions and sites. Samples were placed horizonally at a place without shadin-e at any time on the roof of a building at each mea-surement site. Exact coordinates are known from the following sies: Tokyo (l,Iational Cancer Center [35'41'N, 139'16'E] and Rikk-vo University [35"J,*'N, 139'42'E] since April 2002), Marumoto (Shinshu Universiry
[36'15'N, 137"58'E]), Brussels (Belgian Instirute for Space Aeronomy
[50"48'N,
4'21'E]),
Thessaloniki(Arisode
Universiqv F0'31'N, 22"58'El), Sdo Maninho da Serra near Santa lvlaria (hereafter refened to as Sio Maninho) (Sourhem Space Obsen-amr-v [39"26'5. 53"a9Tf]) and Taipei (National Taiwan Universiry [25'01'N. 121"32'E)\. For other sites, the coordinates were read out from maps. E.rcept for Masumoto (aldtude, 60O m). Sdo Maninho (altitude. 468 m) and Amman (akitude- 760 m). the altirudes of the sites were less rhan 150 m above sealevel-O:one column. The values of monthly average column ozone in Dobson unirs (DLD were obtained from the darabase of Totai Ozone }tapping Spectrometer (TO:VIS) (12). The means
of
lf
months from Jaauary to December were used as the average yearly amouns.RESULTS
AND
DISCUSSION
Project outlines
After preparative studies of daiiy and weekly exposures.
de
testsfor
monthly exposures were conducred ar Tokyo, Jakana and Denpasar starting in September 1998. These initial tests- using three sets of sample slides with different combinarions of the filter sheets.indicated that carc should be raken for the sample prepararions to cope with climaric adversities, especiall]' heavy rains. like those encounaered by the frequent squalls in lndonesia and the occasional ryphoons in Japan. Also. the doses at Denpasar were higher than anticipated. Therefore.
it
was decidedthat
the samples were wrapped with two layers of the polyethylene sheet (8PS07). using plastic tapes and sealed*'ith
an electric sealer. Funher filtering was provided with additional layers of BPSOI or BPS07- It $'as also decided that, ar tropical sites. four sample slides for each month should be emplo!eC to cover the hi-eher dosespresent-Since January 1999, five sites in Japan and two sites in Europe have been added to initiate continual monthl-v measurements. After this time, several sites including rwo in South America have been included, but the operations at some sites u'ere discondnued due to personnel changes ofaddresses. In this repon- we collecred the data at the sites that provided the data for more than
I
1'ear. The datacould not be collected in some months due to various accidents of both natural causes (samples lost or spoiled in storms. de$rc:'ed by I
1d
to'
€
ron 3
tn'
i
,nt
i
lot ; 10'
?
l0'
-* 10{g
1(rt3
1oo2
E
1o'r.i,
lo'2- -a-- BtSlg +851tr --.-.Bmt'&1fi +862ff --a--86ffi+lg +161ff1*
bids,
etc.) and human factors (exchange failures. mail troubles, etc.). Some samples in tropical or subtropical sites could not befully recovered due possibly to the combinations of extensive heat and rain. In all, there were 8:1 missing data points out of a total of 980 months. In the estimates of yearly total values, missing points were filled by the means of two values of the same months in the nearest years. Summarized data are shown in Table 1. The data of
the
monthly
valuesin a
tabulatedlorm are
available as supplementary material from the website.Nlonthly and y'early doses at each site
Ettrope. Three European sites. Oulu (65.0"N), Brussels (50.9.N) and Thessaloniki (40.5'N). exhibited monrhly doses dependent primarily on the solar latitude. High values prevailed from June to August, indicating the contribution of column ozone amounts lhat peaked in April and declined to October. Although only
i7
months of data were available at Oulu,it
exhibited the lowest valuesol
UV doses'in the present work. Because the sun does not rise above 10o during December and January and the outside is covered with thick snow, it was considered not practical to determine the doses,
and we assumed the doses were much lower than
the
19 SID observed in February. Mean yeariy doses with standard deviation in parentheses were 3200 at Oulu.5900 (+1000) ar Brussels and 16 500 (+3669) at Thessaloniki.Japan. Data from six sites on four islands
of
Japan, covering aboutl7o
in
latirude were available.Ar
Sapporo (43.1"N) on Hokkaido island, monthly changes were similar to those observed at Brussels with a slightly hi_gher values (about 357o). Ar five sireson
Honshu Island (Matsumoto. 36.3oN; Tokyo, 35.7.N; Kobe, 34.7'N), Kyusyu Istand (Kiyorake, 31.9') and Okinawa Island (Nishihara, 26.4T.i),in
rhe majoriryof
years, the valuesin
June were lower rhan thosein
lvla.v and July despite higher solar alti-tudes.A
possible reason is high precipirarion and cloudiness from June to the middle of July due ro the rainy season. yearly totaldoses were berween 10 500 (+2000) at Toky,o and 22 500
(-6300)
at Nishihara and exhibired large variarions possibly due
to
the variations of summer weather.Two Asian srres. Two low laritude sites, Amman and Taipei, in addition to Japan and Indonesia were included in the course ofthis project.
At
Amman (32.0'i\i-), rhe data were only for slightly over a year, and dusts, probably due ro sandstorms, often dirtied the sample surfaces. This could have reduced rhe dose significantly. The site at Taipei (25.0"19in
Taiwanis
siruared berween the southemmosr site in Japan and the sites in Indonesia. and exhibited hi_eh doses with clear seasonal changes. lvlean yearly dose at Taipei was 29900 (+1100).Indonesia. The four sites
in
Indonesia areon
three tropical islands and include padan-g (0.9"S) on Sumarra, Jakarta (6.2"5) and Yo_eyakana (7.8'S) on the island of Java, and Denpasar (8.6"5), themain city of Bali.
All
monthly doses ',vere higher rhan l0OO SID (except onein
Jakarta) anddid
not exhibir clearly demarcated seasonal changes. In the inirial year,it
was noticed that the values at Jakarta were consistently lorver than thoseof
Denpasar. Uporf the addition of rwo more sites at Yogvakana and padang. it became evident that relatively low values were resricted to Jalcana- [n all. the mean ralioof
monthlv dose at Jakarta to Denpasar was 0.54 (+0.29 SD; 58 data points). The measurement site in Jakana was in the middle of city with hi_ehrafiic
and industrial activiries. and ir was likely that the atmospheric transparency was much lower than that at Denpasar or other places due to poliutants in the air. At thesePhotochemistry and Photobiotogy,
2006,82
691sites. the yearly climare typicatly consisred
ol
dry (fiom May toSeptember) and wet seasons (tiom October ro April). Also,
it
is known that the amountof
precipitation is erceptionally high at Padang. The lar_ee variations seen in Padang during rhe wet season seemed to depend on the variability in the arnount ol precipitation. The values of monthly SID higher than 8000 w.ere observed only in lndonesia, and these hi_eh values were encountered frequently during August to January. lvlean yearly doses *.ere between 39 400(-8900)
at Jakarra and 77 800 (+ 15 700) at Denpasar.South America. Measurements at a site in southem Brazil, Sdo \faninho (29.5"5) and a site ar the sourhem end of South America at Punta Arenas (53.2'5) in Chile were initiared in the yean 2000 and 2001. respectively. Borh sites exhibited seasonal changes opposite to rhe Northern Hemisphere. The site at punta Arenas has
otten been covered by the extension of the .{ntarctic ozone hole during spring monrhs (13,14). Data on some crucial monrhs were rnissin_e, and the extent
of
the effect was nor clear at this point. \lean yearly doses were 5 100 (+700) at punra Arenas and 23 600(-5000)
at Sao Marrinho.Ranges of biologically effective solar UV doses
ltonthly
doses of ambient UV radiation were derermined by spore dosimeters ar 17 sites covering a wide rangeof
latirude.At
the exuemes, doses at subarctic and tropical sites diverged from less than 20 units of SID (at Oulu from December to February) ro more than 12000 (at Padangin
October), represenring a difterence of about 600-fold. This striking variabiliry represenrs a unique learure of solar IJV radiation as an environmental factor affecting living organisms. Seasonal changesof
the doses are evident at all sites except in the tropics. In rhe tropics, high monthly doses (i.e. >8000 unia of SID) never encountered elsewhere could occur frequently tlroughout a y'ear. Thus, organisms are under a constant .,radiation burden" without long periods of recovery. The ratios of the doses trenveen the maximum to minimum month tend to increase at the sites of higher latitudes. Larger ratios indicate the changes during spring and aurumn months are steeper.This
rypeof
seasonal change also should be taken into account in the assessment of bio-logica.l effecs and possible adaptive sreps on pan of rhe organisms e.rperiencing these chan_ees.There are three major factors affecting the doses
of
solar LfV radiation: the solar altitude. the amount of column ozone and the air opaciry. The ladrude at each sire represents solar alrirudes wirh daily and seasonal periodicity. Daily and monrhly averaged amounrsof
column ozone at each site within latitudinal (1.01 and lon-sirudinal
(1-5')
grids have been determined by TONIS and are publicly available(ll).
The mostdilficult
facrorfor
quantificarionis
rhetnuxparencv of the air. The amounts and nature of water vapor in air. taliing shape as rain, snow. clouds and humidiry, are considered to t'e imponanl but these could not be represented as simple values. \foreover. there are cases in which air pollution plays a si_enificant
role
in
reducing the doses. Thus, fbllowing comparisonsof
the dos* and analvses of the changes during these vears are pror.isionalrliih
resard to meteorological and climatic aspecs.The resuls show a decisive globat partem of latirudinal depen-dence. The vearly dose exhibited more rhan a
j0-fbld
difference tenteen the subarcticcity
of
Oulu and the tropicai Denpasar.-{lthough there could be some places of more e\treme UV
692
Nobuo Munakata et a/.Table
l.
Summalv of solar UV doses determined with spore dosimetry by locationOulu
Brussels Thessaloniki
SaPPoro \'Iatsumoto Tokyo Kobe KivotekeSite
Coordinates
Measurement Period
Ivlean monthly SID* Januar.v Februar,v NIarch Apnl May June Juty August September October November December
Minimum monthly SID
lvlaximum monthlY SID
Yearly total SIDf 1999
2000 200 1
2002 2003 2001 65.0"N. 25.-i"E 1000/05-200
l/l
lND t9 85 219 t1) 71r 1021 831 290 tt7 _r0 ND
1 191 (l0oo/08)
50.9"N.
r999/0
i-)nru/t 111 55 r50 367 767
I 04i
I 280 t246 565 ta5 119 IA l6 (20Mlo2) r629 (2003/08) 5327 (0) 6057 (0) 5566 tnr 492't (0) 7779 (2) 59 19 (0)
40.5'N. 2i.0"E r999l0r-2001112 r05 153 !al 129 I 2094 3524 3-109 3089 128 1
i87 255 86 60 (2000/12) 4863 (2004/06)
16 5+3 (2) 164J4 (3) 14689 (1) 12032 (1) 20651 (1) 18400 (1)
.13.1'N. 111.3'E t999l0t-200+105 63 98 187 686 1016 t116 160?
1 i89
708 198
li0
68 ts (2001/Ol) 2371 (2001,08)7202 (2t 7813 {1, 882-t ( I )
6861 (-r) 8i35 (o)
\D
)O.J r\.
l 18.0"E 1,99911-,onl/l, 175 111 101 892
l 508 l-l0l 26t9 2503 ll12 +l+ )12 184 5J {t999102) 1529 (2001/07)
10-r82 (0)
9i 16 (0) 12589
(l)
8i33 (0) 160.+l (0) I r 615 r0I
35.7"N. r 39.7"E
t999l0t-2O04lt2 156 238 299 850 1336 12.51 2210 2t'76 982 !?1 296 182 101 (1999102) 3\46 (1004/07)
9579 (0) 953:l (0) 896e (0) 9257 (r)
1-r 030 (0)
tr712 (0)
1.1.7"N. 135.2"E t999l0t-20041t2 161 285 361 117.1
1 393
r'730 2'736 2508 rr97 515 296 236 89 (2004/01) 4168 (2003/06)
I I 306 (2)
l r 204 (1) i I 072 (2) 10438
(l)
16 193 (2)1 3 236 (0)
31.9"N,
li
l..l"E t999l0t-1004112 289 355 14t t 152 t6t9 2229 3400 2622 1320 840 436 218 9'l (2003/12) 4986 (2001/07)10 26e (0) 12744 (1) 16387 (0)
1-r 028 (2)
2r 379 (3) 17071 (0) ND
N:D
iriR ra) ND ND ND
*ND = Not determined: SID = spore inactivation dose.
iln
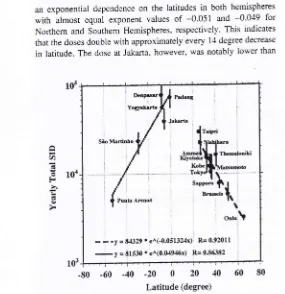
parentheses, the number of monrhs with missing data are shown. The estimates *'ere made from the mean of the values in the nearest years'an exponential dependence on the latitudes
in
both hemisphereswith
almost equal exponent valuesof
-0.051
and -0'0-19 for Northern and Southem Hemispheres, respectively' This indicates that the doses double with approximately every 14 degree decreasein
latitude. The dose at Jakafia. however,"vas notably lower than
Yogdk rb
Sito Mstitrho
PugArd
\
O"f"\
- -
-y = &{329' e^(-0.05132,{x): R= 0.92011-:y
= E1530* e^(0.O1946x) R= 0463E2
1d-.f
-80 -60
-40
-202{' 40 60
E0 [image:5.612.74.587.63.376.2]Latitude (degree)
Figure 2. lvlean yearly doses against latitudes. The bars represent the ranges of the ma.timum end minimum values'
the value obtained from the rcgression, suggesting the effects
of
atmospheric pollution. The generally lower values in Japan seem to be due to the monsoon climate of high humidity and precipitation in summer. The latitudinal gradient seems primarily determined by solar altitude. However. because the amount of column ozone is generally smaller at lower latirudes in both hemispheres' this fact should also be taken inlo account.Yearly changes of column ozone amounts and
UV
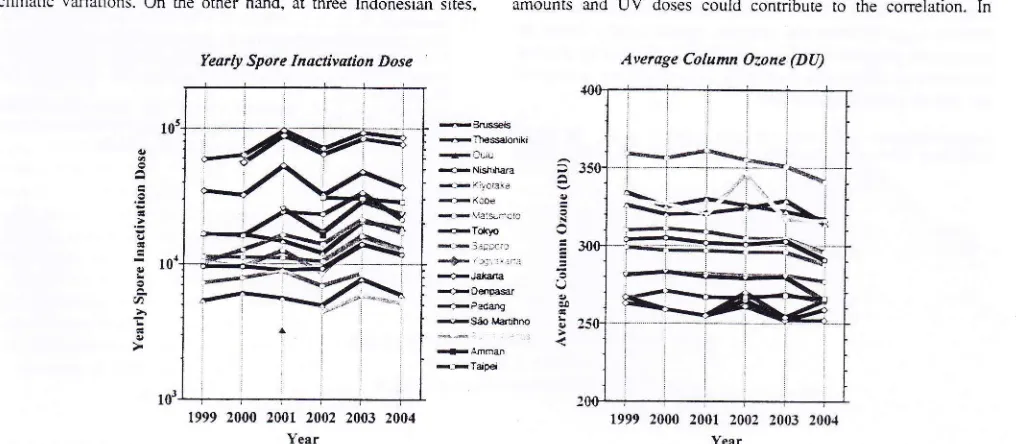
dosesDuring rhe period of this project' yearly average values of column ozore seemed to have declined steadily at most places as shown in the righr panel of Fig. 3.
in
linear regressions, all the siles except Padang exhibited negative coefficient vaiues. The values (DU change per yearir
referring to lhe linear correlation coefficient) smaller than-2
were obsewedat
Sapporo(-3.2;
r :
0'83)' Brussels(-2.8;
r =
0.88). !{atsumoto(-2-6;
r :
0'89)'
Seo rv-taninho(-2.6:
r =
0.74), Tokyo (-2.0;r:0.75)
and DenPasar(-1.&
r =
0.7S). On the other hand, allol
the sites exhibited an increa.se of yearl;- total doses in either linear or exPonendal regres-sions- The largest yearly incr€ase of SiD in linear regressions was ob=n'ed at Denpasar (5600:r:
0.67). followed by Padang (3600;r :
0.+l).
Five
sitesin
Japan exhibited significant increases: Nishihara (2100:r:
0.6i), Ki1-otake (1600:r
= 0.80). Kobe (650:r:0-56).
Matsumoto (750r=
0.5?) and Tokyo (710:r:0.67)'
Small:r and less signi{icant increases in UV doses werc observed at SapFrro (170; r = 0.32) and Brussels (210; r = 0.40)' where the decre:-ses in ozone arnounts \rere most significant. The global trend 10"U)
[image:5.612.40.325.411.705.2]Photochemistry and Photobiology, 2006,
82
693Table
l.
E-ttendedNishihara Taipei Padang Jakarta Yogyakarta Denpasar Sdo
Maninho
Punta Arenas26.4"N,
r l7 00F
t999/0t-20041t2
429 540 742
t'7 52
)))1 3118 4504 3919 2277 r439 795 416 164
( i99910
l)
59'16 (2o0u07)16 676 (0) 16 155 (0) 24 065 (0) 23205 (t) 33525 (r) 2t227 (0)
32.0"N, 35.9"E 2001106-7003102 401 61i 663 908 1703 3986 2775 1554 )1 J1 1066 561 ND 401 (2002/01) 4974 (2001/06) ND ND ND l6 378
(l)
ND ND 25.0'N. l2 r.5'E 200v11-2M4112 351 JJ6 719 I 188 3987 6126 6638 5605 2216 1406 855 143 154 (20c,rlot) 7307 (2002/M) ND ND ND 30666 (1) 30376
(l)
28 589 (0)0.9's, 100.4"E t999/tr-2M4lt2 6866 5566 566 r
5491 4240 4503 6325 8942 7087 88 17 5250 6116 1116 (2002/05) 12255 (2001/09) ND 55 847 (1) 87 856 (2) 64007 (2) 83439
(l)
75e39 (2)6.2'S, 106.8'E t999l0t-20o4lt2 3391 2I7 t 2266 4064 2553 1q1 i
28ri 2668 3493 4150 4382 4056
7ll
(teeg/02) 877 t (200r/10)i4519 iit
32 136 (0) 53 010
(l)
32026 (2\ 47810(l)
3679r (0)7.8'S, I 10..1"E 2000/0i-2001/10 1993 5232 7733 62U 490'7 3108 2048 .1306 7734 53i5 3830 ND 1925 (2000/07) 89.+6 (2001/03) i\D
56.11-l (1) ND |aD
i\D ND
8.6'S. 1 15.2'E
1999l0t-?\Mlt2 80i6 5288 6288 6212 4954 5505 5330 70'77 7498 7934 '1672 57 14 227 1
(200210s) 1l 800 (2003/08)
58 628
(l)
63 489 (1) 96047 (t) 't0't37 (r) 92590(l)
85 522 (3)29.5'S, 53.8"W 2000/03-20011t2 4.t03 28,{0 2283 t222 623 375 526 807 t265 2155 27 13 J /JU
t25 (2002106) 6s26 (2003/01) ND ND 25 424 (t)
16 948 (0) 28 955 (0) 23234 (r)
53.2"S, 71.0"w 2001/05-20M/t2
7,18
1A I 331 l15 A1 45 66 89 3t2 551 908 l03l 25 (2002/06) 1228 (2003102) ND ND ND 4380 (r)
s832 (2)
5 150 (2)
of ozone decrease and UV increase clearly continued between the years 1999 and 2004.
The pattems of year-to-year variations of column ozone amounts and
IIV
doses did not always exhibit clear correlations at most sites of high and middle latirudes. For example, prominent peaks of {.tVdoses observed in rhe years 200
I
and 2003 at several sites in Japandid not correspond to column ozone changes. This indicates that the changes of
W
doses in these years were caused primarily by climatic variations. On the other hand, at three Indonesian sites,two prominent peaks
of UV
dosesin
the years 2001 and 2003 corresponded to the troughs ofcolumn ozone amounts. There seemto be several reasons why the ne-gative correlations between UV doses and column ozone zunounts are shown clearly in the tropics. Because ozone absorption increases steeply at the lowest wave-length end of the eff'ectiveness spectrum, the loss could manifest itself more severely when the initial amounts were lower as in the Asian tropics. Also, the small seasonal changes
ol
both ozone amounts andW
doses could contributeto
the correlation. InAverage Column Oune (DL)
D U $ a I o a +TlEsroniki +llalanorC
-ts 1::l:i.:ra
+geoMalihrc
[image:6.612.58.564.40.380.2]Year
Figure 3. Yearly toral doses (SID) ar l7 sires (left panel) and average column ozone amounr (DU) at markers without lines ue from the sites with data from only
I
year.Year
13 sires (right panel). In the lelt panel, rhe solitar,v Yearly Spore Inactivation Dose
[image:6.612.63.571.493.715.2]694
Nobuo Munakala et a!.contrast. at other sites, the column ozone amounts exhibit large seasonal changes w'ith a peak
in
spring and a troughin
autumn. Since yearly total values are largelylrom
summer months. the changes mi,eht not affect the UV doses directly.Use of spore dosimetr,v
for
global monitoring of solar UV radiationln this work. the biologically effective doses of solar UV radiation were determined with the use
of
spore dosimetry as cumulative monthly values at various sites. One serious problem in giobal UV dosimetry has been that a majoriry of the monitoring stations are situated at high and middle latitudes and measuremenr in tropical environments have rarely been performed despite the expected high doses due to high solar altitude and low ozone amounts. To the best og ouv fuiowledge, thisis
the first resultof
monitoring performedin
the Asian tropicsin
parallelto
middle and high latirude places. The monitoringof UV
doses and column ozone amounts in the tropics is critically important with regard to human health, productiviry and conservation because of the large human populationsin
countriesof
this region and because of the biodi-versity and range of ecosystems encountered there.Several advantages
of
a
purely biological approachin
Uv: monitoring have been demonstratedin
this work. Ivleasurements can be performed an1'where without special facilities. The dosecould be represented by a simple biologically relevant value
di-rectiy
obtainedfrom
experimenul measurements'ln
conrrast physical dosimeters require dedicated instruments and resources. and. to derive biological doses, calculations dependent on cenain models. On the other hand, some problems were recognized in orderto
advance long+erm applicationsof
the spore dosimeq''-One is the lack of a reliable reference to check the consistency of the inactivation kinetics in the field. We assume the inactivation is strictiy exponential to the accumulated dose, butit
is difficult to validate the kinetics under the conditions of incessant changes of specral irradiance during a period of a month. The use of the filter sheet was necessary, butit
introduced another complication. be-cause any change and variabilityin
the optical characteristics of the filter sheet could cause large changes in the doses'pafiicularl)-in
the casesof
very high doses.It
is desirable to carry out daiiy monitoring in addition to the monthly one at some sites and to use different typesof
filten
(for example, neutral densiry filters) for comparative purposes. Comparisons with data obtained by physical dosimeters at several sites involved in this project are in progress andwill
be presented elsewhere.Acknowledgemenrs-This work has been supponed
in
pan by grans-in-aid from Ministry of Educadon. Science, Spons and Culure, Japan(07303043 and 99042004) and Japanese Committee ior Sun Protection (JCSP). We thank encouragements and helptul discussions by Dr- Keiichi Nozu (JCSP), Dr. George Ront6 (Hungarian Academy' ol Sciences, Buda-pest) and Dr. Cerda Homeck (DLR, Koln).
REFERENCES
1. Renberg, P., G. Homeck, C. Baumstark-Khan and G' Amanatidis, eds' (1999)'Biological UV dosimetry, a tool for assessing the impacr of LIV radiation on health and ecosystems. Air Pollution Research Repon 71. European Commission, Luxembourg.
2. Munakata, N. (1981) Killing and mutagenic action of sunlight upo-n Bacillus subtilrs spores: a doiimetric system..!Iarcr. Res 82.263-268' 3. Munakata. N., F- Morohoshi.
K.
Hieda,K.
Suzuki. Y- Furusawa.H. Shimura and T. Ito (1996) Experimental conespondence between spore dosimetry and spectral photometry of solar ultraviolet radiation'
P horoche m. P hotobiol. 63, 1 4-7 8.
4. Nicholson, W.
L., N.
Munakata, G. Homeck. H. J. \lelosh andP.
Setlow (2000) Resistanceof
Bacillus endosporesIo
exreme terrestrial and extraterrestrial environments. Microbiol. Ilolec. Biol-Rev. 61,548-572.5. Munakata, N. and C. S. Rupen (1974) Dark repair of DNA conraining "spore photoproduct"
n
Bacillus subtilis. 'Volec- Gen- Genet- 130' 239-250.6. Munakata, N., S. Kazadzis, A. F. Bais, K. Hieda- G. Ront6- P. Reaberg and G. Homeck (2000) Comparisons of spore dosimeq and spectral photometry of solar-tlV radiarion at four sites in Japan a*1 Europe'
P hotochem. P hotobiol. 72,'739--1 45.
7. Munakata, N., M. Ono and S. Watanabe (1998) lvlonito@ of
solar-UV exposure among schoolchildren in five Japanese cities usiag spore dosimJter and UV-coloring label. Jpn. J. Cancer Res- 89.
I)-245'
8. Munakara, N., K. Makita, D. Bolse6, D. Gilloay and G- Homeck (2000) Spore dosimetry of solar UV radiarioo: applicatioas
o
moni-toring of daily irradiance and personal exposrue- Adl.- Space Res' 26, 199)-2003.9. Waranabe, M.. M. Furuya, Y. Miyoshi, Y. I-noue.
L
lo:]rashi and K. Masumoto (1982) Design and performance of the Okazaki large spectrograph for photobiological srudies. Photochem- Photobiol. 36-491-{98-10. Serlow, R. B. (197.1) The wavelengh in sunlight effective ia producing skin cancer: a theoretical analysis. Proc. Narl- Acad- Sci- LI 5 A 71. 3363-3366.
11. N{cKinley, A. F. and B. L. Diffey (1987) A ret'erence
rticn
gectrum for ultraviolet induced erythema in human skin. CIE Res- '\bre 6-l7-?2.12. Total Ozone Mapping Spectrometer Ozone Processing Te'n ar \'c'S'di GSFC. Available
at:
http://toms.gsfc-nasa-gov/pub, eptoms/dara-Accessed onI
October 2005.i3.
Rousseaux, M. C.. C. L. Ballare. C. V. Giordano' A-L
ScoF€L.{ \L
Zima. M. Szwarcberg-Bracchiaa P. S. Searles- M- lv{- Cai.hell andS-B. Diaz (1999) Ozone depletion and UVB r:diadon: imgact on planr
DN.{ damage in southem South America- Proc- iuatl- Acei Srr" U S A 96. i5310-15315.