The impact of local geochemical variability on quantifying hillslope soil
production and chemical weathering
Arjun M. Heimsath
a,⁎
, Benjamin C. Burke
b aSchool of Earth and Space Exploration, Arizona State University, 781 E Terrace Rd., Tempe, AZ 85287, United States bNoble Energy, 1625 Broadway, Suite 2200, Denver, CO 80202, United States
a b s t r a c t
a r t i c l e
i n f o
Article history:
Received 12 November 2012
Received in revised form 15 February 2013 Accepted 10 March 2013
Available online 16 March 2013
Keywords: Erosion Weathering Hillslope processes Saprolite
Soil-mantled upland landscapes are widespread across the habitable world, support extensive life, and are the interface between the atmosphere, hydrosphere, and lithosphere but typically are not cultivated. Soil found across such landscapesfits the conceptual framework of a physically mobile layer derived from the un-derlying parent material along with some locally derived organic content. The extent and persistence of these upland soils depend on the long-term balance between soil production and erosion. Here we briefly review methods used to quantify the physical and chemical processes of soil production and erosion and revisit three granitic study areas in southeastern Australia and northern California that enabled early quantification of the soil production function and topographic controls on chemical weathering. We then present new major and trace element data from 2-m by 2-m pits dug at eachfield site to quantify local variability of Zr concentrations and the chemical index of alteration (CIA), weathering indices used to determine chemical weathering rates and extents in soils and saprolites. Using both new and previously published data, we compare differences between local variability and regional, as well as intersite variability of these important indices. For each of the 2-m pits, we collected 25 samples and found that the simple mean and the 2σ stan-dard deviation best describe the local variation in the data. We alsofind that the variability in the 2-m pit data lies within variability observed in the same data from samples collected in individual soil pits across each of thefield sites and that the differences between sites are consistent with previously published results. These observations highlight the importance of quantifying local scale variability in studies that use similar, multi-faceted measurements to quantify hillslope soil production and erosion processes.
© 2013 Elsevier B.V. All rights reserved.
1. Introduction
Quantifying the rates of Earth surface processes across soil-mantled landscapes is important across disciplines (Anderson, 1994; Burbank et al., 2003; Dietrich et al., 2003; Bierman, 2004; Ferrier et al., 2005; West et al., 2005; Dietrich and Perron, 2006). Balances between soil produc-tion and transport determine soil presence and thickness for any given landscape. Soil presence and thickness, in turn, help support much of the life with which humans are familiar, play important roles in the hydrologic cycle, and are coupled with processes that impact the atmosphere. Despite significant recent progress, significant gaps exist in our understanding of this interface between humans, the atmo-sphere, bioatmo-sphere, and lithosphere. One of the most significant gaps is quantifying controls on soil thickness (Anderson et al., 2007; Brantley et al., 2007; West, 2012), while another is the continued quantification of the sediment transport relationships (cf Geomorphic Transport Laws;
Dietrich et al. (2003). Closing these gaps will require continuedfield
and modeling investigation into hillslope processes across spatial and temporal scales. This paper focuses on three well-studied, granitic, up-land, soil-mantled landscapes to quantify the role of meter-scale spatial variability on the hillslope-scale physical and chemical soil production and erosion processes.
To explain why understanding local variability is so important, we briefly review the conceptual framework and the field-based mea-surements used to quantify soil production and hillslope weathering rates. Specifically, we summarize the mass balance approach to modeling landscape evolution, and identify the keyfield-based pa-rameters that we can quantify with direct measurements. These mea-surements include in situ produced cosmogenic radionuclides (CRNs) (10Be and26Al) in saprolites and river sands to quantify soil
produc-tion and catchment-averaged erosion rates, and major (Si, Al, Fe, Ca, Na, K, and Ti oxides) and trace (Zr, Th and Ce) element analyses of the parent material and soils to quantify their weathered condition and weathering rates. Coupling these methods across diverse upland landscapes is an effective way to quantify the role of climatic (Porder et al., 2007; Dixon et al., 2009a; Ferrier et al., 2012) and tectonic (Riebe et al., 2001b; West et al., 2005; Dixon et al., 2012) forcing on landscape evolution, given the assumption of spatially homogenous
⁎ Corresponding author. Tel.: +1 603 401 0645; fax: +1 480 965 5585. E-mail addresses:[email protected](A.M. Heimsath),
[email protected](B.C. Burke).
0169-555X/$–see front matter © 2013 Elsevier B.V. All rights reserved.
http://dx.doi.org/10.1016/j.geomorph.2013.03.007
Contents lists available atScienceDirect
Geomorphology
initial conditions for the elements in the parent material. All studies applying these methods recognize the potential for local variability, and important work highlights the complexity introduced by local variability of measured parameters (Riebe et al., 2001a; Riggins et al., 2011; Ferrier et al., 2012). To evaluate how local variation of the major element oxides and trace element concentrations can indeed impact our interpretations, we present here an intensivefield-based examination of this variability.
2. Conceptual framework and methods
Hilly and mountainous landscapes around the world are mantled with soil. In regions where external sources of sediment (e.g., eolian,fl u-vial, and glacial deposition) are absent or negligible, the soil mantle is typically produced from the underlying bedrock. The rate law for this process is the soil production function (Heimsath et al., 1997)—defined as the relationship between the rate of bedrock conversion to soil and the overlying soil thickness. The soil depth that sets the rate of soil pro-duction is a result of the balance between soil propro-duction and erosion. If local soil depth is constant over time, the soil production rate equals the erosion rate, which equals the lowering rate of the land surface. Quantifying the soil production function, therefore, furthers our un-derstanding of the evolution of soil-mantled landscapes (Anderson and Humphrey, 1989; Rosenbloom and Anderson, 1994; Dietrich et al., 1995; Heimsath et al., 1997).Heimsath et al. (1997, 1999, 2000)
reported spatial variation of erosion rates, suggesting that the land-scapes were not in a state of dynamic equilibrium, asfirst conceptual-ized byGilbert (1877, 1909)and thenHack (1960). Such a condition, where the landscape morphology is time-independent, was an impor-tant assumption for landscape evolution models. Showing that upland landscapes are evolving locally with time helped spur a new level of un-derstanding for how landscapes change under climatic and tectonic forcing.
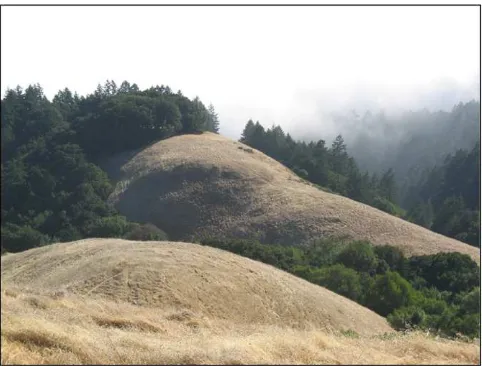
On actively eroding hilly landscapes, characterized by ridge and val-ley topography (Fig. 1), the colluvial soil mantle typically is thin and is produced and transported by mechanical processes. Tree throw, animal burrowing, and similar processes, such as freeze–thaw and shrink–swell cycles, convert in-place bedrock to a mobile, often rocky, soil layer that is then transported downslope by the same actions (e.g., Lutz and Griswold, 1939; Lutz, 1960; Hole, 1981; Mitchell, 1988; Matsuoka, 1990; Schaetzl and Follmer, 1990; Norman et al., 1995; Paton et al., 1995). While such processes are aided directly (and even accelerated) by chemical weathering of the bedrock, they are able to produce
soil from bedrock irrespective of its weathered state (e.g.Dixon et al., 2012; Heimsath et al., 2012). Nonetheless, quantifying chemical weathering rates and extents enables a more complete understanding of how landscapes evolve (e.g.Porder and Chadwick, 2009; Dosseto et al., 2010), as well as directly links the active physical processes with ob-served rates andfluxes of chemical mass transfer (e.g.Bern et al., 2010; Riggins et al., 2011).
2.1. Soil production and chemical weathering
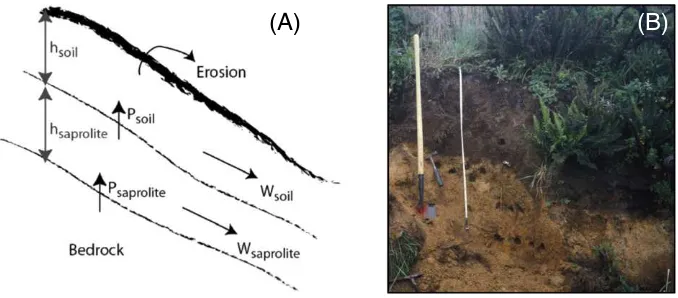
A typical soil depth profile at a hillcrest or sideslope reveals dis-tinct boundaries between the bioturbated and non-horizonated soil, weathered bedrock, and unweathered bedrock (Fig. 2A). The layer of physically and/or chemically altered material (saprolite and soil) atop crystalline bedrock can be millimeters to tens of meters thick depending on the landscape in question and the external driving forces eroding the landscape. A number of definitions are found throughout the literature for these terms; here,‘soil’is the physically mobile material that is produced by the mechanical disruption of the underlying bedrock (Fig. 2B), or saprolite (Fig. 2C). Saprolite is the nonmobile, weathered mantle produced by chemical alteration of the bedrock that lies beneath (Dixon et al., 2009b). At the upper boundary, saprolite is incorporated into the mobile soil column through physical disruption by soil production mechanisms such as tree throw, macro- and microfauna burrowing, and frost cracking (Heimsath et al., 1997, 2000, 2012). At the lower boundary, saprolite is produced from parent bedrock by chemical dissolution and mineral transformation. While mineralogical changes and alteration occur throughout the saprolite column, much of the chemical mass loss can occur as a discrete weathering front near the bedrock boundary (Frazier and Graham, 2000; Buss et al., 2004; Fletcher et al., 2006; Lebedeva et al., 2007). We focus specifically on the mass loss caused by chemical processes (here termed chemical weathering) and phys-ical processes (here termed erosion) on soil-mantled hillslopes. By these definitions, weathering within saprolite is purely chemical, while soils evolve by chemical transformations and by physical disruption and erosion.
Methods to quantify soil production and chemical weathering are well established and were applied at each of the threefield sites used in this study and summarized below (Heimsath et al., 2000, 2001, 2002, 2005, 2006; Burke et al., 2007, 2009; Dixon et al., 2009b). To quantify soil production rates, we measure concentrations of the in situ produced cosmogenic radionuclide (CRN),10Be, in the saprolite
or bedrock directly beneath the mobile soil mantle. Measured con-centrations depend on the nuclide production rate and half-life as well as the soil production rate of the target material. For the steady-state soil thicknesses observed across each of ourfield sites, this steady-state soil production rate is equivalent to the local erosion rate, and the CRN methodology follows well-established procedures for determining point-specific erosion rates, using a local CRN pro-duction rate correction based on local soil thickness (Heimsath et al., 1997). Soil thickness is measured by digging soil pits to the soil– bedrock boundary at ~ 10-m intervals across the sites. A selection of pits spanning the full range of observed soil thicknesses for thefield site are used to sample the saprolite used for the CRN analyses and for the chemical weathering analyses that will be summarized next.
Chemical weathering rates in soils and saprolites can be deter-mined at the same locations where we have quantified soil produc-tion rates by measuring zirconium (Zr) concentraproduc-tions with pressed pellet X-rayfluorescence and calculating fractional chemical losses using the chemical depletion fraction (CDF) (Riebe et al., 2001b, 2003, 2004; Dixon et al., 2009b). This method is reasonably well established and described in detail (Kurtz et al., 2001; Granger and Riebe, 2007). For the purposes of this paper, we focus only on the chemical weathering of the saprolite, which is calculated by measur-ing the enrichment of Zr, widely assumed to be immobile, in the Fig. 1.Photograph (by AMH) of typical soil-mantled hillslope used for these and other
saprolite as well as the unweathered bedrock. Using Zr as the conser-vative element, the CDF is calculated as
CDF¼ 1−
where the subscriptpreflects the parent material (unweathered rock) concentrations, and thewrepresents the weathered product concentra-tions (saprolite here, or soil, more generally). Assuming all regolith, in-cluding soil and saprolite, has a relative local steady-state thickness over timescales of production, then the saprolite weathering rate,Wsap, is
Wsap¼Psoil
wherePsoilis the soil production rate (m/Ma) determined from CRN concentrations that are measured from the same saprolite samples that we used to measure Zr concentrations. The percentage of total de-nudation contributed by chemical weathering of the saprolite is deter-mined for any given point by dividing Wsap by the local saprolite production rate. Note that to date studies assume that the saprolite pro-duction rate is equivalent to the local soil propro-duction rate because of the difficulties of actually measuring the saprolite production rate.In addi-tion to quantifying saprolite weathering rates, we are interested in quantifying the extent of chemical weathering in the saprolite, which reflects how deeply weathered the parent material is and could poten-tially act as a proxy for clay content (Burke et al., 2007). While there are many indices of chemical weathering that we summarize and explore at the Point Reyes (PR) site (Burke et al., 2007), we focus on the chemical index of alteration (CIA) (Kirkwood and Nesbitt, 1991). This index mea-sures the proportion of a conservative, but not immobile, major element oxide to the sum of most major element oxides observed in the under-lying bedrock. For thefield sites used here, the CIA can be written in terms of the weight percentages of the major oxides as follows:
CIA¼ Al2O3
Al2O3þNa2OþK2OþCaO
: ð3Þ
The CIA value for unweathered parent material is unique depending on the particular bedrock in question, but the average unweathered granite has a CIA of 60. In comparison, a highly weath-ered soil or saprolite has a CIA of between 90 and 100 (Nesbitt and Young, 1982; Kirkwood and Nesbitt, 1991).
It is critical to note that all studies using both the CDF and the CIA ap-proach to quantify chemical weathering rates and extents across land-scapes typically measure a single sample from a single pit to determine the local CDF or CIA. Important progress in understanding how chemical weathering can depend on climate (Dixon et al., 2009a), tectonics (Riebe et al., 2001b), and other factors (Riggins et al., 2011) depended on the as-sumption that a point measurement on a steady-state hillslope repre-sents local conditions. To assess the validity of this assumption, we expand the above methodology with an intensive sampling scheme to determine local variability in Zr concentrations and in the calculated CIA from major oxide concentrations.
2.2. Local variability
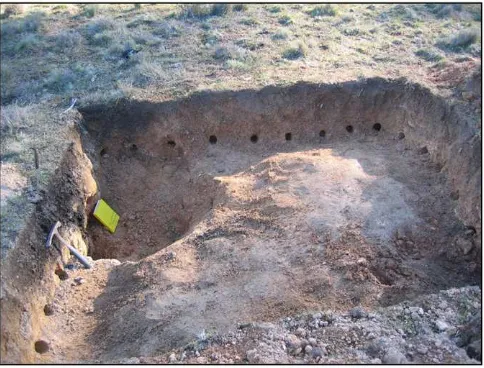
At each of the threefield sites described below, we excavated a single 2-m by 2-m square pit located approximately in the middle of the hillslopes sampled for our previous work on soil production and chemical weathering. We dug each pit through the active soil layer to the top of the physically immobile saprolite layer and careful-ly brushed clean the saprolite surface (Fig. 3). Following mapping and imaging of the pit walls andfloor, we sampled the saprolite on the
floor of the pit on a 50-cm2grid, collecting 25 samples for each pit
using a direct-push soil corer that we inserted vertically into the pit
floor at each grid node. We collected these samples following our pre-vious work and data reported here from these pits have never been published before. We measured bulk density for three of the cores at each pit, and analyzed all 25 samples at each pit for all major and trace elements. For each site, we also measured all major and trace elements in samples of unweathered bedrock to determine the parent material compositions. The analytical uncertainty on the lab measure-ments of Zr was 1–2%, which we increased to 3% for all Zr measure-ments to include other laboratory uncertainties in our uncertainty estimates. Similarly, the propagated uncertainty on the CIA calcula-tions was typically 2–3%, which we increased to 5% to include other uncertainties and applied it to all the CIA values.
To assess the natural variation of measured values from our pits, we calculated simple and error weighted means and several different met-rics to quantify the distribution of data about the means. We began by propagating the internal measurement uncertainties through the mean using a Monte Carlo technique. As anticipated, given the low an-alytical uncertainties on the measurements of major and trace ele-ments, this propagated uncertainty, even at the 2σlevel, does not describe well the distribution of measurements about the weighted or simple mean of the population of samples from each of the three 2-m
(A)
(B)
pits. The likely reason for this observation is that significant external un-certainty, or local (at the 2 × 2 m scale) geological variability, is recorded by the data. To account for the difficultly of constraining sources of dispersion, we used the common practice of multiplying (expanding) the propagated internal uncertainty of the mean by the square root of the mean squared error weighted deviation (MSWD). This‘expanded error’better accounts for the internal uncertainty and external variation, but also fails to adequately describe the distribution of the data. In addition, we also estimated the sample distribution by using resampling with replacement techniques to constrain a 95%
con-fidence interval of the mean. To do this we used a bootstrap technique that randomly choosesn−1 sample values from the population to cal-culate a mean from 1000 simulations. We then solve for the uncertainty that describes 95% of the simulated means. Comparing metrics, howev-er, wefind that the best description of the spread of our data is actually a simple standard deviation of the mean. Because the simple mean and standard deviation best describe the variability of the 2-m pit data, the 95% confidence interval determined by the standard deviation is the same as that determined by the bootstrap technique. For consisten-cy, and to be able to compare local variability at each site with the var-iability measured across each of thefield sites byBurke et al. (2007, 2009), we perform the same statistical analyses for both the Zr and the CIA data from those studies.
3. Field sites
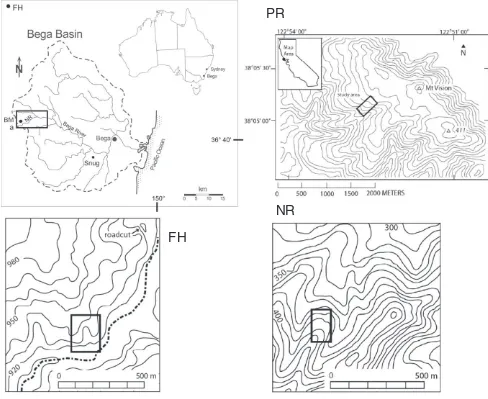
Threefield sites are used here that were used for extensive previ-ous work (Fig. 4). We summarize the critical similarities between thesefield sites here, as well as highlight the differences that enable insightful comparisons to be made between the sites. Two of the
field sites are in southeastern Australia and were originally selected (Heimsath et al., 2000, 2001) to quantify soil production rates and processes for a region experiencing different climate and tectonic forcings from the original work that quantified the soil production function (Heimsath et al., 1997, 1999). Thefirst of these sites, Nunnock River (NR), is at the base of a high relief, steep-faced escarpment that separates a highland region of gentle topography and lower relief from the coastal belt of similarly gentle topography (Heimsath et al., 2000). Importantly, NR is physically separated from the landslide
processes active across the steep escarpment by a narrow ridge and is, therefore, characteristic of upland, soil-mantled landscapes adjacent to actively lowering base levels. The second southeastern Australia site, Frogs Hollow (FH), is on top of the escarpment and is representa-tive of the gently rolling landscape of the highlands (Heimsath et al., 2001). Both sites are soil-mantled upland landscapes that are underlain by granodiorite. Mean annual precipitation (MAP) is higher at NR, at the base of the escarpment (~1200 mm), than at FH (~720 mm), but the dominant soil production and erosion mechanisms are similarly driven by bioturbation by macro- and microfauna and tree-throw. The differ-ence in elevation between the two sites (NR is ~400 m and FH is ~930 m) drives the differences in summer max (~22 °C vs. ~15 °C) and winter min (~8 °C vs. three months with mean temps below zero) temperatures between the two. Details for both sites, as well as an extensive comparison between them are provided byHeimsath et al. (2006).Burke et al. (2009)then built on this study by conducting a chemical weathering study across the escarpment. The third site is on the relatively steep slopes of Mount Vision, in Point Reyes (PR), California, and also underlain by entirely granitic rock (Heimsath et al., 2005; Burke et al., 2007). Although PR is adjacent to the San Andreas Fault, the domi-nant mechanisms of soil production and transport also are bioturbation dominated, and the soil mantle is continuous and smooth despite the steeper slopes. Rainfall at PR is ~800 mm in a Mediterranean climate regime such that most rain falls during the winter months.
4. Previous results
4.1. Soil production
Concentrations of in situ produced CRNs,10Be and26Al, in 14
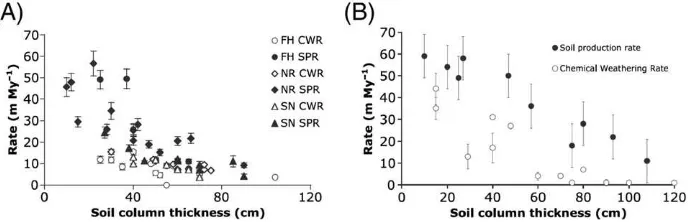
sam-ples of saprolite from beneath the full range of observed soil thick-nesses were used by Heimsath et al. (2000) to quantify the soil production function at the NRfield site. Those data defined an expo-nential decline of soil production rates with increasing overlying soil thickness, with a maximum rate of 53 m/Ma under no soil mantle and a minimum rate of 7 m/Ma beneath 100 cm of soil (Fig. 5).Heimsath et al. (2001)used similar methodology, as well as a numerical model predicting the evolution of the soil mantle, to quantify a similar soil production function at the highland site of FH. Both data sets were ex-panded significantly with the analyses ofHeimsath et al. (2006)that also quantified retreat rates of the passive margin escarpment and in-cludedfield sites on the coastal lowlands as well as at the crest of the escarpment. The robustness of the initial soil production function was solidified with the addition of new data across the fourfield sites that spanned landscapes from the coast to the highlands such that it can be described clearly with 37 samples collected at four differentfield sites as an exponential decline with an intercept of 53 m/Ma and a slope of
−0.02. Data reported byHeimsath et al. (2006)also showed agreement between local soil production rates and catchment-averaged erosion rates determined by CRN analyses of detrital sands.
Similarly, concentrations of in situ produced CRNs,10Be and26Al,
in 13 samples of saprolite from beneath the full range of observed soil thicknesses were used byHeimsath et al. (2005)to quantify a clear exponential decline of soil production rates with increasing soil thickness at the PRfield site in northern California. With an inter-cept of 88 m/Ma and a slope of−0.02, the function was similar to the soil production function quantified byHeimsath et al. (1997)for a nearbyfield site underlain by metasedimentary rocks rather than gra-nitic. The similarity in slope of the dependency of soil production rate on soil depth shows that for all thesefield sites the production rate is halved by a soil cover of 35 cm and reduced to a tenth by 115 cm of soil cover, which is roughly the maximum soil thickness observed at thefield sites (Fig. 5). Soil depth varies across each of thefield sites, with the thinnest soils on the narrow, convex-up ridge crests and thicker soils bordering the unchanneled valleyfloors (Heimsath et al., 2005, 2006). Thus the soil production functions for all of the Fig. 3.Photograph (by AMH) of the FH 2-m pit. The west wall is on the far side of the
field sites imply that the ridge crests are lowering more rapidly than the sideslopes and the areas near the base of the hillslopes. This ap-parent topographic disequilibrium may be counteracted by periodic evacuation of the adjacent colluvialfills, setting up a transient up-slope thinning of soils, as suggested by modeling by Dietrich et al. (2005) and bolstered by recent work (Pelletier and Rasmussen, 2009).Burke et al. (2007, 2009)then used these soil production func-tions to quantify chemical weathering rates and extents for each of thefield areas.
4.2. Chemical weathering
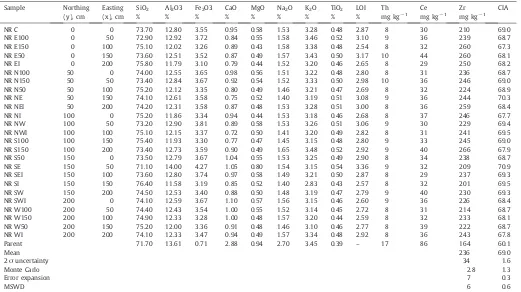
Burke et al. (2009)collected saprolite samples from 34 soil pits ex-cavated across the southeastern Australiafield sites. Measurements of Zr concentrations from these samples were used to calculate a CDF for each saprolite sample with Eq.(1)(Table 1). The measured CDF and the soil production function ofHeimsath et al. (2006)were used in Eq.(2)to calculate chemical weathering rates of the saprolite directly beneath the mobile soil layer. Chemical weathering rates were shown to decrease with increasing soil thickness across thefield sites (Fig. 6).
Burke et al. (2007)reported similar results for PR (Table 1;Fig. 6). Ob-servations across each of these sites posed an interesting enigma when coupled with the observation that the weathered extent of the saprolite increases slightly with increasing soil thickness; an observa-tion also reported at NR, byGreen et al. (2006). An intuitive way to re-solve this enigma was suggested by recent studies (e.g.Dixon et al., 2009a) that quantified the strong positive correlation between physical and chemical weathering rates. Specifically, soil production rates are driven by active bioturbation and are fastest beneath shallow soils, slowing as soil thickness increases downslope and, presumably, the periodicity of impact by a bioturbator decreases. As the physical rate of conversion of saprolite to soil decreases, the supply of fresh minerals available for chemical weathering slows, not only slowing the weathering rate, but also increasing the residence time of the saprolite in the active zone of weathering, thereby increasing the weathered state of the saprolite.
Major and trace element analyses at each of the threefield sites were also used to quantify how spatial variation in chemical weathering is likely to be topographically controlled. Results from PR suggested that saprolite weathering rate decreases with slope
FH
NR
PR
across the divergent ridge and increases with upslope contributing area in the convergent swale.Burke et al. (2007)discussed the poten-tial for such topographic control on saprolite weathering in the context of the controls on subsurface hydrology, but did not have the hydrologic measurements to address these controls fully. Similar
findings from the southeastern Australia sites (Burke et al., 2009) support the need to build detailed hydrologic monitoring into such studies in the future. The two sites in Australia differ slightly in
potential topographic controls, however, such that conclusive results could not be generalized across the escarpment. For example, the de-crease of saprolite weathering with slope observed at PR (Burke et al., 2007) is similar to results from NR but opposite to what was observed at FH (Burke et al., 2009). A similarly surprising comparison between the two southeastern Australia sites was that, at NR, the deep weath-ered extent of the saprolite was greater than at FH. This was consid-ered to be surprising because NR is at the escarpment base with the
(A)
(B)
Soil depth, cm Soil depth, cm
Soil production rate, m My
-1
Soil production rate, m My
-1
Fig. 5.Soil production functions. Symbols in bothfigures are averages of rates from10 Be and26
Al, and error bars represent all errors propagated through nuclide calculations: i.e., uncer-tainty in atomic absorption, accelerator mass spectrometry, bulk density and soil depth measurements, and attenuation length of cosmic rays, but not the unceruncer-tainty in the production rates of the nuclides. (A) Soil production rates plotted for all four southeast Australiafield sites discussed in detail inHeimsath et al. (2006). NR—Nunnock River; FH—Frogs Hollow. The two new sites that were not used for this study, Brown Mountain and Snug, are from the highlands above the escarpment, similar to FH, and the coastal lowlands, relatively close to NR. Erosion rates of bedrock exposed (BRK) at the soil surface are plotted for all sites with different symbols. The variance-weighted bestfit to all soil production data plotted here defines an exponential decline of soil production rates with increasing soil thickness with an intercept of 53 m/Ma and a slope of−0.02. (B) Soil production rates plotted for Point Reyes (PR) and
discussed in detail inHeimsath et al. (2005). Gray diamonds are erosion rates from outcropping tors on ridge crests where the parent material samples were reported byBurke et al. (2007).
Table 1
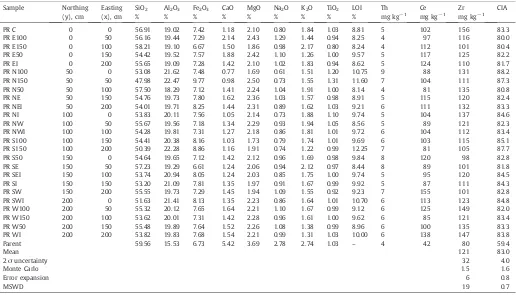
Nunnock River (NR) 2-m pit sample locations, major and trace element compositions.
Sample Northing
Parent 71.70 13.61 0.71 2.88 0.94 2.70 3.45 0.39 – 17 86 164 60.1
Mean 236 69.0
2σuncertainty 34 1.6
Monte Carlo 2.8 1.3
Error expansion 7 0.3
highest rates of erosion and greatest relief, while FH is the low relief landscape above the escarpment that we predicted to be more deeply weathered.
Despite such complexities, each of these studies quantified com-pelling and new relationships between soil thickness, topography, and chemical weathering, as well as helping extend significantly our understanding of the connections between physical and chemical weathering across upland, soil-mantled landscapes. Although the analytical uncertainty on the major and trace element analyses was quite small, the data showed considerable scatter when plotted against topographic metrics (Burke et al., 2007, 2009), which is typi-cal forfield-based data collected from actively eroding landscapes. Two realities emerged. Thefirst was that significantly higher sample density across the landscape would likely help resolve some of the uncertainty introduced by the scatter in the data. The second was that similar studies pursued in the future need to constrain the local variability of both the major and trace elements being measured to quantify the chemical weathering rates and extents across the land-scape. To address the second reality, we analyzed samples at each of thefield sites to constrain local variability.
5. Results and discussion
5.1. Nunnock River (NR)
We measured all major and trace elements across the 4-m2saprolite
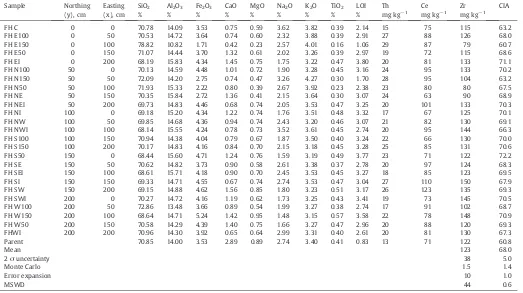
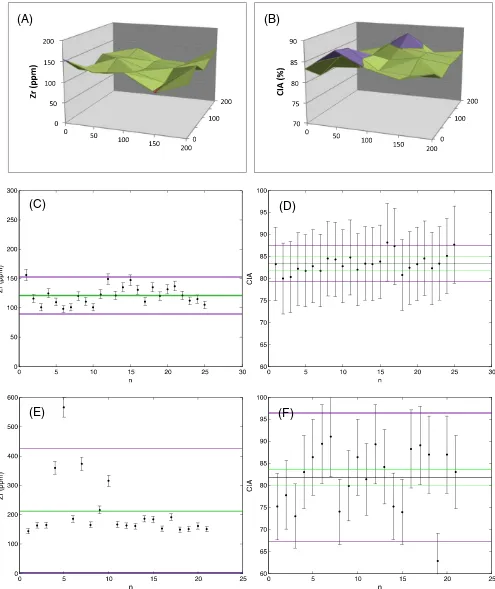
surface at the base of a 35-cm-deep, 2-m pit at the escarpment base at the NRfield site (Table 1). Spatial variation of Zr (Fig. 7A) and the chem-ical index of alteration (CIA) (Fig. 7B) are relatively small. The simple mean Zr concentration is 236 ppm with a 2 standard deviation (2σ)
uncertainty of 34 ppm (14%), which we consider to describe the pit-scale variability of the data well (Fig. 7C). A bootstrap model (usingn−1 replacement techniques and 1000 simulations) confirmed that 2 standard deviations constrain the uncertainty about the mean with at least 95% confidence in this and all subsequent plots. Conversely, the analytical solution of the propagation of the internal uncertainty through the mean and the Monte Carlo internal uncertainty propaga-tion yield uncertainties of 2.8 ppm (1%), which barely accounts for any of the local variability in Zr concentrations. Similarly, the mean square weighted deviation (MSWD) and error expansion metrics calcu-late uncertainties that are much smaller than the variability in the data (6 and 7 ppm, respectively, or 2.5 and 3% of the mean) and we leave off any further discussions of these metrics, save reporting the values in the
figure captions. The variability observed at the NR pit shows no spatial structure, and we attribute the variation of Zr to be indicative of natural variability due to either local variation in the parent material Zr concen-trations or local variability in saprolite weathering. The average parent material Zr concentration, measured byBurke et al. (2009)was 87 ppm. The simple mean of the CIA calculations of each of the samples at the base of the 2-m pit is 69 (Fig. 7B) with a 2 standard deviation
uncertainty of 1.6 (2.3%). In this case alone from the three sites, the analytical solution of the internal uncertainty and the Monte Carlo uncertainty propagation are similar to the 2 σ uncertainty at 1.3
(2%;Fig. 7D). Similar to the Zr measurements, CIA variation across the pit floor shows no spatial structure. The parent material CIA reported byBurke et al. (2009)was 62, suggesting an alteration of only 11% (dividing parent material CIA by the simple mean CIA from this pit) and revealing a surprising contrast with Zr enrichment, which is 271%. Two relatively simple scenarios may explain this ap-parent disagreement between the two data sets. Thefirst is that the parent material Zr concentrations and CIA have similar variability to the dispersion we observe in the 25 2-m pits samples and that the three samples collected and reported byBurke et al. (2009)were, quite simply, not representative of the local parent material values. Unfortunately, we did not perform the same 2-m by 2-m grid sample across a clean face of unweathered bedrock; the exceptional value of such a set of samples to compare with the local saprolite variability only became clear in retrospect and will be the subject of a follow-up study to further understand local variability. The second scenario is that the local weathering at the 2-m pit was significant enough to remove the Al2O3, as well as the major oxides, such that
the calculated CIA (Eq.(3)) is as low as the relatively unweathered parent material. We favor this scenario given other observations of deep weathering at this location on the site (Green et al., 2006; Burke et al., 2009).
We compare these variations across thefloor of a single pit with similar data measured for the individual soil pits at NR byBurke et al. (2009)(summarized inTable 1). Treating the data from the indi-vidual pits as though they represent a single, average condition for NR, we observe significantly greater variation in Zr concentrations (Fig. 7e) and in the CIA (Fig. 7f). The Zr measurements from all 10 soil pits have a simple mean of 219 ppm with a 2 standard deviation uncertainty of 106 ppm (48%), and analytical and Monte Carlo uncer-tainty propagations of 4 ppm (2%). This high spatial variation of Zr measurements does not correlate with soil thickness, or other mor-phometric parameters and is, instead, interpreted to be indicative of the spatial variability of saprolite weathering as well as variations in parent material Zr concentrations, without being definitive because of the relatively low spatial extent of the samples. The CIA for the 10 pits at NR has a mean of 71 with a 2 standard deviation uncertainty of 6 (8%) and analytical and Monte Carlo uncertainty propagations of 1.3 (2%). This relatively low variability of CIA across NR is potentially whyBurke et al. (2009)had difficulty demonstrating topographic control on the weathered extent of the saprolite. They did, howev-er, observe that the percentage of total denudation caused by chemical weathering of the saprolite generally increased with in-creasing soil thickness and did not vary with local slope. We note that the populations of Zr and CIA are not significantly different between the 2-m pit samples and the compilation of all of the indi-vidual pit samples.
5.2. Frogs Hollow (FH)
Similar to the above, we measured all major and trace elements across the 4-m2 saprolite surface at the base of the 30-cm-deep,
two-meter pit at the top of the escarpment base at the FHfield site (Fig. 3; Table 2). Spatial variation of Zr (Fig. 8A) and the CIA (Fig. 8B) are strikingly different than at NR and suggestive of some potential spatial structure. Specifically, Zr and CIA are low relative
(A)
(B)
(C)
(D)
to Zr and CIA in the parent material, indicative of lower chemical weathering, in what maps as the lower left, or northeast, quadrants ofFig. 8A and B (Table 2). This quadrant is the one closer to the cam-era from the local depression left by our initial sample collection excavations shown inFig. 3(lower left of the image). The simple mean Zr concentration is 123 ppm with a 2 standard deviation uncer-tainty of 38 ppm (31%), which we consider to describe the local var-iability of the data well (Fig. 8C), and is strikingly greater than that observed at NR. Conversely, similar to NR, the analytical solution of the propagation of the internal uncertainty through the mean and the Monte Carlo internal uncertainty propagation yield uncertainties of 1.5 ppm (1%), which barely accounts for any of the local variability in Zr concentrations. The MSWD and error expansion metrics calcu-late uncertainties that are quite different from each other (44 and 10 ppm, respectively, or 36 and 8% of the mean), and the FH 2-m pit is the only case, along with the below individual pit data also from FH, where the MSWD is greater than the 2σstandard deviation.
The average parent material Zr concentration, reported byBurke et al. (2009)was 84 ppm.
The simple mean of the CIA calculations for each of the samples at the base of the 2-m pit at FH is 68, almost identical to NR's mean of 69 (Fig. 8B), but the 2 standard deviation uncertainty is almost three times higher, at 5 (7%). The analytical solution of the internal uncer-tainty, and the Monte Carlo uncertainty propagation are much lower than the 2σuncertainty of 1.4 (2%) (Fig. 8D). Similar to the
Zr measurements, the lower values of the CIA appear to cluster in the northeast quadrant of the pitfloor, but this correlated with no geologic observation. The parent material CIA reported byBurke et al. (2009)was 65, suggesting an alteration of only 6%, compared to an average enrichment in Zr of 46%.
We compared these variations across thefloor of the single, 2-m pit with similar data measured across the individual soil pits at FH byBurke et al. (2009)(Table 2). Similar to NR, we treated the data from the individual pits as though they represent a single, average condition for FH and observed significantly greater variation in Zr concentrations (Fig. 8E) and the CIA (Fig. 8F). The Zr measurements from all 10 soil pits have a simple mean of 154 ppm with a 2 standard deviation uncertainty of 96 ppm (62% compared to 48% at NR) and analytical and Monte Carlo uncertainty propagations of 2.5 ppm (2%). This comparatively high spatial variation of Zr measurements in the pits does not correlate with soil thickness or other morphomet-ric parameters and is, instead, interpreted to be indicative of the spa-tial variability of saprolite weathering as well as variations in parent material Zr concentrations, without being definitive because of the relatively low spatial extent of the samples. The CIA across the 16 pits at FH has a mean of 65 with a 2 standard deviation uncertainty of 8 (12% compared to 8% at NR), and analytical and Monte Carlo un-certainty propagations of 1.6 (2.5%). This relatively low variability of CIA across FH, similar to NR, is potentially whyBurke et al. (2009)
had difficulty demonstrating topographic control on the weathered Table 2
Frogs Hollow (FH) 2-m pit sample locations, major and trace element compositions.
Sample Northing
FH S100 100 150 70.94 14.38 4.04 0.79 0.67 1.87 3.50 0.40 3.24 22 66 130 70.0
FH S150 100 200 70.17 14.83 4.16 0.84 0.70 2.15 3.18 0.45 3.28 25 85 131 70.6
FH S50 150 0 68.44 15.60 4.71 1.24 0.76 1.59 3.19 0.49 3.77 23 71 122 72.2
FH W150 200 100 68.64 14.71 5.24 1.42 0.95 1.48 3.15 0.57 3.58 22 78 148 70.9
FH W50 200 150 70.58 14.29 4.39 1.40 0.75 1.66 3.27 0.47 2.96 20 88 120 69.3
FHWI 200 200 70.96 14.30 3.92 0.65 0.64 2.99 3.31 0.40 2.61 20 81 130 67.3
Parent 70.85 14.00 3.53 2.89 0.89 2.74 3.40 0.41 0.83 13 71 122 60.8
Mean 123 68.0
2σuncertainty 38 5.0
Monte Carlo 1.5 1.4
Error expansion 10 1.0
MSWD 44 0.6
extent of the saprolite as they combined data across the southeastern Australia sites. Also similar to NR, we note that the populations of both Zr and CIA are not significantly different between the 2-m pit samples and the compilation of all of the individual pit samples.
5.3. Point Reyes (PR)
At PR, our 2-m pit was at the base of 83 cm of soil and located toward the base of the hillslope studied in detail by Burke et al.
(A)
(B)
(C)
(D)
(E)
(F)
(2007). They observed high weathering intensities and clay content in the saprolites at such depths in comparison to lower weathering intensities and no observable clays in the saprolites beneath shallower soil depths (they sampled saprolite from 21 pits across
the full range of soil depths observed at PR). Spatial variation of Zr concentrations (Fig. 9A) and the CIA for our 2-m pit (Fig. 9B) show no spatial structure, although high Zr concentrations roughly corre-late with high CIAs (Table 3). Parent material measured byBurke et
(A)
(B)
(C)
(D)
(E)
(F)
al. (2007)had a Zr concentration of 145 ppm and a CIA of 59, such that the simple mean Zr concentration of the 2-m pit data of 121 ppm (Fig. 9C), with a 2σstandard deviation of 32 (25%), is
actu-ally lower than the parent material Zr concentration, and the mean CIA of 83 (Fig. 9D), with a 2σstandard deviation of 4 (5%), is higher
than the parent material CIA, indicating conflicting results. Namely, the relative depletion of Zr in the saprolite compared to high alter-ation based on the major oxides suggests opposite weathering ex-tents. Comparing the Zr concentrations and the CIA from the 2-m pit data with the data from the pits used byBurke et al. (2007)(Zr concentrations inFig. 9E and CIA inFig. 9F) suggests that, instead, the Zr concentrations in the 2-m pit are systematically offset. For the pits, the mean [Zr] is 213 ppm with a 2 standard deviation of 211 (99%), and the mean CIA is 82 with a 2 standard deviation of 15 (18%). Comparing the 2-m pit data with these shows that, unlike ei-ther the NR or FH data, Zr concentrations from the 2-m pit are all lower or at the very low end of the Zr concentrations measured in the individual pits, while the 2-m pit CIA values are right in the mid-dle of the CIA values from the individual pits, similar to NR and to FH. Fortunately, a simple explanation for this discrepancy lies in which laboratories the measurements were done in and, therefore, presents an important implication for using different facilities. All of the 2-m pit Zr measurements were done by us using the XRF at Keene State College, while the soil pit data were collected in two stages: one at the UC Berkeley XRF used byGreen et al. (2006)and the second by ALS Chemex in Nevada. We believe, therefore, that our own standard calibration for the 2-m pit Zr data resulted in values systematically lower than those measured at the other facilities.
The pit data from PR reveal another interesting difference from both of the southeastern Australiafield sites, NR and FH. We observe much higher spatial variability in both the Zr concentration, which has a 2 standard deviation uncertainty that is 99% of the mean, com-pared to 48% and 62% for NR and FH, respectively, and in the CIA, which has a 2 standard deviation uncertainty that is 18% of the
mean, compared to 8% and 12% for NR and FH, respectively. This dis-persion of the population of pit data is obvious from the spread of the data plotted inFig. 9E and F and is most likely indicative of the signif-icantly wider coverage of the PR pits (Heimsath et al., 2005) across thefield site, compared to the NR (Heimsath et al., 2000) or FH (Heimsath et al., 2001) pits. Recognizing and, therefore, quantifying the high spatial variability of these parameters used extensively in weathering studies is, we suggest, the most important take-home message of this paper.
6. Conclusions
This study sheds important quantitative light on the extent of local (~ 1 m) andfield-site (~ 100 m) scale variability of two important in-dices of chemical weathering: Zr and the chemical index of alteration (CIA). Chemical weathering rates across diverse landscapes are quan-tified by a number of recent and ongoing studies by measuring Zr concentrations in parent material, saprolite, and soils and using them to determine chemical depletion fractions (CDFs). These CDFs are then used with cosmogenic nuclibased denudation rates to de-termine chemical weathering rates. In all of the studies that we know of, the Zr concentrations in the parent material are acknowledged to be variable but are rarely constrained beyond a few measurements of locally outcropping bedrock thought to represent the unweathered parent material. Importantly, measurements in the soils and sapro-lites that are sampled to determine the various aspects of chemical weathering pursued by these studies are rarely, if ever, duplicated to determine their variability. The same is true for the much less frequently used CIA.
We pursued an intensive sampling approach at threefield sites where we had previously quantified soil production and chemical weathering rates and processes to collect the data needed to quantify how the major and trace elements do, in fact, vary at a local scale. Specifically, we excavated 2-m by 2-m pits through the actively Table 3
Point Reyes (PR) 2-m pit sample locations, major and trace element compositions.
Sample Northing
PR S100 100 150 54.41 20.38 8.16 1.03 1.73 0.79 1.74 1.01 9.69 6 103 115 85.1
PR S150 100 200 50.39 22.28 8.86 1.16 1.91 0.74 1.22 0.99 12.25 7 81 105 87.7
eroding soil mantle to the physically immobile but chemically weath-ered saprolite and collected 25 separate samples across the base of the pit. Analyzing these samples for major and trace element abun-dances enabled us to quantify local variability and to compare it to the variability previously observed in soil pits across the samefield sites. For each of the sites, wefind that the variability in the 2-m pit data lies within the variability observed in the same data measured in individual soil pits across each of thefield sites and that the differ-ences between sites are consistent with previously published results. We believe that the most important conclusion from this study is that future and ongoing chemical weathering studies need to extend sig-nificantly the sampling strategy of single samples collected from indi-vidual pits to include much greater numbers of replicate samples, as well as extending the observations across the full range of topography observed at thefield sites. While this may be obvious, the reality is that few studies have justified the added expense of analyzing such samples. We conclude, therefore, that these data from our 2-m pits offer a new approach to quantifying local scale variability for studies that are using similar multifaceted measurements to quantify hill-slope soil production and erosion processes. We hope that research programs, such as the Critical Zone Observatory network, will help establish such sampling protocols to help facilitate comparison of spatial variability across sites.
Acknowledgements
Sincere thanks are due to John Chappell and Ron Amundson for intellectual inspiration and extensive help in the field, Kyungsoo Yoo and Jean Dixon for the guidance with the chemical weathering analyses, and Byron Adams for the help with the statistical analyses and interpretation. Damien Kelleher provided key logistical support in Australia, and Rishi Satyadharma is the very helpful landowner of the NR site who continues in his support of scientific exploration of his land. Les Blake in Bredbo, NSW, Australia, is thanked for access to Crown lands at the FH site. Tim Allen at Keene State College, NH, provided lab access. Thanks are also given to Ken Ferrier and Josh West for helpful edits and to the editors for their patience and copy editing. Funding for this work was from a GSA Graduate Fellowship to BCB and NSF-EAR-0239655 grant to AMH.
References
Anderson, R.S., 1994. Evolution of the Santa Cruz Mountains, California, through tectonic growth and geomorphic decay. Journal of Geophysical Research—Solid Earth 99 (B10), 20161–20179.
Anderson, R.S., Humphrey, N.F., 1989. Interaction of weathering and transport process-es in the evolution of arid landscapprocess-es. In: Cross, T.A. (Ed.), Quantitative Dynamic Stratigraphy. Prentice-Hall, Englewood Cliffs, N.J., pp. 349–361.
Anderson, S.P., von Blanckenburg, F., White, A.F., 2007. Physical and chemical controls on the critical zone. Elements 3 (5), 315–319.
Bern, C.R., Brzezinski, M.A., Beucher, C., Ziegler, K., Chadwick, O.A., 2010. Weathering, dust, and biocycling effects on soil silicon isotope ratios. Geochimica et Cosmochimica Acta 74 (3), 876–889.
Bierman, P.R., 2004. Rock to sediment—slope to sea with Be-10—rates of landscape change. Annual Review of Earth and Planetary Sciences 32, 215–255.
Brantley, S.L., Goldhaber, M.B., Ragnarsdottir, K.V., 2007. Crossing disciplines and scales to understand the Critical Zone. Elements 3 (5), 307–314.
Burbank, D.W., Blythe, A.E., Putkonen, J., Pratt-Sitaula, B., Gabet, E., Oskin, M., Barros, A., Ojha, T.P., 2003. Decoupling of erosion and precipitation in the Himalayas. Nature 426 (6967), 652–655.
Burke, B.C., Heimsath, A.M., White, A.F., 2007. Coupling chemical weathering with soil production across soil-mantled landscapes. Earth Surface Processes and Landforms 32 (6), 853–873.
Burke, B.C., Heimsath, A.M., Dixon, J.L., Chappell, J., Yoo, K., 2009. Weathering the escarpment: chemical and physical rates and processes, south-eastern Australia. Earth Surface Processes and Landforms 34 (6), 768–785.
Buss, H.L., Brantley, S.L., Sak, P.B., White, A.F., 2004. Mineral dissolution at the granite– saprolite interface. In: Wanty, R.B., Seal, R.R.I. (Eds.), 11th International Sympo-sium on Water–Rock Interaction, 11. Taylor and Francis, Saratoga Springs, NH, pp. 819–823.
Dietrich, W.E., Perron, J.T., 2006. The search for a topographic signature of life. Nature 439, 411–418.
Dietrich, W.E., Reiss, R., Hsu, M.-L., Montgomery, D.R., 1995. A process-based model for colluvial soil depth and shallow landsliding using digital elevation data. Hydrolog-ical Processes 9, 383–400.
Dietrich, W.E., Bellugi, D., Heimsath, A.M., Roering, J.J., Sklar, L., Stock, J.D., 2003. Geo-morphic transport laws for predicting the form and evolution of landscapes. In: Wilcock, P.R., Iverson, R. (Eds.), Prediction in Geomorphology. Geophysical Mono-graph Series. AGU, Washington, D.C., pp. 103–132.
Dixon, J.L., Heimsath, A.M., Kaste, J., Amundson, R., 2009a. Climate-driven processes of hillslope weathering. Geology 37 (11), 975–978.
Dixon, J.L., Heimsath, A.M., Amundson, R., 2009b. The critical role of climate and sapro-lite weathering in landscape evolution. Earth Surface Processes and Landforms 34 (11), 1507–1521.
Dixon, J.L., Hartshorn, A.S., Heimsath, A.M., DiBiase, R.A., Whipple, K.X., 2012. Chemical weathering response to tectonic forcing: a soils perspective from the San Gabriel Mountains, California. Earth and Planetary Science Letters 323, 40–49.
Dosseto, A., Hesse, P.P., Maher, K., Fryirs, K., Turner, S., 2010. Climatic and vegetation control on sediment dynamics during the last glacial cycle. Geology 38 (5), 395–398.
Ferrier, K.L., Kirchner, J.W., Finkel, R.C., 2005. Erosion rates over millennial and decadal timescales at Caspar Creek and Redwood Creek, Northern California Coast Ranges. Earth Surface Processes and Landforms 30 (8), 1025–1038.
Ferrier, K.L., Kirchner, J.W., Finkel, R.C., 2012. Weak influences of climate and mineral supply rates on chemical erosion rates: measurements along two altitudinal tran-sects in the Idaho Batholith. Journal of Geophysical Research—Earth Surface 117.
http://dx.doi.org/10.1029/2011jf002231.
Fletcher, R.C., Buss, H.L., Brantley, S.L., 2006. A spheroidal weathering model coupling porewater chemistry to soil thicknesses during steady-state denudation. Earth and Planetary Science Letters 244 (1–2), 444–457.
Frazier, C.S., Graham, R.C., 2000. Pedogenic transformation of fractured granitic bedrock, southern California. Soil Science Society of America Journal 64 (6), 2057–2069. Gilbert, G.K., 1877. Geology of the Henry Mountains, (Utah), Geographical and
Geolog-ical Survey of the Rocky Mountains Region. U.S., Government Printing Office, Washington, D.C., U.S.
Gilbert, G.K., 1909. The convexity of hilltops. Journal of Geology 17 (4), 344–350. Granger, D.E., Riebe, C.S., 2007. Cosmogenic nuclides in weathering and erosion. Treatise
on Geochemistry 1–43.
Green, E.G., Dietrich, W.E., Banfield, J.F., 2006. Quantification of chemical weathering rates across an actively eroding hillslope. Earth and Planetary Science Letters 242, 155–169.
Hack, J.T., 1960. The interpretation of erosional topography in humid temperate regions. American Journal of Science 258A, 80–97.
Heimsath, A.M., Dietrich, W.E., Nishiizumi, K., Finkel, R.C., 1997. The soil production function and landscape equilibrium. Nature 388, 358–361.
Heimsath, A.M., Dietrich, W.E., Nishiizumi, K., Finkel, R.C., 1999. Cosmogenic nuclides, topography, and the spatial variation of soil depth. Geomorphology 27 (1–2), 151–172.
Heimsath, A.M., Chappell, J., Dietrich, W.E., Nishiizumi, K., Finkel, R.C., 2000. Soil production on a retreating escarpment in southeastern Australia. Geology 28 (9), 787–790.
Heimsath, A.M., Chappell, J., Dietrich, W.E., Nishiizumi, K., Finkel, R.C., 2001. Late Quaternary erosion in southeastern Australia: afield example using cosmogenic nuclides. Quaternary International 83–5, 169–185.
Heimsath, A.M., Chappell, J., Spooner, N.A., Questiaux, D.G., 2002. Creeping soil. Geolo-gy 30 (2), 111–114.
Heimsath, A.M., Furbish, D.J., Dietrich, W.E., 2005. The illusion of diffusion:field evidence for depth-dependent sediment transport. Geology 33 (12), 949–952. Heimsath, A.M., Chappell, J., Finkel, R.C., Fifield, L.K., Alimanovic, A., 2006. Escarpment
erosion and landscape evolution in southeastern Australia. Geological Society of America Special Paper, Penrose Conference Series, 398, pp. 173–190.
Heimsath, A.M., DiBiase, R.A., Whipple, K.X., 2012. Soil production limits and the tran-sition to bedrock dominated landscapes. Nature Geoscience 5 (3), 210–214. Hole, F.D., 1981. Effects of animals on soil. Geoderma 25, 75–112.
Kirkwood, D.E., Nesbitt, H.W., 1991. Formation and evolution of soils from an acidified watershed, Plastic Lake, Ontario, Canada. Geochimica et Cosmochimica Acta 55, 1295–1308.
Kurtz, A.C., Derry, L.A., Chadwick, O.A., 2001. Accretion of Asian dust to Hawaiian soils: isotopic, elemental, and mineral mass balances. Geochimica et Cosmochimica Acta 65 (12), 1971–1983.
Lebedeva, M.I., Fletcher, R.C., Balashov, V.N., Brantley, S.L., 2007. A reactive diffusion model describing transformation of bedrock to saprolite. Chemical Geology 244 (3–4), 624–645.
Lutz, H.J., 1960. Movement of rocks by uprooting of forest trees. American Journal of Science 258, 752–756.
Lutz, H.J., Griswold, F.S., 1939. The influence of tree roots on soil morphology. American Journal of Science 258, 389–400.
Matsuoka, N., 1990. The rate of bedrock weathering by frost action:field measure-ments and a predictive model. Earth Surface Processes and Landforms 15, 73–90. Mitchell, P., 1988. The influences of vegetation, animals and micro-organisms on soil processes. In: Viles, H.A. (Ed.), Biogeomorphology. Basil Blackwell, New York, pp. 43–82.
Nesbitt, H.W., Young, G.M., 1982. Early Proterozoic climates and plate motions inferred from major element chemistry of lutites. Nature 299, 715–717.
Norman, S.A., Schaetzl, R.J., Small, T.W., 1995. Effects of slope angle on mass move-ments by tree uprooting. Geomorphology 14, 19–27.
Pelletier, J.D., Rasmussen, C., 2009. Quantifying the climatic and tectonic controls on hillslope steepness and erosion rate. Lithosphere 1 (2), 73–80.
Porder, S., Chadwick, O.A., 2009. Climate and soil-age constraints on nutrient uplift and retention by plants. Ecology 90 (3), 623–636.
Porder, S., Hilley, G.E., Chadwick, O.A., 2007. Chemical weathering, mass loss, and dust inputs across a climate by time matrix in the Hawaiian Islands. Earth and Planetary Science Letters 258 (3–4), 414–427.
Riebe, C.S., Kirchner, J.W., Granger, D.E., 2001a. Quantifying quartz enrichment and its consequences for cosmogenic measurements of erosion rates from alluvial sedi-ment and regolith. Geomorphology 40, 15–19.
Riebe, C.S., Kirchner, J.W., Granger, D.E., Finkel, R.C., 2001b. Strong tectonic and weak climatic control of long-term chemical weathering rates. Geology 29, 511–514.
Riebe, C.S., Kirchner, J.W., Finkel, R.C., 2003. Long-term rates of chemical weathering and physical erosion from cosmogenic nuclides and geochemical mass balance. Geochimica et Cosmochimica Acta 67 (22), 4411–4427.
Riebe, C.S., Kirchner, J.W., Finkel, R.C., 2004. Erosional and climatic effects on long-term chemical weathering rates in granitic landscapes spanning diverse climate regimes. Earth and Planetary Science Letters 224 (3–4), 547–562.
Riggins, S.G., Anderson, R.S., Anderson, S.P., Tye, A.M., 2011. Solving a conundrum of a steady-state hilltop with variable soil depths and production rates, Bodmin Moor, UK. Geomorphology 128 (1–2), 73–84.
Rosenbloom, N.A., Anderson, R.S., 1994. Hillslope and channel evolution in a marine terraced landscape, Santa-Cruz, California. Journal of Geophysical Research— Solid Earth 99 (B7), 14013–14029.
Schaetzl, R.J., Follmer, L.R., 1990. Longevity of treethrow microtopography: implica-tions for mass wasting. Geomorphology 3, 113–123.
West, A.J., 2012. Thickness of the chemical weathering zone and implications for erosional and climatic drivers of weathering and for carbon-cycle feedbacks. Geol-ogy 40 (9), 811–814.