Data Sources: Ministries of Health in SEAR Countries.
Published by
Immunization & Vaccine Development
, World Health Organization, Regional Office for South-East Asia, New Delhi
–
110002, India
Tel: 91-11-2337-0804 / 91-11-4304-0000 Fax: 91-11-2337-0251 / 0106 E-mail: [email protected], URL:
http://www.searo.who.int/topics/immunization/
Vol. 22, Week 16, 2018
Published 23 April 2018
Meetings/ Important events:
Ninth meeting of SEAR Immunization Technical Advisory Group (SEAR-ITAG), New Delhi, 17 to 20 July 2018
Third Meeting of the South-East Asia Regional Verification Commission for Measles Elimination and Rubella/ CRS Control (SEA-RVC),
Kathmandu, Nepal, 31 July to 2 August 2018
Table 1: Measles & Rubella Laboratory Supported Case-based Surveillance Performance Indicators by Country, 2018* (data as of 23 April 2018)
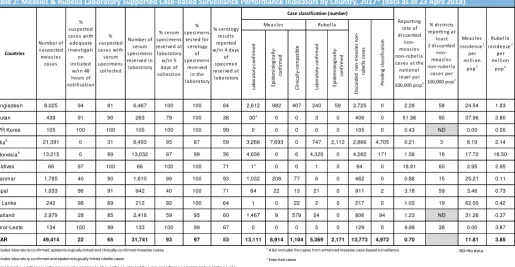
Table 2: Measles & Rubella Laboratory Supported Case-based Surveillance Performance Indicators by Country, 2017* (data as of 23 April 2018)
La
b
o
ra
to
ry
-c
o
n
fi
rm
e
d
E
p
id
e
m
io
lo
g
ic
a
ll
y-co
n
fi
rm
e
d
C
li
n
ic
a
ll
y-co
m
p
a
ti
b
le
La
b
o
ra
to
ry
-c
o
n
fi
rm
e
d
E
p
id
e
m
io
lo
g
ic
a
ll
y-co
n
fi
rm
e
d
Bangladesh 8,025 94 81 6,467 100 100 64 2,612 982 407 240 59 3,725 0 2.28 58 24.54 1.83
Bhutan 439 91 90 263 79 100 38 30* 0 0 3 0 406 0 51.38 90 37.96 3.80
DPR Korea 105 100 100 105 100 100 99 0 0 0 0 0 105 0 0.43 ND 0.00 0.00
India3 21,391 0 31 6,493 95 87 59 3,268 7,693 0 747 2,112 2,866 4,705 0.21 3 8.19 2.14
Indonesia4
13,215 0 99 13,032 97 99 36 4,636 0 6 4,320 0 4,082 171 1.56 16 17.72 16.50
Maldives 66 97 100 66 100 100 71 1* 0 0 1 0 64 0 18.91 60 2.95 2.95
Myanmar 1,785 40 90 1,610 99 100 93 1,032 208 77 6 0 462 0 0.88 15 25.21 0.11
Nepal 1,033 96 91 942 40 100 71 64 22 13 21 0 911 2 3.18 59 3.46 0.73
Sri Lanka 242 98 89 212 92 100 64 1 0 22 2 0 217 0 1.03 19 62.00 0.42
Thailand 2,979 28 85 2,418 59 95 60 1,467 9 579 24 0 806 94 1.23 ND 31.26 0.37
Timor-Leste 134 100 99 133 100 99 67 0 0 0 5 0 129 0 9.98 38 0.00 3.87
SEAR 49,414 22 65 31,741 93 97 53 13,111 8,914 1,104 5,369 2,171 13,773 4,972 0.70 11.81 3.85
1 Includes labo rato ry-co nfirmed, epidemio lo gically-linked and clinically-co nfirmed measles cases 4 A lso includes the cases fro m enhanced measles case-based surveillance.
ND=No data
2 Includes labo rato ry-co nfirmed and epidemio lo gically-linked rubella cases
* Impo rted cases
3 Case based surveillance is in the pro cess o f expansio n to all o ver the co untry and thus may no t reflect a co mplete picture o f the co untry
* Figures in the table 2 are restricted to availability of various dates required for calculation. Thus they may not adequately reflect cases with missing dates for various timelines.
%s peci mens tes ted for s erol ogy
of s peci mens
recei ved i n the l a bora tory
% s erol ogy res ul ts reported w/i n 4 da ys
of s peci men recei ved a t l a bora tory
Case classification (number)
Reporti ng ra te of di s ca rded
non-mea s l es non-rubel l a ca s es a t the na ti ona l l evel per 100,000 popn
% di s tri cts reporti ng a t
l ea s t 2 di s ca rded
non-mea s l es non-rubel l a
ca s es per 100,000 popn
Mea s l es i nci dence1
per mi l l i on
popn
% s erum s peci mens recei ved a t l a bora tory w/i n 5 da ys of col l ecti on
Rubel l a i nci dence2
per mi l l i on
popn
Mea s l es Rubel l a
D
is
ca
rd
e
d
n
o
n
-m
e
a
sl
e
s
n
o
n
-ru
b
e
ll
a
c
a
se
s
P
e
n
d
in
g
c
la
ss
if
ic
a
ti
o
n
Countries
Number of s us pected mea s l es
ca s es % s us pected ca s es wi th a dequa te i nves ti ga ti
on i ni ti a ted
w/i n 48 hours of noti fi ca ti on
% s us pected ca s es wi th s erum s peci mens
col l ected Number of
s erum s peci mens recei ved i n l a bora tory
La
b
o
ra
to
ry
-c
o
n
fi
rm
e
d
E
p
id
e
m
io
lo
g
ic
a
ll
y-co
n
fi
rm
e
d
C
li
n
ic
a
ll
y-co
m
p
a
ti
b
le
La
b
o
ra
to
ry
-c
o
n
fi
rm
e
d
E
p
id
e
m
io
lo
g
ic
a
ll
y-co
n
fi
rm
e
d
Bangladesh 1,141 95 96 1,091 100 91 89 325 12 10 40 2 646 106 1.27 19 6.82 0.83
Bhutan 48 98 100 47 62 98 66 9* 0 0 1 0 38 0 15.63 50 37.02 4.11
DPR Korea 0 0 0 0 0 0 0 0 0 0 0 0.00 ND 0.00 0.00
India3 9,153 0 33 2,720 83 52 32 983 26 0 123 0 270 7,751 0.06 1 2.41 0.29
Indonesia4
656 0 100 655 98 95 90 133 0 1 193 0 293 36 0.36 4 1.64 2.37
Maldives 8 38 88 7 71 100 57 0 0 0 0 0 7 1 6.72 15 0.00 0.00
Myanmar 53 87 53 28 86 100 96 27 0 0 0 0 19 7 0.12 2 1.68 0.00
Nepal 289 99 96 175 76 91 0 13 0 5 5 0 149 117 1.67 23 2.02 0.56
Sri Lanka 37 89 81 28 89 100 64 1 0 2 0 0 32 2 0.48 4 62.00 0.42
Thailand 755 34 89 632 74 97 53 288 4 160 9 0 275 19 1.37 ND 22.60 0.45
Timor-Leste 58 97 97 56 102 88 86 0 0 0 2 0 48 8 12.07 23 0.00 5.03
SEAR 12,198 15 49 5,439 87 73 53 1,779 42 178 373 2 1,777 8,047 0.09 3.28 0.61
1
Includes labo rato ry-co nfirmed, epidemio lo gically-linked and clinically-co nfirmed measles cases 4
A lso includes the cases fro m enhanced measles case-based surveillance. ND=No data
2 Includes labo rato ry-co nfirmed and epidemio lo gically-linked rubella cases
* Impo rted cases
3 Case based surveillance is in the pro cess o f expansio n to all o ver the co untry and thus may no t reflect a co mplete picture o f the co untry
* Figures in the table 1 are restricted to availability of various dates required for calculation. Thus they may not adequately reflect cases with missing dates for various timelines.
%s peci mens tes ted for s erol ogy
of s peci mens
recei ved i n the l a bora tory
% s erol ogy res ul ts reported w/i n 4 da ys
of s peci men recei ved a t l a bora tory
Case classification (number)
Reporti ng ra te of di s ca rded
non-mea s l es non-rubel l a ca s es a t the na ti ona l l evel per 100,000 popn
% di s tri cts reporti ng a t
l ea s t 2 di s ca rded
non-mea s l es non-rubel l a
ca s es per 100,000 popn
Mea s l es i nci dence1
per mi l l i on
popn % s erum
s peci mens recei ved a t l a bora tory w/i n 5 da ys of col l ecti on
Rubel l a i nci dence2
per mi l l i on
popn Mea s l es Rubel l a
D
is
ca
rd
e
d
n
o
n
-m
e
a
sl
e
s
n
o
n
-ru
b
e
ll
a
c
a
se
s
P
e
n
d
in
g
c
la
ss
if
ic
a
ti
o
n
Countries
Number of s us pected mea s l es
ca s es % s us pected ca s es wi th a dequa te i nves ti ga ti
on i ni ti a ted
w/i n 48 hours of noti fi ca ti on
% s us pected ca s es wi th s erum s peci mens
col l ected Number of
Vol. 22,
Week 16, 2018
Vaccine Preventable Disease Surveillance Bulletin
Page 2
Table 3: Classification of AFP Cases and Key Surveillance Indicators, 2017-2018 (data as of 23 April 2018)
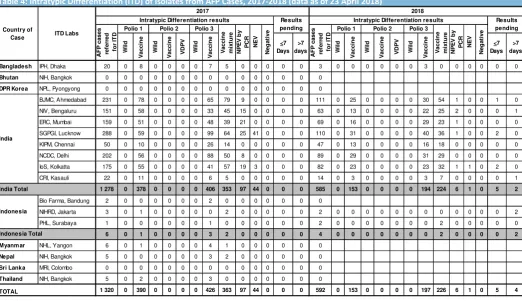
Table 4: Intratypic Differentiation (ITD) of Isolates from AFP Cases, 2017-2018 (data as of 23 April 2018)
T
o
ta
l
>
9
0
D
a
y
s
3
T
o
ta
l
>
9
0
D
a
y
s
3
Bangladesh
1 363
0
0
0
1 347
16
16
2.74
2.70
98
99
363
0
0
0
239
124
1
2.39
1.57
99
99
Bhutan
9
0
0
0
8
1
1
3.64
3.24
89
100
1
0
0
0
0
1
0
1.31
0.00
100
100
DPR Korea
104
0
0
0
91
13
11
1.82
1.59
97
100
0
0
0
0
0
0
0
0.00
0.00
0
0
India
39 339
0
0
23
38 535
781
781
8.97
8.79
86
98
8 512
0
0
0
6 713
1 799
194
6.31
4.98
87
98
Indonesia
1 689
0
0
2
1 557
130
130
2.40
2.21
82
97
292
0
0
0
204
88
12
1.35
0.94
82
97
Maldives
7
0
0
0
6
1
1
7.40
6.34
71
100
3
0
0
0
0
3
0
10.31
0.00
67
67
Myanm ar
396
0
0
0
391
5
5
2.94
2.90
95
100
45
0
0
0
39
6
1
1.08
0.94
96
100
Nepal
371
0
0
0
369
2
2
4.28
4.25
98
100
94
0
0
0
67
27
0
3.52
2.51
95
100
Sri Lanka
70
0
0
0
69
1
1
1.29
1.27
84
100
16
0
0
0
14
2
0
0.96
0.84
69
94
Thailand
198
0
0
0
179
19
19
1.71
1.55
68
95
15
0
0
0
0
15
4
0.42
0.00
87
100
Tim or-Leste
3
0
0
0
1
2
1
0.65
0.22
33
100
0
0
0
0
0
0
0
0.00
0.00
0
0
SEAR
43 549
0
0
25
42 553
971
968
7.21
7.04
86
98
9 341
0
0
0
7 276
2 065
212
5.03
3.92
87
98
3
90 days calculation based on date of paralysis onset subtracted from date of last report received from member countries by SEARO.
2017 (Onset)
2018 (Onset)
AFP
Surveillance Indicators
AFP
Surveillance Indicators
Case Classification
1Annualized
AFP Rates
2Specim en
A
F
P
C
a
s
e
s
W
il
d
P
o
li
o
v
ir
u
s
C
a
s
e
s
V
a
c
c
in
e
D
e
ri
v
e
d
P
o
li
o
v
ir
u
s
C
a
s
e
s
C
o
m
p
a
ti
b
le
D
is
c
a
rd
e
d
(
N
o
n
-p
o
li
o
A
F
P
)
Pending
A
F
P
R
a
te
Case Classification
1AFP Rates
2Specim en
1
All countries are using the virologic classification scheme.
C
o
m
p
a
ti
b
le
D
is
c
a
rd
e
d
(
N
o
n
-p
o
li
o
A
F
P
)
Pending
A
F
P
R
a
te
N
o
n
-P
o
li
o
A
F
P
R
a
te
%
w
it
h
2
s
p
e
c
.,
a
t
le
a
s
t
2
4
h
rs
a
p
a
rt
,
w
/i
n
1
4
d
a
y
s
N
o
n
-P
o
li
o
A
F
P
R
a
te
%
w
it
h
2
s
p
e
c
.,
a
t
le
a
s
t
2
4
h
rs
a
p
a
rt
,
w
/i
n
1
4
d
a
y
s
%
w
it
h
a
n
y
s
p
e
c
im
e
n
A
F
P
C
a
s
e
s
W
il
d
P
o
li
o
v
ir
u
s
C
a
s
e
s
V
a
c
c
in
e
D
e
ri
v
e
d
P
o
li
o
v
ir
u
s
C
a
s
e
s
Country
2
AFP rates per 100,000 children aged <15 years using population figures provided by member countries (AFP cases > 15 years of age or missing age information are excluded).
%
w
it
h
a
n
y
s
p
e
c
im
e
n
W
il
d
V
a
c
c
in
e
W
il
d
V
a
c
c
in
e
V
D
P
V
W
il
d
V
a
c
c
in
e
<7 Days
>7
days Wil
d
V
a
c
c
in
e
W
il
d
V
a
c
c
in
e
V
D
P
V
W
il
d
V
a
c
c
in
e
<7 Days
>7 days
Bangladesh IPH, Dhaka 20 0 8 0 0 0 0 7 5 0 0 0 0 0 3 0 0 0 0 0 0 3 0 0 0 0 0 0
Bhutan NIH, Bangkok 0 0 0 0 0 0 0 0 0 0 0 0 0 0 0
DPR Korea NPL, Pyongyong 0 0 0 0 0 0 0 0 0 0 0 0 0 0 0
BJMC, Ahmedabad 231 0 78 0 0 0 0 65 79 9 0 0 0 0 111 0 25 0 0 0 0 30 54 1 0 0 1 0
NIV, Bengaluru 151 0 58 0 0 0 0 33 45 15 0 0 0 0 63 0 13 0 0 0 0 22 25 2 0 0 0 1
ERC, Mumbai 159 0 51 0 0 0 0 48 39 21 0 0 0 0 69 0 16 0 0 0 0 29 23 1 0 0 0 0
SGPGI, Lucknow 288 0 59 0 0 0 0 99 64 25 41 0 0 0 110 0 31 0 0 0 0 40 36 1 0 0 2 0
KIPM, Chennai 50 0 10 0 0 0 0 26 14 0 0 0 0 0 47 0 13 0 0 0 0 16 18 0 0 0 0 0
NCDC, Delhi 202 0 56 0 0 0 0 88 50 8 0 0 0 0 89 0 29 0 0 0 0 31 29 0 0 0 0 0
IoS, Kolkatta 175 0 55 0 0 0 0 41 57 19 3 0 0 0 82 0 23 0 0 0 0 23 32 1 1 0 2 0
CRI, Kasauli 22 0 11 0 0 0 0 6 5 0 0 0 0 0 14 0 3 0 0 0 0 3 7 0 0 0 0 1
1 278 0 378 0 0 0 0 406 353 97 44 0 0 0 585 0 153 0 0 0 0 194 224 6 1 0 5 2
Bio Farma, Bandung 2 0 0 0 0 0 0 2 0 0 0 0 0 0 0
NIHRD, Jakarta 3 0 1 0 0 0 0 0 2 0 0 0 0 0 2 0 0 0 0 0 0 0 0 0 0 0 0 2
PHL, Surabaya 1 0 0 0 0 0 0 1 0 0 0 0 0 0 2 0 0 0 0 0 0 0 2 0 0 0 0 0
6 0 1 0 0 0 0 3 2 0 0 0 0 0 4 0 0 0 0 0 0 0 2 0 0 0 0 2
Myanm ar NHL, Yangon 6 0 1 0 0 0 0 4 1 0 0 0 0 0 0
Nepal NIH, Bangkok 5 0 0 0 0 0 0 3 2 0 0 0 0 0 0
Sri Lanka MRI, Colombo 0 0 0 0 0 0 0 0 0 0 0 0 0 0 0
Thailand NIH, Bangkok 5 0 2 0 0 0 0 3 0 0 0 0 0 0 0
1 320 0 390 0 0 0 0 426 363 97 44 0 0 0 592 0 153 0 0 0 0 197 226 6 1 0 5 4
Polio 3
V
a
c
c
in
e
m
ix
tu
re
N
P
E
V
b
y
P
C
R
N
E
V
Country of
Case ITD Labs
2017 2018
Intratypic Differentiation results Results
pending
Intratypic Differentiation results Results
pending
A
F
P
c
a
s
e
s
re
fe
rr
e
d
fo
r
IT
D
Indonesia Total
TOTAL
N
P
E
V
b
y
P
C
R
N
E
V
N
e
g
a
ti
v
e
India
India Total
Indonesia
N
e
g
a
ti
v
e
A
F
P
c
a
s
e
s
re
fe
rr
e
d
fo
r
IT
D
Polio 1 Polio 2 Polio 3
V
a
c
c
in
e
m
ix
tu
re