Indo. J. Chem., 2008, 8 (3), 459 - 462
S. M. Mizanur Rahmanet al.
459
* Corresponding author.
Email address : [email protected]
PHYTOCHEMICAL STUDY OF THE ARIAL PARTS OF
Cleome rutidosperma
DC PLANT
S. M. Mizanur Rahman
1*, Serajum Munira
1, and M. Amzad Hossain
2 1Department of Chemistry, University of Dhaka and Bangladesh, Dhaka-1000, Bangladesh 2
Chemistry Division, Atomic Energy Centre, Ramna, Dhaka-1000, Bangladesh
Received 20 July 2008; Accepted 13 October 2008
ABSTRACT
Two new compounds were identified as 2-ethyl-cyclohex-2-ene-6-hydroxy-methylene-1-carboxylic acid and 3 -hydroxy-lup-20(29)-en-28-oic acid, respectively, from the petroleum ether extracts of Cleome rutidosperma plant. These two constituents is the first time occurrence in this plant. The structures of the two different type of compounds are elucidated with the help of UV, IR, 1H-NMR, 13C-NMR, COSY, DEPT 90, DEPT 135 and mass spectral data.
Keywords:Cleome rutidosperm DC;isolation; spectral analysis
INTRODUCTION
Cleome rutidosperma, locally known as ‘Beguni hurhure’ is a low growing herb, up to 70 cm tall, found in waste grounds and grassy places with trifoliate leaves and small violet-blue flowers, which turn pink as they age. The elongated capsules display the asymmetrical, dull black seeds. The plant is native to West Africa, from Gulnea to Nigeria, Zaire and Angola.
It has become naturalized in various parts of tropical America as well as Southeast Asia including the ‘Indo-Bangla’ sub-continent [1-3]. Ayurvedi, Yunani doctors and Local Kabiraj used the different parts like leaves, roots and seeds as stimulant, antiscorbutic, anthelminthic, rubifacient, vesicant and carminative [4]. The antiplasmodial, analgesic, lacomotor, antimicrobial, diuretic, laxative and anthelmintic activity of the certain extracts of the plant has already been reported [5-9]. Presence of phytoconstituents like terpenoids, saponins, flavonoids have been found to be responsible for diuretic and laxative activities of the ethanolic extract and its fractions of the plant [8]. Extensive chemical examination of the plant was carried out and several groups of compounds isolated such as terpenoids, saponins, flavonoids, alkaloids etc. In this paper, we describe the isolation and structure elucidation of the substituted cyclohexene and terpenoid type of compounds from two different fractions of petroleum ether extracts. To the best of our knowledge these two compounds has not been previously isolated or reported from this plant.
EXPERIMENTAL
Plant Material
The plant materials (without root) of Cleome rutidosperma were collected from the Curzon Hall Campus of the University of Dhaka, Bangladesh. The
plant was identified and voucher specimen number was deposited at the Department of Botany, Dhaka University, Dhaka, Bangladesh with No. 041.
Spectroscopy
Melting point was determined on an electrochemical micro-melting point apparatus (Gallenkamp). The UV, IR (KBr) spectra were recorded on a Shimadzu UV-168A and Shimadzu IR-470A spectrophotometer, respectively. The1H-NMR and13 C-NMR spectra were recorded on a Bruker R-32 (400 MHz) in deuterated methanol (CD3OD) with TMS as an internal standard (chemical shifts in , ppm). TLC was performed with silica gel GF254. All solvents were analytical reagent grade. Mass spectra were recorded on a Varian Saturn 3800 GC-MS/MS spectrophotometer.
Extraction and Isolation
Indo. J. Chem., 2008, 8 (3), 459 - 462
S. M. Mizanur Rahmanet al.
460
silica gel (GF254). The column was initially eluted with petroleum ether (40-60 °C) followed by gradient elution with the mixture of petroleum ether with increasing amount of dichloromethane, 100% dichloromethane followed by the mixture of dichloromethane with increasing quantities of methanol and finally with methanol. These elutes were collected in a series of test tubes (more than 170 tubes) with 20 mL in each fraction. All these fractions were monitored by TLC (over silica gel GF254). The elutes of similar behaviour (similar Rf values) were combined together to afforded fourteen fractions F1 (3-7), F2 (8-11), F3 (12-15), F4 (16-20), F5 (21-32), F6 (33-50), F7 (51-59), F8 (60-84), F9 (85-112), F10 (113-125), F11 (130-142), F12 (143-155), F13 (156-169) and F14(rest of the tubes). All these fractions were concentrated separately and allowed to stand at room temperature for a couple of weeks. A yellowish semi solid amorphous substance (4.8 mg) settled out from fraction F4 and a white crystalline solid (5.3 mg) deposited from fraction F9 and these two fractions were marked as CR1and CR2, respectively.
Characterization of compounds CR1and CR2
Compound CR1: Yellowish semi solid amorphous (4.8
mg) was obtained from the fraction F4. It could not be crystallized from any solvent. It was only soluble in hexane and chloroform solvents. Rf0.60 (n-hexane-ethyl acetate; 9:2); (M+, 184); UV: 228 nm; IR: 3400, 2900, 2850, 1735, 1575, 1486, 1450, 1370, 1150, 720 cm-1; 1
H-NMR and13C-NMR . Table-1.
Compound CR2: Obtained from column was further
purified by preparative TLC over silica gel GF254using n-hexane-ethyl acetate (9:2) as a developing solvent. It was recrystallized from hexane to give a white crystalline solid (5.3 mg); m.p. 297°C; Rf 0.56 (n-hexane-ethyl acetate; 9:2); (M+, 458); UV: 276 nm; IR: 2900-2700, 1700, 1640-1600, 1475, 1365 cm-1; 1H-NMR and 13 C-NMR. Table-2 redundancy
RESULT AND DISCUSSION
The compounds, 2-Ethyl-cyclohex-2-ene-6-hydroxy-methylene-1-carboxylic acid (1) and 3 -hydroxy-lup-20 (29)-en-28-oic acid (2) were isolated from
this plant for the first time. Compound1was obtained as a yellowish amorphous solid. High-resolution mass of 1
indicated the molecular formula C10H16O3 (M+, 184). Its IR spectrum showed an absorption peak at 3400 cm-1 indicating the presence hydroxyl group (-OH) and the absorption bands at 2900-2850 cm-1 indicating the presence of –CH aliphatic asymmetric stretching. The absorption band at 1735 and 1575 cm-1indicating the presence of ester carbonyl group (>C=O) and conjugated double bond, respectively. Two sharp absorption bands at 1450 and 1370 cm-1indicating the presence of -CH2 and -CH3 groups, respectively. Two broad absorption peaks at 1140 and 720 cm-1 indicating the presence of -C-O stretching for secondary alcoholic group and -C-H stretching for >CH2groups present in the ring. The1H-NMR spectrum
showed the chemical shift at δ 5.3 indicating the
presence of one olefinic proton at position C-3 (Table 1). A pair of doublet of doublet at δ 4.1 and 4.2 with the
coupling constant J=6.12 indicating the presence of hydroxymethylene protons (HA, HB) at C-6 and the
other doublet at δ 8.7 indicating the presence of one
proton in –COOH group. Up field chemical shifts a
multiplet at δ 2.02-2.20 indicated the presence of 2H
protons (>CH2) at C-4 and C-1, respectively. The down
field chemical shift a broad singlet at δ 5.2 indicated the
presence of one proton (–OH) of hydroxymethylene
group. A broad singlet at δ 1.54-1.67 indicating the
presence of four protons at H-1, H-5 and H-6. A triplet
at δ 2.11 indicating of three methyl protons at C-1/ . In the 13C-NMR spectra of the compound CR1 revealed
the presence of 10 carbons.
1
Table 1.1H-NMR and 13C-NMR Spectral data for compound CR1 (2-ethyl-cyclohex-2-ene-6-hydroxymethylene-1-carboxylic acid (1)
Indo. J. Chem., 2008, 8 (3), 459 - 462
S. M. Mizanur Rahmanet al.
461
The chemical shift at δ 68.9 indicating the presence
of C-H carbon at position C-1 bearing the –COOH group.
Three different chemical shifts at δ 29.36, 29.54 and
29.72 indicated the presence of methylene carbon attached at position C-1/, C-5 and C-4, respectively. The
chemical shift at δ 34.2 indicated the presence of C-H
carbon at position C-6 bearing the -CH2OH group. Two
relatively down field chemical shifts at δ 129.7 and
130.25 inducting the presence of >C=C< between C-2
and C-3. The downfield chemical shift at δ 173.31
indicating the presence of carbonyl carbon of -COOH
group and the up field chemical shift at δ 12.11
indicating the presence of oxymethylene carbon at C-3/
linked through position C-6. The other up field signal at δ
14.12 indicating presence of methyl carbon at C-2/linked through C-1/.
On the basis UV, IR, 1H-NMR, 13C-NMR, Dept 90, Dept 135 and mass spectral data and the other physical properties the isolated pure compound CR1 was
identified and established as 2-ethyl-cyclohex-2-ene-6-hydroxymethylene-1-carboxylic acid(1).
2
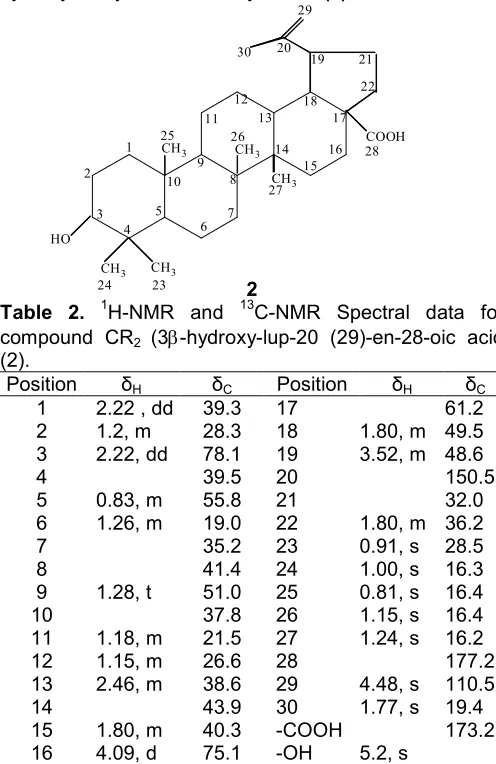
Table 2. 1H-NMR and 13C-NMR Spectral data for compound CR2 (3-hydroxy-lup-20 (29)-en-28-oic acid (2).
15 1.80, m 40.3 -COOH 173.21
16 4.09, d 75.1 -OH 5.2, s
* Assignments are based on DEPT 90 and DEPT 135,1H-NMR,13 C-NMR,1H-COSY
The compound 2 was obtained as white crystalline solid. It was highly soluble in hexane and chloroform successively. High-resolution mass spectra exhibited molecular ion at m/z 458, which is consistent with the molecular formula C30H48O3 and confirmed by 1
H-NMR,13C-NMR (Table 2) and DEPT analysis. The UV spectra displayed the characteristic absorption bands at 228 nm so there is no conjugated double bond in the structure. Its IR spectrum showed an absorption peak in the region 2900-2700 cm-1 indicating the presence of –CH aliphatic asymmetric stretching in conjugation and the absorption in peaks at 1700 and 1640 to 1600 cm-1indicating the presence of carboxyl carbonyl group and asymmetric ethylenic double bond, respectively. The absorption bands at 1475 and 1365 cm-1 indicating the presence of -CH3 and -CH3groups, respectively.
The 1H-NMR spectrum showed the up field
chemical shifts at δ 0.79, 0.81, 1.15 and 1.24 was due
to the tertiary methyl groups of the triterpenoidal nature
of the compounds. The chemical shift at δ 2.22 was
the doublet of doublet with H-1 and H-3 intensity having the coupling constant J=2.18 and 11.0 was assigned for the double bond proton along with the three other methyl groups at that show the up field chemical shift at
δ 0.83, 0.91 and 1.00 indicating the isopropenyl residue
of the skeleton. Other protons have their usual chemical shift values. The 13C-NMR spectra of the fraction revealed thirty carbon signals, which were assigned by Dept as seven methyl, ten methylene (including =CH2), six methine, seven quaternary, one alcoholic methine and one carboxylic acid. In comparison with the data of oleanolic acid, the carbon signals for C-14, C-15, C-16, C-17 and C-18 appeared slightly or largely shifted (41.0043.9, 35.20 40.3, 32.8 75.1, 56.6 61.2, 47.7 49.5). Therefore, on the basis of chemical shift the structure of the compoundCR2 was determined to be 3
-Hydroxy-lup-20 (29)-en-28-oic acid (2).
ACKNOWLEDGEMENT
The authors are grateful to Mr. Aminul Ahsan, Senior Scientific Officer, Analytical Chemistry Division, BCSIR Laboratories, Bangladesh for her help in connection with DEPT, 1H-NMR, 13C-NMR, 1H-COSY. They are also grateful to Dr. S. M. Salehuddin, Chemistry Division, Atomic Energy Centre, Ramna, Dhaka, Bangladesh for his help in connection with GC-MS/MS.
REFERENCES
Indo. J. Chem., 2008, 8 (3), 459 - 462
S. M. Mizanur Rahmanet al.
462
2. Singapore science centre recource page. 2006. Available at: http:// www.science.edu.sg/ssc/ wildflowers/catswhiskerfamily.jsp. Accessed-May 13. 3. Waterhouse, B., and Mitchell, A., 1998, Northern Australia Quarantine Strategy Weeds Target List, (AQIS Miscellaneous Publication), 29.
4. Kiritikar, K.R., and Basu, B.D., 1991, Indian Medicinal Plants, (Lalit Mohan Basu, Deharadun, India), 181-184.
5. Bidla, G., Titanji, V.P.K., Joko, B., El-Ghazali, G., Bolad, B., and Berzins, K., 2004. Indian J. Pharm., 36, 244.
6. Bose, A., Saravanan, V.N., Karunanidhi, and Gupta, G.K., 2004,Indian J.Pharm. Sci.66(6), 795-799. 7. Bose, A., Gupta, J.G., Ghosh, T., and Dash, G.K.,
2005, Indian J. Nat. Prod. 21 (3), 39-42.
8. Bose, A., Mondal, S., Gupta, J.K., Dash, G.K., Ghosh, T., and Si. S., 2006, Pharmacognosy Magazine, 2 (7), 178-186.
9. Bose, A., Mondal, S., Gupta, J.K., Dash, G.K., Ghosh, T., and Devbhuti, T., Recent progress in medicinal plants. (In press)
10. Pavia, D.L., Lampman, G.M., and Kriz, G.S., 1979,
Introduction to Spectroscopy, Saunder College Publishing, USA, , p 26.
11. Williams, D.H., and Fleming, I., 1990, Spectroscopic Methods in Organic Chemistry, Tata McGraw-Hill Publishing Company Limited, New Delhi, 4thedn., 29-40.