ANALYTICAL METHOD DEVELOPMENT FOR THE DETERMINATION
OF Α-ENDOSULFAN AND BIFENTHRIN PESTICIDE RESIDUES IN TEA
Dyah Styarini
1,*, Andreas
2, Y. Susanto Ridwan
2, and Retno Yusiasih
2 1Division of Analytical Chemistry and Standard, Research Center for Chemistry, Indonesian Institute of Sciences, Komplek Puspiptek, Serpong, Tangerang, Banten 15314, Indonesia
2
Division of Analytical Chemistry and Standard, Research Center for Chemistry, Indonesian Institute of Sciences, Jl. Cisitu-Sangkuriang, Bandung 40135, Indonesia
Received November 14, 2013; Accepted February 4, 2014
ABSTRACT
The development of analytical method for the determination of α-endosulfan and bifenthrin residues in tea has
been done. The complex matrices and also the pigment were the challenge in doing quantification of the pesticide residues in tea matrices. In order to get appropriate analysis method for the determination of pesticide residues in tea, the modification was done in the analytical method for the determination of organochlorine multiresidue in non fat matrices: seasoning and spicy that is published by Directorate General of Food Crops, Directorate of Food Plant Protection. The modification was done particularly in clean-up step to remove the interferences from the extract of tea matrices such as the pigment that usually interfere the measurement with Gas Chromatography (GC). The result showed that the MDL value for both analytes were 0.5 ng/g that were much lower than MRLs. The percent recovery
obtained from the method was 78.58 and 90.19% for α-endosulfan and bifenthrin, respectively. The precision of the
analysis method for both analytes were good since the % RSD values were below than the Horwitz’s value that was 19.18% at spiking level concentration of 300 ng/g.
Keywords:α-endosulfan; bifenthrin; GC-ECD; tea; pesticide
ABSTRAK
Pengembangan metode analisis untuk penentuan residu α-endosulfan dan bifenthrin dalam teh telah
dilakukan. Matriks yang kompleks dan juga pigmen menjadi tantangan dalam melakukan kuantifikasi residu pestisida dalam matriks teh. Untuk mendapatkan metode analisis yang tepat dalam penentuan residu pestisida dalam teh, modifikasi dilakukan pada Metode Analisis untuk Penentuan Multiresidu Organoklorin dalam Matriks Non Lemak: Bumbu dan Rempah-rempah yang diterbitkan oleh Direktorat Jenderal Tanaman Pangan, Direktorat Perlindungan Tanaman Pangan. Modifikasi ini dilakukan terutama pada bagian clean-up untuk menghilangkan pengganggu dari ekstrak matriks teh seperti pigmen yang biasanya mengganggu pengukuran dengan Gas Chromatography (GC). Hasil penelitian menunjukkan bahwa nilai MDL untuk kedua analit adalah 0,5 ng/g yang jauh
lebih rendah daripada MRLs. Nilai persen perolehan kembali untuk analit α-endosulfan dan Bifenthrin
masing-masing sebesar 78,58% dan 90,19%. Presisi dari metode analisis untuk kedua analit cukup baik dimana nilai % RSD yang diperoleh lebih kecil dari nilai Horwitz (19,18%) pada konsentrasi spiking level 300 ng/g.
Kata Kunci:α-endosulfan; bifentrin; GC-ECD; teh; pestisida
INTRODUCTION
Tea is one of most popular type of drink after mineral water. For some developing countries, tea is an important commodity when viewed from the export revenues. Sales competition of tea commodities at the world level is increasingly tight. For that reason, the improvement of the quality of the products traded is needed. The presence of pesticide residues in tea products is an issue that has long been a particular concern to international level.
Indo. J. Chem., 2014, 14 (1), 12 - 21
13
residues have caused China suffered losses of more than 125 million US Dollars in 2001, when the EU tightened the requirement of MRL, 100 times lower than the previous value. This refusal has been lowered 50% of China’s tea exports to Europe. European tea trade data recently showed that some tea producing countries such as Vietnam, Japan and India have difficulties to meet the MRL set by EU [1].
Several kinds of pesticides that widely used in the tea plantation are organochlorine, phyrethroid, organophosphate and carbamate. Endosulfan is one of organochlorine pesticide that used in the tea industry because of its low cost and high effectiveness. The MRL for endosulfan in several country are 30 mg/Kg (Indonesia, EU, UK, Codex, Netherlands, Germany) while USEPA set to 24 mg/Kg. Bifenthrin is one of pyrethroid pesticide that legally used in Indonesia. The MRL for bifenthrin are 5 µg/g (in UE, Germany); 0.1 mg/Kg (Netherlands) and 25 mg/Kg (Japan) [1-2].
The ability of analysis of pesticide residues are important to ensure the presence and the level concentration of pesticide residues in the export commodities. The accurate result of analysis will prevent rejection of export commodities. The analysis of pesticide residues often gives results with a relatively high variability due to low concentrations of the target compounds. Some components such as polyfenols and the pigment in tea will become the interference in the analysis. So, it is important to have an accurate analytical method for the determination of pesticide residues in tea so that the accurate measurement result obtained can be accepted internationally and no doubt on it. The purpose of this research is to develop and to validate the analytical method for determining
-endosulfan and bifenthrin pesticide residues in tea. The development of analytical method for the determination of pesticide residue in herbal matrices is going on in the world. In general, pesticide residue analysis consist of several steps such as extraction by using organic solvent, clean-up by using various technique and sorbent and the last step is analysis by using analytical instruments such as Gas Chromatograph (GC) or High Performance Liquid Chromatography (HPLC). For the extraction of pesticide residue from the matrices, there are several organic solvent that usually used both individual or mix of them depend on the analytes target and the matrices. For the sample pretreatment, Gel permeation Chromatography (GPC) and Solid Phase Extraction (SPE) as efficient methods have been widely applied to pesticide residue analysis. Gas Chromatography (GC) equipped with spesific detector such as Electron Capture Detector (ECD) or Mass Spectrometry (MS) are widely used in this kind of analysis [3-6]. GCMS is the most popular one especially for the multi residue analysis. Several modern
analytical techniques for determining pesticide in tea have been developed. Yang X. et al. (2009) informed a method that has developed by Cai et al. that applied polyphenylmethylsiloxane (PPMS) as a coating for solid phase micro extraction (SPME) combined with microwave-assisted extraction (MAE) to determine the concentration of organochlorine in Chinese teas and the analysis was done by using GC-ECD. Huang et al. (2007) used acetone-ethyl acetate-hexane for the extraction of pesticide, gel permeation chromatography (GPC) and SPE for clean-up, and GC-MS under retention time locked (RTL) conditions for the determination of 102 pesticide residues in teas [5-6].
It is necessary to validate the developed method and to participate in the proficiency testing to see the performance of the method that has been developed. Method validation is the process of defining an analytical requirement, and confirming that the method under consideration has performance capabilities consistent with what the application requires. Validation of an analytical method will ensure that the results of an analysis are reliable, consistent, and perhaps more importantly that there is a degree of confidence in the results. Method validation provides the necessary proof that a method is “fit for purpose” [7-8]. For evaluating the accuracy and comparability of the result obtained from this developed method, the analysis of Proficiency Test tea sample provided by Asia Pacific Metrology Program (APMP) has been done.
EXPERIMENTAL SECTION
Materials
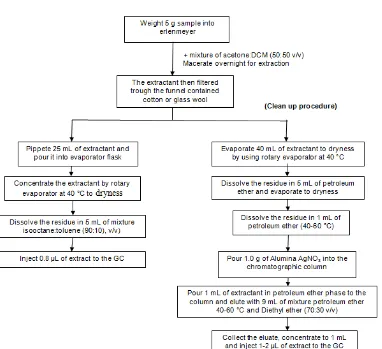
Fig 1.Recommended Analytical Method for the Determination of Organochlorine Pesticide Residues in Spices and Seasoning
Instrumentation
Gas chromatography equipped with Electron Capture Detector (Hewlett Packard 6890) was used in this study. A DB-5 capillary column (30 m x 0.25 mm I.D. x 0.25 µm) was used for separation. The helium gas was used as carrier gas with flow rate of 1 mL/min. The injector port and detector temperature were kept at 250 and 300 °C, respectively. The oven temperature was programmed from 120 °C for 1 min and was then followed by 25 °C/min ramping to 250 °C and held for 5 min before being ramping up to 300 °C (5 °C/min) and held at this level for 2 min. Splitless injection mode with splitless time 0.75 min was used. Nitrogen gas (high purity) was used as make up gas at 60 mL/min of flow rate.
Procedure
Preparing of pesticide standard solution
Stock Standard solutions of α-endosulfan and bifenthrin which have concentration of 1000 ppm were
prepared by weighing 1 mg of both target analytes into different vials and then dissolved with 1 mL of isooctane. More dilute standard solutions were prepared by diluting the stock standard solutions with n-hexane. The calibration standard solutions (1, 10, 20, and 40 ppb) were prepared from the standard solution of 100 ppb.
Sample extraction and clean-up procedure
Indo. J. Chem., 2014, 14 (1), 12 - 21
15
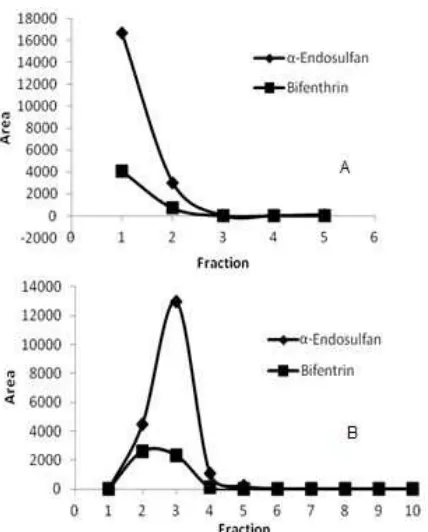
Fig 2.Fractionation graph of standard mixture solution in silica column (A) and in florisil column (B)
A homemade glass column containing a piece of cotton on a glass frit was filled with slurry of 10 g of activated florisil in n-hexane and about 1 g of sodium sulfate anhydrous on the top of florisil. The florisil column was previously wetted with 20 mL of n-hexane prior to use and this solvent was discarded. An aliquot from sample solution approximately 3 mL was weighed and recorded as W2 was transferred into the glass column containing florisil for clean up. The conical evaporating flask containing the residue was rinsed with 3 mL of n-hexane and then passed through the glass column. The pesticide residues were eluted with 100 mL of mixture of n-hexane/diethyl ether, 85/15 (v/v) and the eluate was collected to the conical evaporating flask. The eluate was then concentrated at 40 °C in a vacuum rotary evaporator to near dryness. The residue was then dissolved in approximately 1 mL of n-hexane and the mass of the final solution was recorded as W3. Quantitative analysis of the α-endosulfan and bifenthrin residues was done by injecting 2 µL of the final solution to the GC-ECD.
RESULT AND DISCUSSION
Modification and Optimization
Directorate General of Food Crops, Directorate of Food Plant Protection (Department of Agriculture) published the recommended analytical method for the
determination of pesticide residues in some agricultural matrices. Unfortunately, there is no analytical method for the determination of pesticide residues specifically in tea matrices. There is an analytical method for the determination of organochlorine pesticide residues in spices and seasoning as shown in Fig. 1 [9]. That is well known, that tea samples containing pigments such as chlorophyll and carotenoids besides mixture of aroma components, polyphenols and caffein that can be interfering in analysis of pesticide residues especially in the separation of compounds in the GC. Those co-extractives can cause problems in both qualitative and quantitative analysis. The clean up procedure in the recommended analytical method that is employing alumina AgNO3 as an absorbent was unsuccessfull in removing the pigments from the extractant, so that modification was needed to remove the pigments.
To minimize the co-extractives in the extractant, some modifications were done such as reducing the mass of the test portion become 2 g only and replacing the alumina with florisil and silica gel to be compared as absorbents in clean up procedure. The clean up procedure employing 10 g of activated florisil column combined with 100 ml mixture of n-hexane:diethyl ether (85:15) as eluent was compared to clean up procedure employing 10 g of silica column combined with 50 mL mixture of n-hexane:ethyl acetate (90:10) as an eluent. A mixture standard solution of those analyte targets which have concentration of 20 ng/g was poured into those columns and eluted with the chosen eluent. Every 10 mL of eluent was collected in one conical evaporating flask so there were 5 fractions of eluent derived from silica column and 10 fractions of eluent derived from florisil column. Each fraction was injected to the GC-ECD to be analyzed. The result of each fractions for both clean up procedure can be seen in Fig. 2. There were some aspects to be considered to decide which method will be choosed such as the ability of the stationary phase (silica and florisil) retain the pigments from tea and also the ability of the eluent to elute all of pesticide residue targets out from the column. From Fig. 2, it can be seen that bifenthrin and
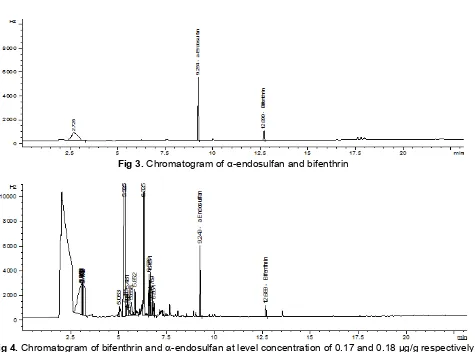
Fig 3. Chromatogram of α-endosulfan and bifenthrin
Fig 4.Chromatogram of bifenthrin and-endosulfan at level concentration of 0.17 and 0.18 µg/g respectively
recovery for bifenthrin and -endosufan in clean up using silica were 69.58% and 38.67% respectively while in florisil column were 97.65 and 82.81% respectively. Since the recovery of the target analytes and the clarity of the eluent from florisil column better than in silica column, then the florisil column was choosed for clean up procedure. The modified method was then validated to know its performance. The result of the method validation is as follow:
Analytical method validation
All validation procedures were performed using tea samples derived from the market. The sample was sieved by using 70 mesh siever.
Analysis of standard solution in GC-ECD. By using the condition of GC-ECD described above, α-endosulfan and bifenthrin have retention times of 9.31 and 12.79 min, respectively. The separations of those standards were good which has resolution greater than 1.5. The chromatogram can be seen in Fig. 3.
Selectivity [10-12]. According to the NATA Technical Note 17(2), selectivity of the method is the accuracy of its measurement in the presence of interference. The selectivity factor (α) can be measured by the equation:
( ) 0
( ) 0 '
' r a a
b r b
t t
k
k t t
(1)
Given that tra > trb. k’ is the capacity factor that describe the migration rate of an analyte on a column. The capacity factor of an analyte was defined as:
0 0
' tr t
k t
(2)
where tris the retention time of an analyte and t0is the dead time. Both tr and t0 were obtained from the chromatogram. Then the selectivity factor of those two analytes is 1.37.
In the chromatogram obtained from analysis of sample containing bifenthrin and -endosulfan, it can be seen that peaks of those target analytes have retention time different with the retention time of other compounds derived from the matrice that still present in the extract of the sample. The absence of peaks at the retention time of those two target analytes in the control blank sample indicated that no interference compounds occur in the extract. The chromatogram of sample containing those two analytes can be seen in Fig. 4.
Indo. J. Chem., 2014, 14 (1), 12 - 21
17
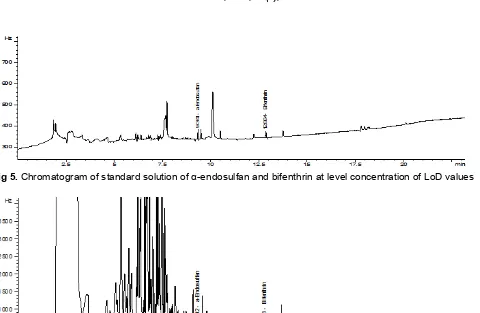
Fig 5. Chromatogram of standard solution of α-endosulfan and bifenthrin at level concentration of LoD values
Fig 6. Chromatogram of tea sample containing α-endosulfan and bifenthrin at level concentration of MDL (0.5 ng/g)
be detected, but does not need to quantize. In chromatography, limit of detection is a low amount of a compound that produce a peak with a height at least 3 times of the baseline noise level. To determine instrument detection limit for both target analytes, some low concentration of standard mixtures have been tried to be injected to the GC-ECD. Instrument detection limit of each compound was determined by observing each peaks that having height of peak at least three times higher than the noise. Instrument Detection Limit (IDL) of bifenthrin and-endosulfan were 0.335 and 0.034 ng/g respectively. The chromatogram of bifenthrin and
-endosulfan at limit of detection concentration can be seen in Fig. 5.
According to Corley (2003), the method detection limit is defined as the smallest amount of an analyte that can be reliably detected or differentiated from the background for a particular matrix (by a specific method). MDL was estimated by analyzing blank samples fortified with standards at low level concentration which still producing signals at signal to noise ratio of 3 [15]. The MDL value for -endosulfan and bifenthrin were 0.5 ng/g. The chromatogram of bifenthrin and -endosulfan at MDL level of concentration can been in Fig. 6.
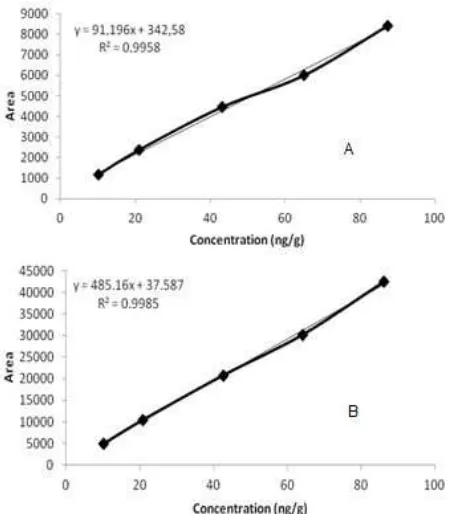
Linearity [16]. There were 6 level of concentration of target analytes standard solution injected to the GC-ECD to evaluate the linearity response of the detector. The 6 levels of concentration were 1, 10, 20, 40, 60 and 80 ng/g. The linearity of those target analytes were good since the r2 values obtained for both α-endosulfan and bifenthrin were 0.9985 and 0.9958, respectively. The linearity of the detector response to the variation of level concentration of each target analytes can be seen in Fig. 7.
A traditional method for testing the linearity of calibration functions after linear regression is to compute the correlation coefficient, r (or the similar coefficient of determination, r2). But further comments have been made on the miss-use of r for testing the linearity. The value ofrcorrectly describes a correlation between two files; it describes the quality of the fit only poorly and its linearity not at all. Since equal results can have different meanings, depending on the number of the degrees of freedom, the use of ris not reliable measureof linearity.
Fig 7.A. calibration curve for bifenthrin; B. linearity curve
for α-endosulfan Fig 8.Linearity curve of the developed method
Yi=yi /yˆ), which is calculated with n-2 degrees of freedom by applying following Eq. (3).
2ˆ
/ 2
i y y
Y Y S
n
(3)
where,
yi is the response obtained from spotting/injecting analytical standard.
ŷi is the point corresponding with analytical standard on the regression line.
n is the total number of standard spots/injections e.g. when the calibration is made at three level with duplicate injections, thennis equal to 6.
The standard deviation of relative residuals obtained from the calibration curve of -endosulfan is 0.023 and 0.058 for bifenthrin. A good calibration curve has a standard deviation of relative residuals less than 0.1. Since the standard deviation of the relative residuals is not constant but generally proportional to the injected analyte, standard deviation of the relative residuals reflect the average variability of the calibration points even if unweighted regression equation is used for the estimation of the calibration relationship.
The linearity of the method was evaluated by doing analysis of 5 samples that contains target analytes at different level of concentrations (35.7 to 399.02 ng/g) for α-endosulfan and (107.71 to 856 ng/g) for bifenthrin. The r2value for-endosulfan and bifenthrin are 0.98969 and
0.99884 respectively, and the curves can be seen in Fig. 8.
Recovery and repeatability.Accuracy of the modified method was determined by recovery test and precision of the method. It was determined by analyzing 6 replicates of the samples. Tests for the recovery and repeatability were carried out for knowing the performance of the analytical method. Recovery is the fraction of analyte added to a test sample (fortified or spiked sample) prior to analysis that is recovered after analysis.
A mixture of standards which has concentration of 15 µg/g was added to 2 g of tea sample, so that the sample containing 270 ng/g of bifenthrin and -endosulfan. Seven tea samples containing mixture of standard was then analyzed using the modified method. The mean value of % recovery for
-endosulfan and bifenthrin are 78.58% and 90.19% respectively as shown in Table 1. The analysis of 6 replication was carried out in the same day and by 1 analyst. Based on the ‘Horwitz Trumpet’, the relative standard deviation of reproducibility (RSDR) for analyte at level concentration of 100 ppb, the RSDR was about 22%. From the calculation using Horwitz formula, the RSDR for analyte at spiking level concentration was about 19.5%. The repeatability of the method is good where the value of % RSD for both two analytes were less than the value of CV Horwitz. [8,17-18]
Indo. J. Chem., 2014, 14 (1), 12 - 21
19
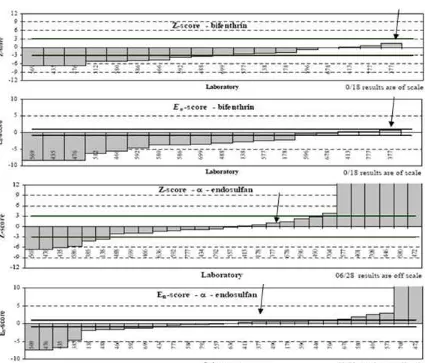
Fig 9.Z-score and En-score graphs for -endosulfane and bifenthrin for laboratories participated in APMP/TCQM DEC Proficiency Testing scheme pesticide in tea
Table 1. Recovery test result of the modified analytical method for the analysis of-endosulfan and bifenthrin in tea sample
% Recovery Replication
Bifenthrin -Endosulfan
1 82.8 78.66
2 103.12 81.96
3 108.02 98.88
4 84.83 63.34
5 100.27 88.94
6 62.12 59.70
Mean 90.19 78.58
sd 17.08 14.96
% RSD 18.93 19.04
CV Horwitz 19.97 20.11
Proficiency test result [21]. Asia Pacific Metrology Programme organized the proficiency testing (PT) programme on pesticide residues in tea as a joint initiative of the Technical Committee for Amount of Substance (TCQM) and the Developing Economies
Committee. PT is defined as one of powerful tool to help laboratory to demonstrate such competence to an accreditation body or other third party and also enables laboratory to monitor their test over time [22].
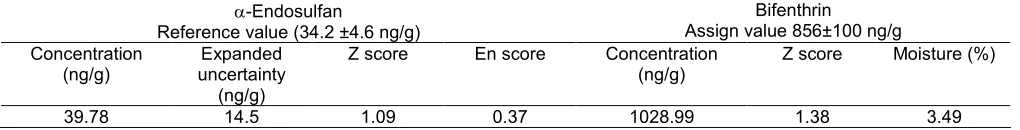
Table 2. Result of -endosulfan and bifenthrin value obtained by using modified method in the APMP Proficiency Testing
-Endosulfan
Reference value (34.2 ±4.6 ng/g)
Bifenthrin
Assign value 856±100 ng/g Concentration
(ng/g)
Expanded uncertainty
(ng/g)
Z score En score Concentration
(ng/g)
Z score Moisture (%)
39.78 14.5 1.09 0.37 1028.99 1.38 3.49
of the result [25]. x X
x = result reported by participant X = assigned value
= standard deviation for Proficiency Assessment
2 2
x = result reported by participant X = assigned value
Ux= expanded uncertainty of the participant’s result x Uref = expanded uncertainty of the assigned value’s X determined in a reference laboratory
The Z-scores are commonly interpreted as follow:
2
Z satisfactory
2 Z 3 questionable
Z > 3unsatisfactory
While the En scores are interpreted in the following manner:
1
En satisfactory
1
En unsatisfactory
The reference value of -endosulfan and assign value of bifenthrin in the oolong tea sample are 34.2 ± 4.6 ng/g and 856 ± 100 ng/g respectively. The result obtained for the value of -endosulfan and bifenthrin by using the modified method was shown in Table 2. The result obtained for those two target analytes were inlier because both of them had the z scores 2 and En score 1. Based on the PT result then can be said that the modified method has a good performance to be used for the analysis of-endosulfan and bifenthrin in tea sample.
CONCLUSION
The result of method validation showed that the modified method has good % recovery for both α-endosulfan and bifenthrin that were 78.58% and 90.19% respectively. The precision of the method for both analytes was also good since the % RSD value was under the Horwitz’s value that is 19.18% at level
concentration of 300 ng/g. The result obtained from the proficiency testing showed the satisfactory result since the Z scores were below 2 and the En score were below 1 for both α-endosulfan and bifenthrin. Based on the result evaluation of analytical method validation and Proficiency Testing, the modified method for analysis of
-endosulfan and bifenthrin in tea sample has a good performance, simple, reliable and also comparable.
ACKNOWLEDGEMENT
The authors would like to extend their thanks to the Indonesian Government for funding support of this project and Ms. Sajekti Eka for her generous assistance during the laboratory experiment is highly appreciated.
REFERENCES
1. Dini Jamia Rayati, 2008, Warta Pusat Penelitian Teh dan Kina, 19 (1-3), 27–56.
2. Peraturan Pemerintah RI No. 6 Tahun 1995 tentang Perlindungan tanaman dan keputusan bersama menteri kesehatan dan menteri pertanian tentang Batas maksimum Residu Pestisida pada hasil Pertanian.
3. Aybar-Muñoz, J., Fernández-González, E., García-Ayuso, L.E., González-Casado, A., and Cuadros-Rodríguez, L., 2005, Chromatographia, 61 (9-10), 505–513.
4. Li, H-P., Li, G-C., and Jen, J-F., 2004, J. Chin. Chem. Soc., 51 (3), 531–542.
5. Huang, Z., Li, Y., Chen, B., and Yao, S., 2007,J. Chromatogr. B, 853 (1-2), 154–162.
6. Yang, X., Xu, D.C., Qiu, J.W., Zhang, H., Zhang, Y.C., Dong, A.J., Ma, Y., and Wang, J., 2009, Chem. Pap., 63 (1), 39–46.
7. Eurachem Guide, 1998,The Fitness for Purpose of Analytical Methods: A laboratory guide to Method Validation and Related Topics.
8. Guidelines for validation of analytical methods for non-agricultural pesticide active ingredients and products,
Indo. J. Chem., 2014, 14 (1), 12 - 21
21
9. Metoda Pengujian Residu Pestisida Dalam Hasil Pertanian, Direktorat Jenderal Tanaman Pangan Direktorat Perlindungan Tanaman, 2006.
10. López-Mesas, M., Crespi, M., Brach, J., and Mullender, J.P., 2000, J. Chromatogr. Sci., 38 (12), 551–555.
11. Frenich, A.G., J.L. Vidal, J.L., M. Frias, M.M., Ollea-Serrano F., and Olea, N., 2000,J. Mass Spectrom., 35 (8), 967–975.
12. Szepesy, L., 2000,Chromatographia Suppl., 51 (1), S-98–S-99.
13. Chang, K.H., 2011,Health Environ. J., 2 (1), 38–43. 14. Fenoll, J., Helin, P., Lopez, J., Gonzalez, A., and
Flores, P., 2007,J. AOAC Int., 90 (6), 1670–1676. 15. Kujawski, M.W., and Namieśnik, J., 2011, Food
Control, 22 (6), 914–919.
16. Tiryaki, O., 2006, Accredit. Qual. Assur., 11 (10), 506–513.
17. Horwitz, W., Kamps, L.R., and Boyer, K.W., 1980,J. Assoc. Off. Anal. Chem., 63 (6), 1344–1354.
18. Thompson, M., 2004,The amazing Horwitz function, amc Technical Brief No.17, Royal Society of Chemistry.
19. Thompson, M., 2005, What is Proficiency testing? Guide for end-users of chemical data, amc background paper No. 2, The Royal Society of Chemistry.
20. Gilbert J., and Patey, A.L., 1998, Pure Appl. Chem., 70 (12), 2309–2312.
21. Dayarathna, D., Thirimanna, C., Mubarak, A., Mackay, L., Rogerson, J., Tang, H., Feng, J., Sin, D.W.M., and Wong, Y-C., 2013,Food Res. Int., 53 (2), 931–937.
22. Hegazy, R., Mohamed, M.I., and Abu-Sinna, A., 2010, MĀPAN-J. Metrol. Soc. India, 25 (2), 107– 113.
23. Mann I., and Brookman, B., 2011, Selection, Use and Interpretation of Proficiency Testing (PT) Schemes, 2nded., Eurachem.
24. Thompson, M., Ellison, S.L.R., and Wood, R., 2006,Pure Appl. Chem., 78 (1), 145–196.