Haruni Krisnawati1,2, Yue Wang3 and Peter K. Ades4
ABSTRACT
he aim of this study was to develop a generalized height-diameter model for predicting tree height of Acacia mangium plantations in South Sumatra that could account for the variability of site and stand conditions. Six commonly used non-linear growth functions (i.e. Gompertz, Chapman-Richards, Lundqvist-Korf, Weibull, modiied logistic, and exponential) were selected as candidate base models and were itted to individual tree’s height-diameter data of A. mangium
plantations. A total of 13,302 trees collected from permanent sample plots with various spacing, stand age, and site quality were available for this study. he data were split into two sets: one set being the majority (75%) was used to estimate model parameters and the remaining data set (25%) was used to validate the models. he results showed that the six base models produced almost identical its with a relatively high root mean squared error (± 3.4 m) and a relatively low proportion of the total variation in observed tree height (52.5 - 53.4%). he Lundqvist-Korf (LK) model performed slightly better than the other models based on the goodness of it as well as bias and standard errors of the predictions. his LK model can be itted easily and provided more satisfactory it when additional variables were included into the model, hence was selected as the base model. Introducing stand variables into the selected base model resulted in a signiicant improvement of the accuracy for predicting heights. he root mean squared error decreased by the value between 0.5564 and 1.4252 m and the proportion of variation explained by the model increased by the value between 13.88 and 33.21%. he best improvement based on it and model validation was achieved by the generalized height-diameter model with inclusion of stand age and site index.
Keywords: Acacia mangium, generalized model, height-diameter relationship, non-linear growth function
I. INTRODUCTION
Individual tree’s height and diameter at breast height (dbh) are essential inventory measures for estimating tree volume, site index and other important variables in forest growth and yield models. Tree diameter can be measured easily and at little cost. Total
1 Forest and Nature Conservation Research and Development Centre, Forestry Research and Development Agency, Jl. Gunung Batu No. 5, Bogor 16610, West Java, Indonesia. 2 Corresponding Author. E-mail: [email protected]
3 Department of Forest and Ecosystem Science, the University of Melbourne, 500 Yarra Boulevard, Richmond, Victoria 3121, Australia.
tree height, however, is more diicult and costly to measure due to several reasons: (1) time required to complete measurements, (2) chance of observer error, and (3) visual obstruction (Colbert et al., 2002). Oten, only a subset of tress in the sample plots with measured dbh is also measured for height. For this reason, quantifying the relationship between total tree height and dbh is required for predicting heights of the remaining trees.
Numerous model forms have been used for predicting height-diameter relationships for diferent species and in diferent forest regions. he approaches used for developing height-diameter models have varied from being simple to complex, including linear and nonlinear models. Most of these models (e.g. Arabatzis and Burkhart, 1992; Huang et al., 1992; Moore et al., 1996; Zhang, 1997; Huang, 1999) use only dbh as predictor variable for estimating total tree height and this may restrict their use to the stands where the data gathered. he height-diameter relationship, however, may vary from stand to stand, and even within the same stand, as the height-diameter relationship within the same stand does not remain constant over time (Flawelling and de Jong, 1994; Lappi, 1997; Eerikäinen, 2003); the development of tree height may take longer on poor quality sites than that on good quality sites (Mehtätalo, 2004; 2005); and for a particular diameter, trees that grow in very high density stands may be taller than those growing in less dense stands due to the greater competition among trees (Zhang et al., 1997; Zeide and VanderSchaaf, 2002).
Due to the variability of site and stand conditions, a single height-diameter relationship may not be useful in all the possible situations that can be found in diferent stands. One alternative is to develop a height-diameter model separately for each stand. Although this approach may provide accurate estimates of individual stands, it is time consuming (ineicient) and expensive. A practical alternative is to develop more generalized height-diameter models, which account for the variability of site and stand conditions, by including additional stand variables as well as tree diameter (e.g. Bi et al., 2000; Staudhammer and LeMay, 2000; Sánchez et al., 2003; Sharma and Zhang, 2004).
II. MATERIALS AND METHODS
A. Data Description
Data used in this study were obtained from the permanent plots established in unthinned A. mangium plantations located in South Sumatra, Indonesia. he plots were subjectively selected to represent the range of stand age, density (spacing), and site quality of A. mangium plantations in the region. All plots were established with the same size (0.1 ha), but the stands as sampled varied in planting spacing (i.e. 3x2, 3x3, 3x4 and 2x4 m). hey were established between 1993 and 1996, and the irst measurements were taken at 2-4 years ater planting. Most plots were measured at a 1-year time interval until 8-11 years ater planting.
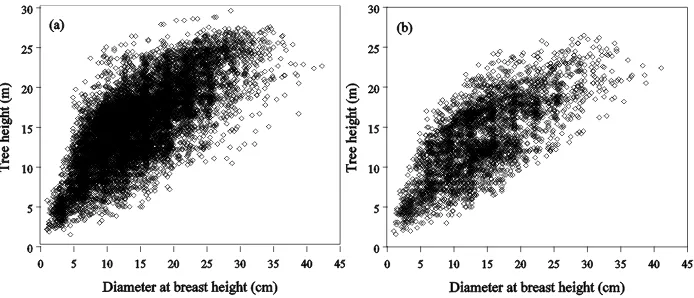
From each plot, all sample trees that had both dbh and height measurement data were extracted (removed) and the combined data were used for developing and evaluating the height-diameter models. A total of 13,302 pairs of individual tree’s height-diameter measurements were available for this study. hese data were split by trees into two sets. he majority of the data (75%) were used for model itting, while twenty-ive percent of the data selected randomly across the range of the diameter classes was used for model validation (cross-validation procedure). Summary statistics of the tree diameter and height as well as characteristics of the plots from which the sample trees used for model itting and validation are presented in Table 1. Scatter plots of the tree diameter and height data for both data sets are also illustrated (Figure 1).
Figure 1. Scatter plots of tree height against diameter at breast height (dbh) of A. mangium
Table 1. Summary of statistic descriptions of the sample trees and characteristics of the plots from which the trees used for model itting and validation
Variable (characteristics)
Descriptions
Mean Min Max DeviationStandard
Fitting data (No. of trees = 9977):
Tree height (m) 15.2 1.5 29.5 5.0
Diameter at breast height (cm) 14.8 1.0 42.3 6.5
Stand age (years) 5.8 2.0 11.0 2.0
Quadratic mean diameter (cm) 14.7 3.2 28.3 4.4
Dominant height (m) 16.9 3.6 28.6 5.0
Site index (m) 18.1 8.7 25.9 2.7
Stand density (stems ha-1) 971 290 2020 287
Basal area (m2 ha-1) 16.5 0.7 34.8 7.4
Validation data (No. of trees = 3325):
Tree height (m) 13.6 1.6 26.5 4.8
Diameter at breast height (cm) 14.4 1.0 41.1 6.6
Stand age (years) 5.5 2.0 10.0 2.0
Quadratic mean diameter (cm) 15.1 3.3 26.8 4.8
Dominant height (m) 16.0 5.0 25.6 4.6
Site index (m) 17.7 11.1 23.6 2.4
Stand density (stems ha-1) 855 350 1920 289
Basal area (m2 ha-1) 16.1 1.8 32.4 7.6
B. Base Height-Diameter Model Selection
To develop a generalized height-diameter relationship of trees for A. mangium
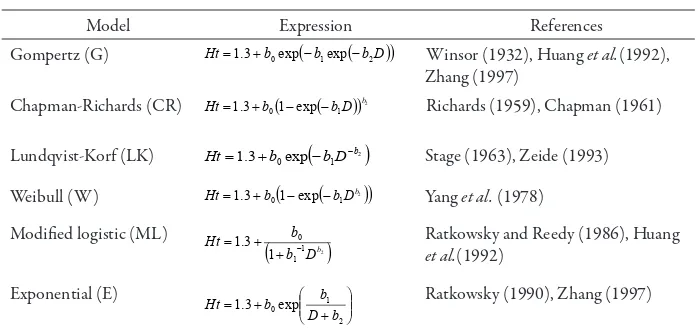
Ater evaluating a large number of model forms presented in the literature, six nonlinear models (Table 2) were selected as the candidate base height-diameter models. All these models used three parameters that described various biological interpretations, i.e. an upper asymptote, a rate parameter, and a shape parameter. Four parameters were not included in this study since they were more likely to be over-parameterized thereby resulting in instability of the estimates (Fang and Bailey, 1998). According to the previous studies (Huang et al., 1992; Moore et al., 1996; Zhang, 1997; Huang, 1999; Peng et al., 2001), these six models have been shown to provide more satisfactory its to tree height-diameter relationships for particular species and stand conditions than many alternative model forms.
All models listed in Table 2 can be written in a more general form:
(
i)
ii f X
Y = ,β +ε
... (1)
where Yi is a vector of observations of the dependent variable (i.e. Ht), Xiis a vector of observations of the independent variable (i.e. D (dbh)), b is the vector of parameters to be estimated (i.e. b0, b1 and b2), and εiis a vector of random errors. A constant value (1.3) was added to the right hand side of all height-diameter models in order to meet the condition that tree height should be 1.3 m when tree dbh is zero. his assumption may not afect the height-diameter relationship very much because the data corresponding to heights lower than 1.3 m were not present in the itting data (Table 1). However, it was used to avoid negative height estimates for small trees (e.g. Parresol, 1992; Hökkä, 1997).
Table 2. Nonlinear models selected as the base model for estimating tree height-diameter relationship of A. mangium plantations
Model Expression References
Lundqvist-Korf (LK)
(
2)
1
Ht Ratkowsky (1990), Zhang (1997)
C. Parameter Estimation and Model Comparison of the Base Models
he six candidate base height-diameter models (Table 2) were itted to the model itting data set using ordinary nonlinear least squares regression (NLIN procedure) in the SAS/STAT system (SAS Institute Inc, 2005). Because sample plots were measured several times, it may be expected that the observations of diameter and height of the same tree are temporally correlated, which violates the assumption of independent error terms. However, initial analysis in this study revealed that the serial correlation was weak for all candidate height-diameter models tested. his is possible because tree heights were measured on the sample trees based on the range of diameter classes so the sample trees were not necessarily the same in sequential measurements. herefore, the weak autocorrelation was ignored in the model itting as the impact of variance underestimation is likely to be masked by itting each individual tree as an independent observation (Temesgen and Gadow, 2004; Dorado et al., 2006).
he validity using the assumptions of ordinary nonlinear least squares regression was also investigated by examining the regression residuals. he studentised residual plots for all the candidate base models showed approximately homogenous variances over the full range of the predicted values and no systematic patterns in the variation of the residuals, as also shown in the other height-diameter modelling studies (e.g. Parresol, 1992; Zhang, 1997; Staudhammer and LeMay, 2000; Peng et al., 2001).
Results of the itting six candidate base height-diameter models were compared according to the criteria: (1) the asymptotic t-statistics of the parameters, (2) the root mean squared error, and (3) the adjusted coeicient of determination. In addition, the six candidate base models were employed to predict tree height using the validation data set. he average bias (i.e. observed - predicted) and standard errors of the height predictions were then calculated. To further evaluate the predictive ability of the models over the entire diameter classes, the bias and standard errors of the predicted heights were computed for each dbh class by dividing the observed data into 1-cm dbh class. he performance of the six itted models was also examined by simulating tree heights for a range of tree diameters.
D. Inclusion of Stand Variables
To account for the variation between diferent stand conditions, the selected base model using only dbh as a predictor variable can be modiied by including stand variables that introduce the dynamics and state of each stand into the model. he developed model was called a generalized height-diameter model. According to Staudhammer and LeMay (2000), there are two methods that could be used for incorporating stand variables into base height-diameter models. he irst method is the “parameter prediction” (Clutter
variables in the second stage. he second method is the “direct approach” (Parresol, 1992; Bi et al., 2000; Sharma and Zhang, 2004), in which the stand variables are added directly to the model. Staudhammer and LeMay (2000) reported that there were no clear choices between these two methods in terms of the goodness of the resulting its. he parameter prediction method may be more attractive since the additional variables are used to predict parameters leading to easier model interpretation (Staudhammer and LeMay, 2000). his method, however, may result in a very complex model with many coeicients, particularly if several additional variables are added to the base model, making it diicult to select the starting values in the model itting using nonlinear least squares regression. his was also evident in the preliminary analysis of this study. For this reason, the direct method was used and a more parsimonious model can be produced compared to the parameter prediction method.
In this study, the following stand variables characterising the plots (as shown in Table 1) were tested for inclusion in the base height-diameter model (Eq.( 1)): stand age, site index, quadratic mean diameter, stand density,and basal area. Several combinations of these variables were also considered. Initial screenings of models were based on the signiicance of model parameters. Both graphical and statistical analyses of the residuals were also carried out. he adequacy of the models was determined from comparison using the same procedures applied in selecting the base height-diameter models.
III. RESULTS AND DISCUSSION
A. Performance and Comparison of the Candidate Base Models
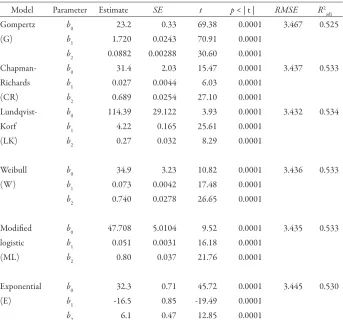
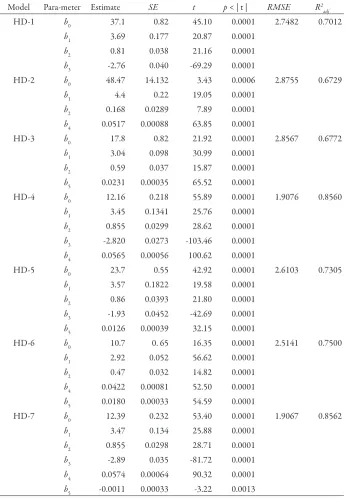
Results of itting six candidate base models including nonlinear least squares estimates of the parameters, the standard error (SE), t-statistic, p-value, the root mean squared error (RMSE)and the adjusted coeicient of determination (R2
adj) are presented in Table 3.
It is apparent from the it statistics that all six base height-diameter models produced almost identical its. his is consistent with the indings reported by Huang et al. (1992) for major tree species in Alberta (Canada), Zhang (1997) for ten conifer species in the inland Northwest of the United States, and Peng et al. (2001) for nine major tree species in Ontario’s boreal forests of Canada. All parameters of these models were statistically signiicant (p-value < 0.01). Comparing the RMSE and R2
adj for each model, the Lundqvist-Korf model had slightly smaller RMSE and higher R2
adj than the other ive models (Table 3). However, the diferences of the RMSE and R2
from sample plots with a wide range of site productivities, stand ages and stand densities (Table 1). his result indicated that the use of models using dbh alone to predict total tree height for A. mangium plantations does not appear to be adequate for explaining variability of tree heights among stands and it would not be satisfactory for plantation management. his type of model may be used when only diameter measurements are available, although the error of prediction can be relatively large as all trees with the same diameter in any one plot will have the same predicted height regardless of the stand in which they are growing. herefore, it was advisable to include additional stand variables to improve the height predictions.
Table 3. Parameter estimates, standard errors and related it statistics for the six nonlinear models tested for selecting the best base height-diameter model
for A. mangium plantations
Model Parameter Estimate SE t p < | t | RMSE R2 adj
Gompertz b0 23.2 0.33 69.38 0.0001 3.467 0.525
(G) b1 1.720 0.0243 70.91 0.0001
b2 0.0882 0.00288 30.60 0.0001
Chapman- b0 31.4 2.03 15.47 0.0001 3.437 0.533
Richards b1 0.027 0.0044 6.03 0.0001
(CR) b2 0.689 0.0254 27.10 0.0001
Lundqvist- b0 114.39 29.122 3.93 0.0001 3.432 0.534
Korf b1 4.22 0.165 25.61 0.0001
(LK) b2 0.27 0.032 8.29 0.0001
Weibull b0 34.9 3.23 10.82 0.0001 3.436 0.533
(W) b1 0.073 0.0042 17.48 0.0001
b2 0.740 0.0278 26.65 0.0001
Modiied b0 47.708 5.0104 9.52 0.0001 3.435 0.533
logistic b1 0.051 0.0031 16.18 0.0001
(ML) b2 0.80 0.037 21.76 0.0001
Exponential b0 32.3 0.71 45.72 0.0001 3.445 0.530
(E) b1 -16.5 0.85 -19.49 0.0001
b2 6.1 0.47 12.85 0.0001
SE = standard error; RMSE: root mean square error; R2
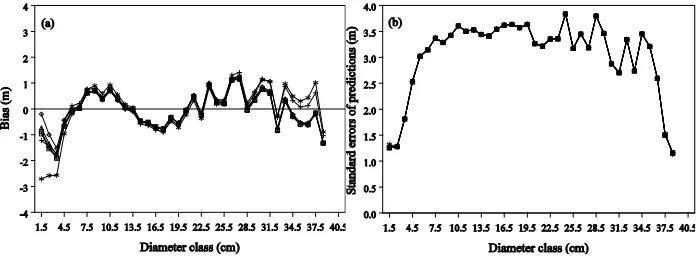
To select the best base model, the adequacy of the six candidate models was also evaluated on the basis of bias and standard errors of the predictions in the validation data. he mean bias and standard error of the predicted height computed for each dbh class are illustrated in Figure 2. Since the number of trees in diameter classes greater than 38.5 cm was fewer than the number of model parameters, the average biases and standard errors of the predictions for those classes were not computed. In general, all six base models produced similar pattern of bias and overall they tended to overestimate tree height. As expected, the standard errors of the predictions for all models were almost the same, and indicated a low precision of height predictions - almost 4 m in most diameter classes.
Figure 2. Average bias (a) and standard errors of the predictions (b) of the six base height-diameter models at diferent dbh classes (star: Gompertz, square: Chapman-Richards, diamond: Lundqvist-Korf, circle: Weibull, plus: exponential, triangle: modiied logistic).
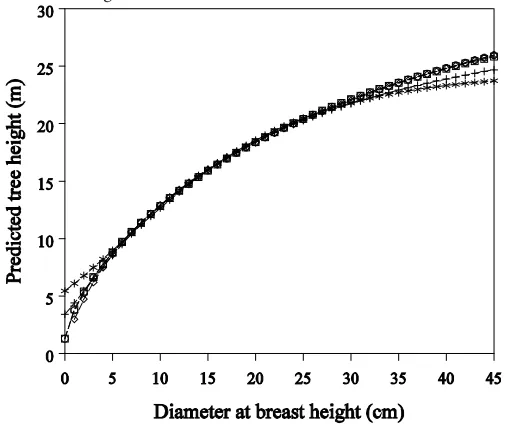
he six base models were then applied to predict tree heights with the range of tree diameters as illustrated in Figure 3. In general, all models produced similar predictions of tree height. However, the Gompertz and exponential models predicted smaller tree heights for trees larger than 30 cm dbh than did the other four models. hese two models were also found to underestimate the heights of large-sized trees in the studies by Zhang (1997) for ten conifer species for even-aged stands in the inland Northwest of the United States. In addition, heights predicted using both these models did not approach values close to 1.3 m when the diameter at breast height approaches 0. he problem is present only for trees less than 5 cm dbh but could cause signiicant overestimation of tree height if the models were applied to very young stands.
of the predictions (Figure 2), the following nonlinear model was chosen as the best base height-diameter model:
(
−)
+ε += −2
1
0exp
3 .
1 b
D b b
Ht ... (2)
In addition, further analysis indicated that the Lundqvist-Korf model (Eq. (2)) can be itted easily and provided more satisfactory it when additional variables (i.e. stand attributes) were included into the model, compared with the Chapman-Richards, Weibull and modiied logistic models.
Figure 3. Predicted tree heights using the six base height-diameter models (star: Gompertz,
square: Chapman-Richards, diamond: Lundqvist-Korf, circle: Weibull, plus: exponential, triangle: modiied logistic).
B. Performance and Comparison of the Generalized Height-Diameter Models
additional variation compared with the base height-diameter model (Eq. (2)). hese results may indicate that while the tree height-diameter data come from plots with varying stand densities, diferences in the height-diameter relationship were not important. In this case, growth competition may afect the development of diameter signiicantly more than it does afectheight growth.
hus, diameter will vary for
trees of a given age and site as competition varies within the stand, but height will
not.
his result, although it contradicts studies reported by Zhang et al. (1997) and Zeide and VanderSchaaf (2002), is consistent with the hypothesis that tree height is relatively insensitive to competition and spacing (Lanner, 1985; Wagner and Radosevich, 1991). According to Smith and Strub (1991) and Smith et al. (1997), trees grown in less dense stands will grow faster in diameter, but will be more tapered. If they grow in more dense stands, the trees will grow more slowly in diameter which results in less taper. hus, variations in stand density cause very large variations in diameter, but remarkably little in height, except at extremely low or high densities (Wagner and Radosevich, 1991; Smith et al., 1997). For this reason, only three stand variables, i.e. stand age (A), site index (S) and basal area (B), were selected for further analysis. he expressions of generalized height-diameter models selected for further examination are given in Table 4 with their parameter estimates and it statistics are presented in Table 5.Table 4. Generalized height-diameter LK models selected for comparison
Table 5. Parameter estimates, standard errors and related fit statistics of the generalized height-diameter models tested.
Model Para-meter Estimate SE t p < | t | RMSE R2 adj
HD-1 b0 37.1 0.82 45.10 0.0001 2.7482 0.7012
b1 3.69 0.177 20.87 0.0001
b2 0.81 0.038 21.16 0.0001
b3 -2.76 0.040 -69.29 0.0001
HD-2 b0 48.47 14.132 3.43 0.0006 2.8755 0.6729
b1 4.4 0.22 19.05 0.0001
b2 0.168 0.0289 7.89 0.0001
b4 0.0517 0.00088 63.85 0.0001
HD-3 b0 17.8 0.82 21.92 0.0001 2.8567 0.6772
b1 3.04 0.098 30.99 0.0001
b2 0.59 0.037 15.87 0.0001
b5 0.0231 0.00035 65.52 0.0001
HD-4 b0 12.16 0.218 55.89 0.0001 1.9076 0.8560
b1 3.45 0.1341 25.76 0.0001
b2 0.855 0.0299 28.62 0.0001
b3 -2.820 0.0273 -103.46 0.0001
b4 0.0565 0.00056 100.62 0.0001
HD-5 b0 23.7 0.55 42.92 0.0001 2.6103 0.7305
b1 3.57 0.1822 19.58 0.0001
b2 0.86 0.0393 21.80 0.0001
b3 -1.93 0.0452 -42.69 0.0001
b5 0.0126 0.00039 32.15 0.0001
HD-6 b0 10.7 0. 65 16.35 0.0001 2.5141 0.7500
b1 2.92 0.052 56.62 0.0001
b2 0.47 0.032 14.82 0.0001
b4 0.0422 0.00081 52.50 0.0001
b5 0.0180 0.00033 54.59 0.0001
HD-7 b0 12.39 0.232 53.40 0.0001 1.9067 0.8562
b1 3.47 0.134 25.88 0.0001
b2 0.855 0.0298 28.71 0.0001
b3 -2.89 0.035 -81.72 0.0001
b4 0.0574 0.00064 90.32 0.0001
All parameters of the seven generalized height-diameter models were signiicantly diferent from zero (p-value< 0.01). In general, the inclusion of new independent stand variables in the height-diameter models provided signiicantly better its of height than those using only dbh (Table 5). he values of RMSE decreased by the value between 0.5564 and 1.4252 m, while the proportion of variation explained by the model increased by the value between 13.88 and 33.21%. Models that include only one stand variable (i.e. models HD-1, HD-2 and HD-3) resulted in relatively larger RMSE and smaller
R2
adj than the models that include two or more additional stand variables. In the cases of two stand variables, model HD-4, which included stand age and site index provided a more satisfactory it than models HD-5 (including stand age and basal area) and HD-6 (including site index and basal area). Model HD-7, which included three stand variables (i.e. stand age, site index and basal area), gave the largest increase in R2
adj and largest decrease in RMSE over the base model.However, the improvement was very small relative to model HD-4, as can be seen from similar values of their parameter estimates and related it statistics of both models (Table 5).
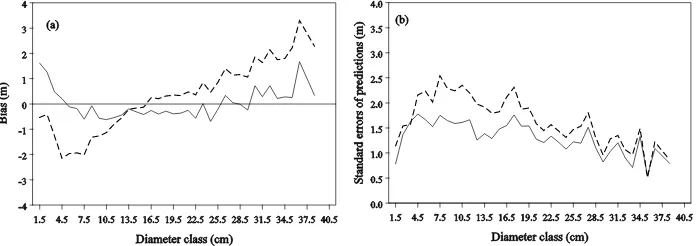
Figure 4. Average bias (a) and standard errors of the predictions (b) of the Models HD-4 and HD-7 at diferent dbh class based on the itting data set (solid line: Model HD-4,
dashed line: Model HD-7)
Figure 5. Average bias (a) and standard errors of the predictions (b) of the Models HD-4 and HD-7 at diferent dbh class based on the validation data set (solid line: Model HD-4, dashed line: Model HD-7).
Model HD-4, which includes only two stand variables (stand age and site index), performed better than model HD-7, which includes three stand variables (stand age, site index and basal area). he good performance of this model may be due in part to the inclusion of stand age, which is important variable in the consideration for height and diameter relationship of even-aged stands, or plantations. In even-aged stands (or plantations), age is a good indicator of the mean size of the individual trees in the stands (Sánchez et al., 2003; Dorado et al., 2006). his result was also in agreement with the hypothesis that the height-diameter relationship does not remain constant over time (Flawelling and de Jong, 1994; Lappi, 1997; Eerikäinen, 2003).
in overall stand growth must be accompanied by a change in tree form. Trees growing on sites with high quality may be taller for a given diameter than trees growing on lower quality sites and the height curves for good quality sites may have steeper slopes than those for poor quality sites.
Although basal area was found to be significant (Table 5), its inclusion did not improve the it much. his result was not expected, since basal area is the most obvious factor afecting the height-diameter relationship in other studies (Parresol, 1992; Staudhammer and LeMay, 2000; Sharma and Zhang, 2004). However, it should be noted that all these previous studies were applied to complex stands, comprising various tree species (although the species being studied were only the most common present in the stands) with very large variation in basal area and number of stems per ha. Another possible explanation may be the collinearity between the independent variables so inclusion of diameter, stand age and site index in the model may have taken into account most of the observed variability among stands. his result suggested that inclusion of basal area (in addition to stand age and site index) had a minimal efect on the height-diameter relationship for A. mangium plantations. As do other measures of stand density discussed earlier (e.g. number of stems), the analysis of height-diameter relationships in this study was consistent with the results by Lanner (1985), Smith and Strub (1991), and Wagner and Radosevich (1991), stated that stand density has little efect of height of trees.
C. Selected Generalized Height-Diameter Model
Since there was no real gain from inclusion of basal area, the efect of basal area on height will be ignored. Model HD-4 (Table 4), i.e. tree height as a function of three variables (viz. dbh, stand age and site index), was therefore selected for predicting tree height for A. mangium plantations. he model may also be applied to thinned stands (although it was developed based on unthinned plots) as stand density did not afect the height-diameter relationship. he inal generalized height-diameter model itted to all data was:
− − +
+
= −
S A
D t
H 1.3 12.16exp 3.45 0.855 2.82 0.0565 ... (3)
where Ht is total tree height (m), D is diameter at breast height (cm), A is stand age (years), and S is site index (m).
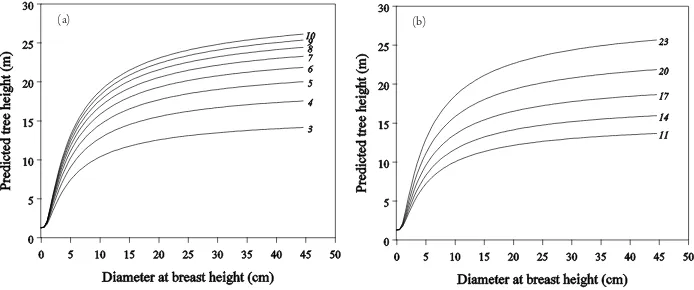
height and diameter growth are reduced and changes of the height curves become very small. Similarly, for a given age, the predicted tree height increases with increasing site index, but the diferences between the height curves of adjacent site index classes tend to increase (Figure 6b). hese predictions follow a biologically consistent progression with increasing dbh, age and site index.
(a)
Figure 6. Predicted tree heights for diferent ages at a given site index of 20 m (a) and predicted tree heights for diferent site index classes at a given age of 6 years (b) using Model HD-4.
IV. CONCLUSION
Six nonlinear models were initially examined to determine the best base height-diameter model for A. mangium plantations. he six models provided very similar results in term of the resulting it and the prediction error (bias) with the Lundqvist-Korf (LK) model being slightly better than the other ive (Gompertz, Chapman-Richards, Weibull, modiied logistic, and exponential). his model may be used when only diameter measurements are available, although the error of prediction can be relatively large.
Since the model with dbh alone inadequately explained the variability of observed tree heights for diferent stand and site conditions, additional independent variables were included. Inclusion of stand variables to the selected base model (generalized height-diameter model) improved signiicantly the precision of height predictions. he generalized height-diameter LK model with stand age and site index,in addition to dbh, provided the best improvement based on it and model validation.
he proposed model allowed the variability in heights within diameter classes depending on stand age and site index and therefore provided more realistic height predictions across varying stands than models which included dbh only. his feature is considered very important, since the generalized height-diameter model developed in this study may be used to predict tree heights of A. mangium not measured in the ield.
ACKNOWLEDGEMENT
he authors would like to thank PT Musi Hutan Persada for kindly providing the data used in the study. Valuable comments by anonymous reviewers on this study are gratefully acknowledged. Financial support that was provided by the Australian Agency for International Development is also highly appreciated.
REFERENCES
Arabatzis, A.A. and H.E. Burkhart. 1992. An evaluation of sampling methods and model forms for estimating height-diameter relationships in loblolly pine plantations. Forest Science 38: 192-198.
Bi, H., V. Jurskis, and J. O’Gara. 2000. Improving height prediction of regrowth eucalypts by incorporating the mean size of site trees in a modiied Chapman-Richards equation. Australian Forestry 63: 255-264.
Borders, B.E. and W.D. Patterson. 1990. Projecting stand tables: a comparison of the Weibull diameter distribution method, a percentile-based projection method, and a basal area growth projection method. Forest Science 36: 413-424.
Chapman, D.G. 1961. Statistical problems in dynamics of exploited isheries populations.
In: Newman, J. (Ed). Mathematical Statistics and Probability. University of California Press, Berkeley, pp. 153-168.
Clutter, J.L., J.C.Fortson, L.V. Pienaar, G.H. Brister, and R.L. Bailey. 1983. Timber Management: A Quantitative Approach. Wiley, New York. 333p.
Colbert, K.C., D.R. Larsen, and J.R. Lootens. 2002. Height-diameter equations for thirteen Midwestern Bottomland hardwood species. Northern Journal of Applied Forestry 19: 171-176.
Curtis, R.O. 1967. Height-diameter and height-diameter-age equations for second-growth douglas-ir. Forest Science 13: 365-375.
Dorado, F.C., U. Diéguez-Aranda, M.B. Anta, M.S. Rodríguez, and K. Gadow. 2006. A generalised height-diameter model including random components for radiata pine plantations in northwestern Spain. Forest Ecology and Management 229: 202-213.
Draper, N.R. and H. Smith. 1998. Applied Regression Analysis (3rd Edition). John Wiley and Sons, New York. 736p.
Eerikäinen, K. 2003. Predicting the height-diameter pattern of planted Pinus kesiya
stands in Zambia and Zimbabwe. Forest Ecology and Management 175: 355-366. Fang, Z. and R.D. Bailey. 1998. Height-diameter models for tropical forests on Hainan
Flawelling, J. and R. de Jong. 1994. Considerations in simultaneous curve itting for repeated height-diameter measurements. Canadian Journal of Forest Research 24: 1408-1414.
Hilt, D.E. and M.E. Dale. 1982. Height prediction equations for even-aged upland oak stands. USDA Forest Service, RP-NE-493. 9p.
Hökkä, H. 1997. Height-diameter curves with random intercepts and slopes for trees growing on drained peatlands. Forest Ecology and Management 97: 63-72. Huang, S. 1999. Ecoregion-based individual tree height-diameter models for lodgepole
pine in Alberta. Western Journal of Applied Forestry 14: 186-193.
Huang, S., S.J. Titus and D.P. Wiens. 1992. Comparison of nonlinear height-diameter functions for major Alberta tree species. Canadian Journal of Forest Research 22: 1297-1304.
Lanner, R.M. 1985. On the insentivity of height growth to spacing. Forest Ecology and Management 13: 143-148.
Lappi, J. 1997. A longitudinal analysis of height/diameter curves. Forest Science 43: 555-570.
Larsen, D.R. and D.W. Hann. 1987. Height-diameter equations for seventeen tree species in southwest Oregon. Oregon State University Forest Research Laboratory, Corvallis. Research Paper 49. 16p.
Lei, Y. and B.R. Parresol. 2001. Remarks on height-diameter modeling. USDA Forest Service, RN-SRS-10. 6p.
Mehtätalo, L. 2004. A longitudinal height-diameter model for Norway spruce in Finland. Canadian Journal of Forest Research 34: 131-140.
Mehtätalo, L. 2005. Height-diameter models for Scots pine and birch in Finland. Silva Fennica 39: 55-66.
Moore, J.A., L. Zhang, and D. Stuck. 1996. Height-diameter equations for ten tree species in the Inland Northwest. Western Journal of Applied Forestry 11: 132-137. Parresol, B.R. 1992. Baldcypress height-diameter equations and their prediction
conidence intervals. Canadian Journal of Forest Research 22: 1429-1434. Peng, C., L. Zhang, and J. Liu. 2001. Developing and validating nonlinear
height-diameter models for major tree species of Ontario’s boreal forests. Northern Journal of Applied Forestry 18: 87-94.
Pienaar, L.V., H.H. Page, and J.W. Rheney. 1990. Yield prediction for mechanically site-prepared slash pine plantations. Southern Journal of Applied Forestry 14: 104-109. Ratkowsky, D.A. 1990. Handbook of Nonlinear Regression Models. Marcel Dekker,
Ratkowsky, D.A. and T.J. Reedy. 1986. Choosing the near-linear parameters in the four-parameter logistic model for radioligand and related assays. Biometrics 42: 575-582.
Richards, F.J. 1959. A lexible growth function for empirical use. Journal of Experimental Botany 10: 290-300.
Sánchez, C.A.L., J.G. Varela, F.C. Dorado, A.R. Alboreca, R.R. Soalleiro, J.G.A. González, and F.S. Rodríguez. 2003. A height-diameter model for Pinus radiata
D. Donin Galicia (Northwest Spain). Annals of Forest Science 60: 237-245. SAS Institute Inc. 2005. SAS/STAT User’s Guide, Version 9.1. SAS Institute Inc, Cary,
NC. 5121p.
Sharma, M. and S.Y. Zhang. 2004. Height-diameter models using stand characteristics for Pinus banksiana and Picea mariana. Scandinavian Journal of Forest Research 19: 442-451.
Smith, D.M., B.C. Larson, and M.J. Kelty. 1997. he Practice of Silviculture: Applied Forest Ecology (9th Edition). John Wiley, New York. 537p.
Smith, W.D. and M.R. Strub. 1991. Initial Spacing: How many trees to plant. In: Duryea, M.L. and P.M. Dougherty (Eds). Forest Regeneration Manual. Kluwer Academic Publishers, Netherlands, pp. 281-289.
Stage, A.R. 1963. A mathematical approach to polimorphic site index curves for grand ir. Forest Science 9: 167-180.
Staudhammer, C. and V. Lemay. 2000. Height prediction equations using diameter and stand density measures. he Forestry Chronicle 76: 303-309.
Temesgen, H. and K. Gadow. 2004. Generalised height-diameter models - an application for major tree species in complex stands of interior British Columbia. European Journal of Forest Research 123: 45-51.
Wagner, R.G. and S.R. Radosevich. 1991. Neighborhood predictors of interspeciic competition in yound Douglas-fir plantations. Canadian Journal of Forest Research 21: 821-828.