A SIMPLE CLOUD DETECTION METHOD FOR GF-1 WFV IMAGERY
L. L. Jia a, *, X.Q. Wanga a
Key Laboratory of Spatial Data Mining & Information Sharing of Ministry of Education, Spatial Information Research Center of Fujian Province, Fuzhou University, China,[email protected]
Commission IV, WG IV/3
KEY WORDS: Cloud detection; GF-1; Texture features; Band operation; BOTF
ABSTRACT:
Identification of clouds in optical images is often a necessary step toward their use. However, aimed at the cloud detection methods used on GF-1 is relatively less. In order to meet the requirement of accurate cloud detection in GF-1 WFV imagery, a new method based on the combination of band operation and spatial texture feature(BOTF) is proposed in this paper. First of all, the BOTF algorithm minimize interference of highlight surface and cloud regions by the band operation, and then distinguish between cloud area and non-cloud area with spatial texture feature. Finally, the cloud mask can be acquired by threshold segmentation method. The method was validated using scenes. The results indicate that the BOTF performs well under normal conditions, and the average overall accuracy of BOTF cloud detection is better than 90%. The proposed method can meet the needs of routine work.
1. INTRODUCTION
1.1 General Instructions
Cloud detection is one of the first difficulties encountered when trying to automatically process optical remote sensing data (Hagolle et al.,2010).The existence of cloud can cause serious problems for a variety of remote sensing activities, including: image compositing(Roy et al.,2010); correction for atmosphere effects (Vermote et al.,2002); calculation of vegetation indices (Huete et al.,2002); classification of land cover(Zhang et al.,2002); and most importantly in change detection(Zhu et al.,2014). Therefore, it is important to detect clouds in satellite images, and screen them accurately before any kind of remote sensing activity is performed.
However, accurate cloud detection for satellite images is quite challenging (Zhu et al., 2015). It is difficult to separate clouds from other clear-sky observations based on the reflectance of spectral bands, as there are many kinds of clouds and each kind may have different spectral characteristics (Platnick et al., 2003).
Over the years, a number of methods were developed for cloud identification, For example ISCCP( The Inter- national Satellite Cloud Climatology Project) (Rossow et al.,1985)、APPOLLO ( The AVHRR Processing Scheme Over Cloud Land And Ocean) (Kriebel et al.,1989)、CLAVR( The NOAA Cloud Advanced Very High Resolution Radiometer) (Stowe & Mcclain,1991), etc. These algorithms are mainly based on the threshold for cloud detection. The threshold gain analysis method based on the histogram of the image itself (Liu et al., 2005) using sliding window or nested window (Liu J, 2010), statistical analysis was made on the different phase images, and ultimately determine the threshold (Yang et al.,2008), etc.
The GaoFen-1 satellite was the first of a series of satellites in the civilian High-Definition Earth Observation Satellite (HDEOS) program to realize a high-resolution and wide-swath optical remote sensing mission. It has been widely used in the field of geographic mapping, ocean and climate meteorological
observation, water conservancy and forestry resources monitoring, urban and traffic fine management, epidemic assessment and public health emergency, Earth System Science Research(Ma et al.,2016;Shang et al.,2016; Zhang et al.,2015; Zhang et al.,2016), because of its convenience, large area and high resolution. It includes four integrated cameras with a 16-m spatial resolution and four-day temporal resolution. Each WFV camera has four multispectral bands, spanning the visible to the near-infrared spectral regions. The swath width of the GF-1 WFV imaging system increases to 800km when the four cameras are combined, which significantly improves the capabilities for large-scale surface observation and monitoring (Li et al.,2017).Although the above methods can effectively eliminate the cloud region for moderate spatial resolution sensors such as Land satellite (Landsat), Advanced Very High Resolution Radiometer (AVHRR) and Moderate Resolution Imaging Spectroradiometer (MODIS),which sensors are usually equipped with more than one thermal band, Short wave infrared band or with water vapor/CO2 absorption bands, all of which are useful for cloud detection, however, them can not be used directly for the identification of cloud pixels in the satellite images of the GF-1. Because of the different parameters such as band and spatial resolution. In this paper, we analyze the spectral characteristics of the cloud and the typical objects in different spectral bands according to the characteristics of GF-1 imagery, we develop a novel method which combination of band operation and texture features for identifying clouds, and the feasibility of the algorithm is verified by images.
2. METHODS
The input data are Top of Atmosphere (TOA) reflectances for band1,2,3,4 (Table 1). For GF-1 imagery, Digital Number (DN) values are converted to TOA reflectances with the atmosphere correction tool, and we achieved this function by IDL programming. Subsequently, extracting cloud features by band operation. Finally, rule based on cloud texture feature is used to extraction cloud pixels. Figure 1 shows the process flow of the BOTF algorithm.
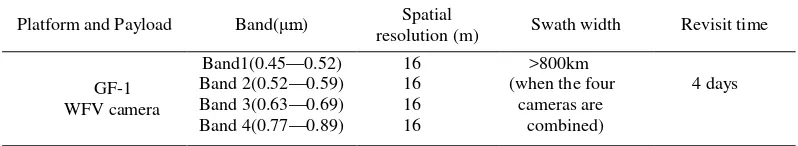
Platform and Payload Band(μm) Spatial
resolution (m) Swath width Revisit time
GF-1 WFV camera
Band1(0.45—0.52) 16 >800km
(when the four
Figure 1. Overall framework of the BOTF algorithm.
Figure 2. Distribution pattern of spectral numerical of cloud and typical objects.
2.1 Spectral analysis and band operation
Due to the high spectral variability of clouds and the Earth's surface, automated accurate separation of clouds from normally illuminated surface conditions is difficult, especially in urban areas (Figure 2). As can be seen from the Figure 2, the reflectivity of cloud and town is very close, therefore, it is difficult to separate them rely on band threshold. The experiment found that RSB can effectively reduce the reflectivity of the cloud, and thus separating the town from the cloud. RSB can be defined by Eq.1:
red blue
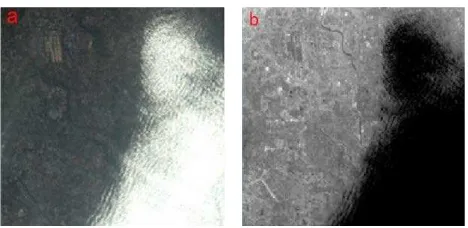
In order to show the effect of RSB on the reflectivity of the ground objects, the paper shows the operation results of the Beijing region, as shown in Figure 3.By comparing with the original image, it is found that the reflectivity of urban buildings is still very high, but the reflectivity of the cloud area is low. The proposed RSB aims to use the important characteristics of the clouds, described above, for detection.
Because of the low reflectivity of vegetation, there will be some vegetation pixels misclassified as cloud. In view of this situation, the normalized difference vegetation index (NDVI) can be used to separate vegetation pixels from cloud pixels.
Figure 3. (a)True-color composite image (SceneID:E116.9_N
40.1_20161105). (b) Result of RSB operation.
2.2 Texture features
Texture is a reflection of the change of gray level or color, which usually reflects the characteristics of objects in the background. Texture features have been successfully employed in object recognition and texture analysis, and they have also been used for cloud classification and cloud detection (Hu et al., 2015;Cheng & Yu et al., 2015). The texture feature of cloud belongs to random texture, its texture element can be varied and unpredictable, but it is different from the statistical texture characteristics of the underlying surface of the object. After RSB operation, the gray level of the cloud area is lower than that of most of the underlying surface, especially in the urban areas.
In the description of texture features, the application of the method includes the first order features, the two order features, the gray travel method and the gray level co-occurrence matrix and other (Kurosu et al., 1999; Clausi & Deng, 2005). Among them, the gray level co-occurrence matrix method is one of the most widely used methods. Through the comparative analysis, this paper selects the characteristic statistics of the texture information as the mean, and the calculation formula is as follows (Haralick, 1979):
( , )
i j
Mean
=
∑∑
p i j i
⋅
(2)Where Mean is the local mean value of the processing window, which reflects the degree of the rule of the image texture, the texture is chaotic, difficult to describe, the value is small; the rule is strong, easy to describe, the value is bigger. In the calculation of co-occurrence matrix and the corresponding texture index, it is found that the values of X and Y transform are set 1 and the processing window is set 9×9 or 11×11, the cloud detection works better.
3. EXPERIMENTS
During the experiments 2 images are selected for experiment purposes. According to the algorithm of cloud detection is shown in Figure.1, which is used to handle images of different regions. The details will not be seen in thumbnail, due to the size of remote sensing image is too large, in order to better observe the test results, we select two representative sub images to show the results.
Second-Figure 4. Example of BOTF cloud mask. (a)RGB composite image (Scene ID: E119.1_N25.6_20160830). (b) BOTF cloud mask.
Figure 5. Example of BOTF cloud mask. (a) RGB composite image (Scene ID: E116.3_N40.1_20150518).(b) BOTF cloud mask.
The sample test results are shown in Figure 4 and Figure 5. The experiments show that, the proposed approach has a higher cloud detection performance in vegetation areas and urban areas. Thick clouds can be detected, but for the smaller optical thickness of the thin clouds, transparent clouds, the detection accuracy is general, there will be some of the leakage phenomenon. Although, the algorithm successfully detects most of the clouds, some of the small clouds can be missed. Since some pixels contain other objects (like buildings and trees), the presence of mixed pixels is difficult for cloud Identification. Similarly, some pixels, which are the boundaries of the clouds or thin cloud, may be misjudged since they contain other objects.
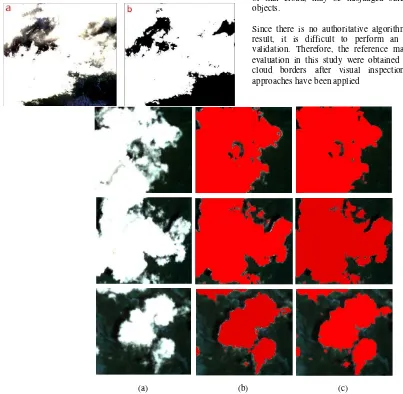
Since there is no authoritative algorithm as a comparison of result, it is difficult to perform an accurate quantitative validation. Therefore, the reference masks for the accuracy evaluation in this study were obtained by manually drawing cloud borders after visual inspection by users. Similar approaches have been applied
(a) (b) (c)
Fig.6.Example of BOTF cloud masks. (a) Original true color image (red, green and blue bands). (b) The results of cloud detection. (c) The real nephogram.
in previous studies of cloud detection (Scaramuzza et al., 2012) to acquire the reference masks for accuracy evaluation. Figure 6 shows the comparison between the results of cloud detection and the real nephogram,cloud in red color. According to the precision of extracting three random Subgraphs from the cloud region in the image shows that the detection precision is better than 90%, it shows that the algorithm can meet the needs of routine work.
4. CONCLUSIONS
showed that mean texture can successfully describe texture properties of cloud regions.
The BOTF performs best for dense, big clouds. Haze like structures, cloud edges and pure white regions (such as snow) have the potential to reduce the algorithm performance. Very small cloud coverage where a patch contains not only cloud but also other structures can also have negative effect on the algorithm performance.
Due to the fact that the research of this paper is only a preliminary attempt, it needs to be improved the accuracy and robustness of the cloud detection algorithm in the future work.
REFERENCES
Cheng H Y, Yu C C. Multi-model solar irradiance prediction based on automatic cloud classification[J]. Energy, 2015, 91:579-587.
Clausi D A, Deng H. Design-based texture feature fusion using Gabor filters and co-occurrence probabilities.[J]. Image Processing IEEE Transactions on, 2005, 14(7):925-936.
Hagolle O, Huc M, Pascual D V, et al. A multi-temporal method for cloud detection, applied to FORMOSAT-2, VENµS, LANDSAT and SENTINEL-2 images[J]. Remote Sensing of Environment, 2010, 114(114):1747-1755.
Haralick R M. Statistical and structural approaches to texture[J]. Proceedings of the IEEE, 1979, 67(5):786-804.
Hu X, Wang Y, Shan J. Automatic Recognition of Cloud Images by Using Visual Saliency Features[J]. IEEE Geoscience & Remote Sensing Letters, 2015, 12(8):1-5.
Huete A, Didan K, Miura T, et al. Overview of the radiometric and biophysical performance of the MODIS vegetation indices[J]. Remote Sensing of Environment, 2002, 83(1– 2):195-213.
Kriebel K T, Saunders R W, Gesell G. Optical Properties of Clouds Derived from Fully Cloudy AVHRR Pixels[J]. Contributions to Atmospheric Physics,1989,62: 165-171.
Kurosu T, Uratsuka S, Maeno H, et al. Texture statistics for classification of land use with multitemporal JERS-1 SAR single-look imagery[J]. IEEE Transactions on Geoscience & Remote Sensing, 1999, 37(1):227-235.
Li Z, Shen H, Li H, et al. Multi-feature combined cloud and cloud
shadow detection in GaoFen-1 wide field of view imagery[J]. Remote Sensing of Environment, 2017, 191:342–358.
Liu J. Improvement of dynamic threshold value extraction technic in FY-2 cloud detection[J].Journal of Infrared and Millimeter Waves, 2010, 29(4):288-292.
Liu X, Xu J M, Du B Y. Automatic cloud detection of GMS-5 images using dual channel dynamic threshold[J]. Journal of Applied Meteorology, 2005, 16(4):434-444.
Ma Y, Guo Y, Deng G et al. Habitat evaluation of Sichuan snub nosed monkey based on GF-1 images [J]. Journal of Beijing Forestry University, 2016, v.38 (7): 81-90.
Platnick S, King M D, Ackerman S A, et al. The MODIS cloud products: algorithms and examples from Terra[J]. IEEE Transactions on Geoscience & Remote Sensing, 2003, 41(2):459-473.
Rossow W B, Mosher F, Kinsella E, et al. ISCCP Cloud Algorithm Intercomparison.[J]. Journal of Climate And Applied Meteorology,1985,24( 9) : 877-903.
Roy D P, Ju J, Kline K, et al. Web-enabled Landsat Data (WELD): Landsat ETM+ composited mosaics of the conterminous United States[J]. Remote Sensing of Environment, 2010, 114(1):35-49.
Scaramuzza P L, Bouchard M A, Dwyer J L. Development of the Landsat Data Continuity Mission Cloud-Cover Assessment Algorithms[J]. IEEE Transactions on Geoscience & Remote Sensing, 2012, 50(4):1140-1154.
Stowe L L, Mcclain E P, Carey R, et al. Global distribution of cloud cover derived from NOAA/AVHRR operational satellite data[J]. Advances in Space Research, 1991, 11(3):51-54.
Shang P, Shen F. Atmospheric Correction of Satellite GF-1/WFV Imagery and Quantitative Estimation of Suspended Particulate Matter in the Yangtze Estuary[J]. Sensors, 2016, 16(12):1997.
Vermote E F, Saleous N Z E, Justice C O. Atmospheric correction of MODIS data in the visible to middle infrared: first results[J]. Remote Sensing of Environment, 2002, 83(1– 2):97-111.
Yang C J, Xu J M, Du B Y. Application of Time Series in FY2C Cloud Detection[J]. Journal of Atmospherics &\senvironmental Optics, 2008, 3(5): 377-391.
Zhang Y, Guindon B, Cihlar J. An image transform to characterize and compensate for spatial variations in thin cloud contamination of Landsat images[J]. Remote Sensing of Environment, 2002, 82(2-3):173-187.
Zhu Z, Woodcock C E. Automated cloud, cloud shadow, and snow detection in multitemporal Landsat data: An algorithm designed specifically for monitoring land cover change[J]. Remote Sensing of Environment, 2014, 152:217–234.
Zhang X, Zhang J, Meng J M. Comparison of sea ice detection ability of Landsat-8 and GF-1 in the Bohai Sea[J]. Marine Sciences, 2015.
Zhu Z, Wang S, Woodcock C E. Improvement and expansion of the Fmask algorithm: cloud, cloud shadow, and snow detection for Landsats 4–7, 8, and Sentinel 2 images[J]. Remote Sensing of Environment, 2015, 159:269–277.