ABSTRACT:
Most traditional methods for rice mapping with remote sensing data are effective when they are applied to the initial growing stage of rice, as the practice of flooding during this period makes the spectral characteristics of rice fields more distinguishable. In this study, we propose a sequential classifier training approach for rice mapping that can be used over the whole growing period of rice for monitoring various growth stages. Rice fields are firstly identified during the initial flooding period. The identified rice fields are used as training data to train a classifier that separates rice and non-rice pixels. The classifier is then used asa prioriknowledge to assist the training of classifiers for later rice growing stages. This approach can be applied progressively to sequential image data, with only a small amount of training samples being required from each image. In order to demonstrate the effectiveness of the proposed approach, experiments were conducted at one of the major rice-growing areas in Australia. The proposed approach was applied to a set of multitemporal remote sensing images acquired by the Sentinel-2A satellite. Experimental results show that, compared with traditional spectral-index-based algorithms, the proposed method is able to achieve more stable and consistent rice mapping accuracies and it reaches higher than 80%during the whole rice growing period.
1. INTRODUCTION
Continued mapping of rice fields with remote sensing data pro-vides critical information for irrigation water budgeting and yield prediction (Kuenzer and Knauer, 2013, Mosleh et al., 2015). Pe-riodically repeated observations of the same geographical area, known as multitemporal remote sensing, has enabled frequent monitoring of rice growth, and greatly facilitated studies on phe-nology and temporal transition of rice fields at a broad spatial scale.
Previous studies have shown that rice fields can be identified by detecting their unique optical features during the initial flooding period (Xiao et al., 2005). These spectral-index-based methods have been developed and applied for mapping rice distributions (Li et al., 2016, Zhang et al., 2015, Qin et al., 2015, Jin et al., 2016, Zhou et al., 2016, Dong et al., 2016). The Land Surface Water Index (LSWI), which is sensitive to leaf water and soil moisture, has mostly been utilized to enhance the spectral fea-tures of rice during the initial flooding period. Then discrimi-nant rules have been set for the relationships between LSWI and biomass-related indices, such as Normalized Difference Vegeta-tion Index (NDVI) and Enhanced VegetaVegeta-tion Index (EVI), to dis-tinguish rice fields from other crops. However, these methods are only applicable to the initial flooding period of rice. Rice map-ping during later rice growing stages is relatively harder, as the decreased water level and increased plant height make the spec-tral characteristics of rice less distinguishable from those of other crops.
In this study, we propose a sequential classifier training approach for rice mapping that can be applied to the whole growing period
∗Corresponding author
of rice. Rice fields are firstly identified during the initial flooding period. The identified rice fields are used as training data to train a classifier that separates rice and non-rice pixels. The classifier is then used asa prioriknowledge to assist the training of classi-fiers for later rice growing stages. This approach can be applied progressively to sequential image data, with only a small amount of training samples being required from each image. In order to demonstrate its effectiveness, the proposed approach was applied to a set of multitemporal remote sensing images over one of the major rice-growing areas in Australia.
2. METHOD
2.1 Proposed Procedure
The proposed procedure for sequential classifier training is shown in Fig. 1. According to the sequence of sensing date, images dur-ing the flooddur-ing period are indexedt−1,t−2,· · ·,t−N, where
Figure 1. The proposed sequential classifier training procedure for rice mapping. SI: Spectral Index; TASVM: Temporal-Adaptive Support Vector Machine.
Detailed descriptions of the proposed approach are provided in the following two subsections.
2.2 Rice Field Identification
A well-established method for rice field mapping using optical re-mote sensing data is the spectral-index-based algorithms (Xiao et al., 2005, Xiao et al., 2006). These algorithms utilize the unique spectral features of rice fields during their initial flooding period, when rice plants are partially or entirely submerged under wa-ter. During this period, water surface contributes a significant amount of reflected solar radiance to the sensor. This leads to an increase in Land Surface Water Index (LSWI) and decreases in Normalized Difference Vegetation Index (NDVI) and Enhanced Vegetation Index (EVI). These indices are defined as:
LSWI = ρnir−ρswir
ρnir+ρswir
, (1)
NDVI = ρnir−ρred
ρnir+ρred
, (2)
EVI = 2.5× ρnir−ρred
ρnir+ 6×ρred−7.5×ρblue+ 1
, (3)
whereρblue, ρred,ρnir, andρswirare reflectance values in the blue, red, near-infrared, and short-wave-infrared bands, respec-tively. In this study, Band 2 (490 nm), Band 4 (665 nm), Band 8 (842 nm), and Band 11 (1610 nm) of the Sentinel-2A data are associated with the blue, red, near-infrared, and short-wave-infrared bands, respectively.
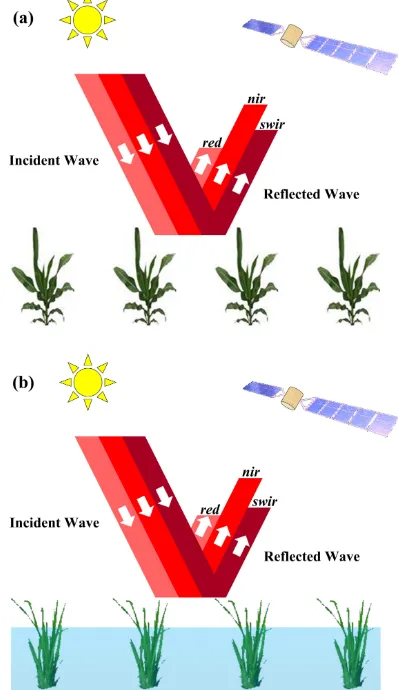
The rationale behind the spectral-index-based algorithms for rice field identification is further explained in Fig. 2. Due to the spectral characteristics of crop canopy, non-flooded crops such as maize (Fig. 2a) usually have a low reflectance value in the red band, a high reflectance value in the near-infrared band, and a medium reflectance value in the short-wave-infrared band. For the flooded rice field (Fig. 2b), its spectral characteristics are heavily affected by the presence of water. It can be observed that reflectance in the red and near-infrared bands decease, mainly due to the submersion of crop leaves. The reflectance in the short-wave-infrared band deceases as well because of the water absorp-tion effect in this band.
Based on this rationale, the following spectral-index-based rule can be applied to identify rice fields (Dong et al., 2015):
LSWI≥min{NDVI,EVI}, (4)
Figure 2. Reflectance characteristics in the red, near-infrared (nir), and short-wave-infrared (swir) bands for (a) non-flooded
cropland (maize field) and (b) flooded rice field.
The water-sensitive index LSWI is compared with the biomass-sensitive indices NDVI and EVI to distinguish flooded rice fields from other crops.
2.3 Sequential Classifier Training
is the bias factor forf( ).
In addition to the assistant classifierfs(x), the training samples
of Imaget,{xi, yi}n
i=1, are also utilized in the training offt(x),
wherexiis the feature vector of theith training sample andyiis
its corresponding label. The TASVM (Guo et al., 2017) is used to trainft(x)by solving the following constrained quadratic
pro-gramming problem:
wheremandnare the numbers of spectral features and training samples, respectively;µ ={µj}m
j=1andξ ={ξi} n
i=1are two sets of non-negative slack variables.
The knowledge provided byfs(x)and{xi, yi}n
i=1are synthe-sized in Eq. (7) with two constraints. The first constraint restricts
ft(x)from departing too far away from the assistant classifier fs(x). The second constraint measures the classification error of ft(x)on the training samples{xi, yi}n
i=1. With the help of the assistant classifierfs(x), only a small number of training
sam-ples are required for trainingft(x).
There are three terms in the objective function of Eq. (7). The first term accounts for the margin space offt(x). The second
and third terms aim to minimize the degree of violation of the constraints. The regularisation parametersCandF control the weights of the second and third terms relative to the first term.
The problem in Eq. (7) can be solved with standard quadratic programming algorithms (Nocedal and Wright, 2006). After de-terminingft(x), it can be used as the updated assistant classifier
to assist the training an classifier for the next image (Imaget+1).
3. EXPERIMENT AND RESULTS
3.1 Study Area and Data Sets
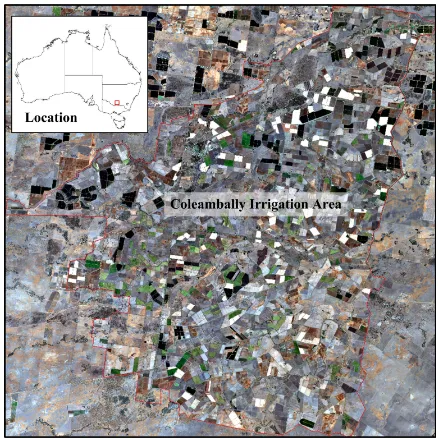
3.1.1 Description of the study area The study focused on one of the major rice-growing areas in the Riverina region, the Coleambally Irrigation Area, which is located in the southwestern part of New South Wales, Australia, as shown in Fig. 3. The area has a semiarid climate, with distinct seasonal changes in tempera-ture. The hottest month is January with an average min/max tem-perature of 18.8/34.1◦C, while the coldest month is July with an
the semi-arid climate and the high water consumption of the rice industry, water supplement in this area largely depends on irri-gation from the Murrumbidgee River. Therefore, timely and ac-curate mapping of the spatial distribution of crop plantations is critical for the local Irrigation Company to make appropriate de-cisions on water budgeting and allocation.
Figure 3. Location and color composite map (R: Band 4; G: Band 3; B: Band 2) of the study area.
spa-Figure 4. Rice calendar of the study area.
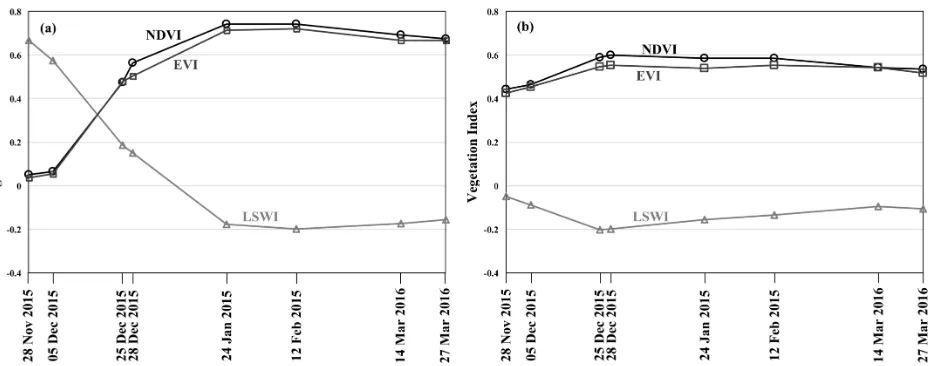
Figure 5. Temporal variations of Land Surface Water Index (LSWI), Normalized Difference Vegetation Index (NDVI), and Enhanced Vegetation Index (EVI) for (a) rice and (b) non-rice (citrus) crops.
tial resolutions were resampled into 10 m resolutions in order to make them consistent with the other bands that had 10 m resolu-tions (Bands 2, 3, 4, and 8).
3.1.3 Ground reference data The rice distribution map of the study area was provided by the local Coleambally Irrigation Company. The rice fields were identified via visual interpretation of a high spatial resolution image and several field visits during December 2015. In this study, these data were used as ground reference data to assess the accuracy of the proposed method.
3.2 Results and Discussions
3.2.1 Temporal variations of rice and non-rice crops The temporal variations of LSWI, NDVI, and EVI for a rice field and a non-rice field (citrus trees) are shown in Figs. 5a and 5b, re-spectively. It was found that, during the initial flooding period (the first two images), the LSWI of rice was higher than NDVI and EVI, which was different from that of the non-rice field. By using traditional spectral-index-based rules, rice fields could be distinguished from non-rice fields during this period. However, during the later growing stages, the LSWI of rice became lower than NDVI and EVI, which is similar to that of the non-rice field.
This made rice fields less distinguishable from non-rice fields. Therefore, traditional spectral-index-based rules are suitable for the initial flooding periods of rice.
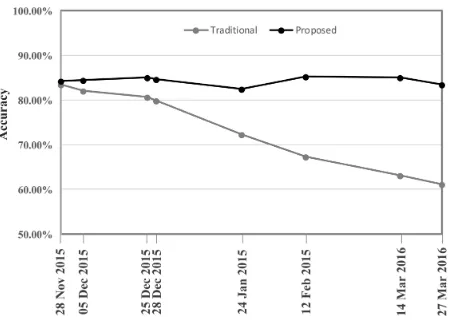
3.2.2 Rice mapping accuracy Rice mapping accuracies ob-tained by the proposed method were compared with those by di-rectly applying the traditional spectral-index-based rule to each image. The results are shown in Fig. 6. It was found that during the initial flooding period, the traditional method achieved rea-sonable rice mapping accuracies. However, decreased accuracies were observed for the traditional method during later rice grow-ing periods. Compared with the traditional method, the proposed method achieved more stable and consistent rice mapping accu-racies that were greater than 80%during the whole rice growing period. The results show the advantage of the proposed method in rice mapping during late rice growing period.
4. CONCLUSIONS
identifi-Figure 6. Rice mapping accuracies obtained by the traditional and proposed methods.
cation results at the initial flooding period using spectral-index-based algorithms. Training data for later images can then be collected with less intensive workload. The sequential training can be conducted with limited new training samples to reflect the current variations. Experimental results showed that, com-pared with the traditional spectral-index-based algorithms, the proposed method was able to achieve more stable and consistent rice mapping accuracies that were than 80%during the whole rice growing period.
As demonstrated in the experiment, the proposed rice mapping approach can be applied progressively to sequential image data over the whole growing period of rice. For classifier training of each incoming image, the classifier of the previous image is used as an assistant classifier, which reduces the required number of training samples. The assistant classifier can be more reliable if two images are sensed within a shorter temporal interval. When compared with other approaches that require the availability of raw data (pixels values or/and their corresponding labels) from the previous image, this approach is more flexible and computa-tionally efficient as only the parameters of the assistant classifier are required and used for computation. A limitation of the current approach is that the land cover classes need to remain unchanged over time within the imaged area. So future studies need to be focused on solving this problem.
ACKNOWLEDGEMENT
The authors would like to thank Mr. Graham Parton and Mr. Bernard Star at the Coleambally Irrigation Co-operative Ltd for providing ground reference data of the Coleambally Irrigation Area.
REFERENCES
Dong, J., Xiao, X., Kou, W., Qin, Y., Zhang, G., Li, L., Jin, C., Zhou, Y., Wang, J., Biradar, C. et al., 2015. Tracking the dy-namics of paddy rice planting area in 1986–2010 through time series Landsat images and phenology-based algorithms. Remote Sensing of Environment160, pp. 99–113.
Dong, J., Xiao, X., Menarguez, M. A., Zhang, G., Qin, Y., Thau, D., Biradar, C. and Moore, B., 2016. Mapping paddy rice plant-ing area in northeastern Asia with Landsat 8 images, phenology-based algorithm and Google Earth Engine. Remote Sensing of Environment185, pp. 142–154.
Index of Normalized Difference Vegetation Index (RNDVI) in the Poyang Lake Region, China. Frontiers of Earth Science10(2), pp. 303–314.
Mosleh, M. K., Hassan, Q. K. and Chowdhury, E. H., 2015. Ap-plication of remote sensors in mapping rice area and forecasting its production: A review.Sensors15(1), pp. 769–791.
Nocedal, J. and Wright, S., 2006. Numerical Optimization (Sec-ond Edition). Springer Science & Business Media, LLC.
Qin, Y., Xiao, X., Dong, J., Zhou, Y., Zhu, Z., Zhang, G., Du, G., Jin, C., Kou, W., Wang, J. et al., 2015. Mapping paddy rice planting area in cold temperate climate region through analysis of time series Landsat 8 (OLI), Landsat 7 (ETM+) and MODIS imagery.ISPRS Journal of Photogrammetry and Remote Sensing
105, pp. 220–233.
Xiao, X., Boles, S., Frolking, S., Li, C., Babu, J. Y., Salas, W. and Moore, B., 2006. Mapping paddy rice agriculture in South and Southeast Asia using multi-temporal MODIS images. Remote Sensing of Environment100(1), pp. 95–113.
Xiao, X., Boles, S., Liu, J., Zhuang, D., Frolking, S., Li, C., Salas, W. and Moore, B., 2005. Mapping paddy rice agriculture in southern China using multi-temporal MODIS images.Remote Sensing of Environment95(4), pp. 480–492.
Zhang, G., Xiao, X., Dong, J., Kou, W., Jin, C., Qin, Y., Zhou, Y., Wang, J., Menarguez, M. A. and Biradar, C., 2015. Mapping paddy rice planting areas through time series analysis of MODIS land surface temperature and vegetation index data. ISPRS Jour-nal of Photogrammetry and Remote Sensing106, pp. 157–171.