0 5 25 75 95 100 logo - prijedlog 13. srpnja 2013. 10:34:17
Statistical Performances of Population
Migration in the Republic of Macedonia at the
Beginning of the 21
stCentury
DOI: 10.11567/met.30.1.2 UDK: 314.7(497.7)”2000/2011” Izvorni znanstveni rad Primljeno: 19.11.2013.
Prihvaćeno: 3.6.2014.
Kosta Sotiroski
University “St. Clement of Ohrid” – Bitola, Faculty of Economics – Prilep, Prilep kostasotiroski@ymail.com
Ilija Hristoski
University “St. Clement of Ohrid” – Bitola, Faculty of Economics – Prilep, Prilep ilija.hristoski@uklo.edu.mk
SUMMARY
The Republic of Macedonia has always been considered a highly intensive migration area, characterized by both exhaustive inner movements of its citizens, as well as continuous emigration processes towards other countries. This paper is focused on exploring and analyzing the volume, dynamics, trends, demographic characteristics,
and the variability of migration flow modalities in the country during the first deca -de of the 21st century, as well as their conjunction and effects on the socio-economic
factors. Having in mind the diversities of the migration flows within the country, the
expected outcomes are projected towards discovering relevant information about their changes, their trends, and the interaction between the basic indicators being acquired by appliance of relevant statistical migration-related metrics and those
por-traying the statistical regions’ development in the specified period of time.
KEY WORDS: migration balance, immigration, emigration, indicators of regional development, statistical inference, Republic of Macedonia
INTRODUCTION
The mechanical (physical) movement of residents, also known as “popu-lation migration” or “human migration”, is a global, yet continuous and
variable process over time. Human migrations appear in different modali -ties, such as permanent or temporary, internal (local, intra-regional, region-al) or external (across borders), economically or politically induced, forced
have different modalities, too, and both their volume and impact intensity varies in different time periods. As a result, the structure of the labour mar -ket changes and novel tendencies in regional development are initiated, as well.
The Republic of Macedonia has always been considered a highly inten-sive migration area, characterized by both exhaustive inner movements of its citizens, as well as continuous emigration processes towards other coun-tries.
Historically, the internal migration flows within the Republic of Mac
-edonia have exhibited different intensities in specific time periods. In gen -eral, they still occur from villages to towns, especially towards the capital city of Skopje, both from rural and urban places. The most intensive wave of rural-to-urban migrations happened during the 1960’s and 1970’s, a time period known as “the industrialization period”. During this period, it has been estimated that more than 175,000 inhabitants have left rural places and have moved into towns and cities, in order to resolve their existential
problems. Such an immense migration flow has implied a “rural exodus” to cities, especially the city of Skopje, followed by significant consequences in
the process of demographic aging both on a regional and geographic scale (Стратегија за демографски развој на Република Македонија: 2008 – 2015, 2008: 12-13). Combined with emigration flows towards third countries, the
internal migrations have led to depopulation and reduction of the migra-tion potential in rural areas, which has involved a relative depressing of
in-ternal migration levels during the last two decades. It should also be noted
that internal migrations at the beginning of the last decade have been
trig-gered, to a certain extent, by the war conflict between Macedonian security
forces and the Albanian separatists in 2001, when about 76,000 inhabitants, mainly from the Skopje, Kumanovo, and Tetovo regions, were forced to leave their homes looking for safety and protection throughout the country (Bornarova and Janeska, 2012: 2).
The phenomenon of migrations from the Republic of Macedonia has a long tradition, lasting for more than 100 years. The prevailing destinations have always been the West-European countries, as well as overseas coun-tries, including the USA, Canada, and Australia. For instance, more than 170,000 Macedonian citizens migrated to only three West-European
coun-tries from 1998 to 2011, these including Germany, Italy, and Switzerland, according to EUROSTAT (Mиткoвскa, 2014). The emigration flows have
characterized not only the 20th century, but they have also continued in the
from the Republic of Macedonia to third countries have shown a trend of constant increase during the last four decades, followed by crucial changes in the structural characteristics of the emigrants, their directions of move-ments, the reasons for migration, as well as the period of stay abroad (Reso- Reso-lution on Migration policy of Republic of Macedonia: 2009–2014, 2008: 3).
Those changes correspond to the phases of social and economic
develop-ment in the country, also reflecting the changes in migration policies being introduced by the countries where Macedonian emigrants settle. In fact, the
biggest emigrant wave of about 200,000 inhabitants, originating from the Republic of Macedonia towards third countries, has begun after the
coun-try gained its independence in 1990. It was induced by the severe economic
crisis that struck the country from the beginning of transition, since the pov-erty rate escalated enormously, and the unemployment rate levelled out above 30% in continuity (Bornarova and Janeska, 2012: 2).
However, despite the dimensions of migration flows from the Republic
of Macedonia, the statistical evidence about such dimensions is relatively poor. Moreover, the exact number of Macedonian citizens staying and liv-ing out of the borders of the country cannot be determined precisely.
Ac-cording to the existing analyses that are primarily based on the officially
published population census data, the decrease in Macedonian population due to international migrations is considerably smaller than the one caused
by internal migration flows. For instance, about 50,000 inhabitants have left the Republic of Macedonia from 1989 to 1994, whilst 173,611 Macedoni
-an citizens lived outside the borders of the country according to the 1994
population census statistics. However, based on the evidence provided by foreign countries to which Macedonian emigrants migrate, it has been es-timated that the emigration rate is between 10,000 and 15,000 persons per annum (Стратегија за демографски развој на Република Македонија: 2008 – 2015, 2008: 12-13). In 2012, EUROSTAT has announced that the number
of emigrant Macedonian citizens in foreign countries has reached 550,000, which represent 26% of the total number of inhabitants in the Republic of
Macedonia (Bornarova and Janeska, 2012: 2; Mиткoвскa, 2014). On the oth -er hand, the US Statistical Bureau claims that the numb-er of Macedonian
citizens in overseas and other countries is over 470,000, which is more than 100,000 less than the number given by EUROSTAT (Mиткoвскa, 2014).
Despite the fact that official institutions in the Republic of Macedonia
conceal the numbers regarding emigrants from the country, whilst the es-timation of 230,000 regularly emigrated persons from 1998 to 2011, made
clear that the number reaches dramatic heights, since it does not include those who stay and work abroad illegally. However, it is estimated that the
number of the latter is even higher than the number of regular emigrants.
Yet, more disturbing is the fact that not just single persons of late, but whole Macedonian families have been emigrating abroad more frequently than ever before. As a result, the number of newborns is steadily increasing from
3,510 Macedonian children born abroad in 2009, to 4,221 in 2012, according to the evidence provided by the State Statistical Office of the Republic of Macedonia (Mиткoвскa, 2014).
In general, the contemporary migrant flows from/into and within the
Republic of Macedonia have been induced by several dominant factors, in-cluding the following ones: the unfavourable overall economic situation, especially the unfavourable situation on the labour market, the high par-ticipation of young population in the total number of unemployed persons, and the problem of unemployed, yet highly educated people, which has escalated both in volume and structure during recent years. Furthermore,
highly negative demographic trends are also evident, as well as significant differences in regional economic and social development, which altogether have led to severe social differentiation within the society, inequalities and differences, regional demographic disparities, unequal and unsustainable
territorial distribution of the population, poor quality of life, as well as an absence of social cohesion (Стратегија за демографски развој на Република Македонија: 2008 – 2015, 2008: 35). The Republic of Macedonia is still an
in-sufficiently developed country, characterized by low GDP rates and, there -fore, it cannot provide the minimum number of working positions to satisfy
the high volume of the unemployed workforce (Mиткoвскa, 2014).
The migrations’ effect on the demographic image is twofold. First of all,
it has a direct impact on the statistics, the territorial distribution, and the population structure. On the other, it determines the birth rate and the mor-tality rate due to the consequences of the changes in the gender and the age
structure of the population. The places and regions hit by emigration flows suffer a lack of workers, and there are unexploited physical resources, as
well. Quite the opposite, the places and regions to which immigrants
mi-grate suffer a surplus of workers, leading towards unemployment, poverty,
increased population density, as well as the decreased well-being of indi-viduals and societies, otherwise known as the “quality of life”.
In that context, it is inevitable to encompass and analyze statistically and
on a regular basis the relevant data about population migrations in a
draw corresponding statistical conclusions, and make subsequent forecasts, projections, or simulations (НТЕС, 2007).
The paper is structured as follows: after the introduction to the substance, the subject, goal, and methodology underlying the research have been elab-orated, followed by an overview of the related recent research done on this
topic. Next, a statistical analysis of the population migration from/into the
Republic of Macedonia by statistical regions for 2000 and 2011 has been presented, along with the corresponding statistical indicators. Based on the later ones, statistical inferences about population migration in the Republic of Macedonia, given by statistical regions and for the observed time period, have been drawn through assessment of several statistical hypotheses. The concluding remarks, being extracted from the statistical analysis, are given at the end, pointing out recommendations on facilitating further explora-tion of migraexplora-tions within the country.
SUBJECT, GOAL, AND METHODOLOGY
This research is focused on exploring and analyzing the volume, dynam-ics, trends, and demographic characteristdynam-ics, as well as the variability of
migration flow modalities in the Republic of Macedonia at the beginning
of the 21st century, as well as their conjunction and effects on the socio-eco
-nomic factors. Having in mind the diversities of the migration flows with -in the country, the expected outcomes are projected towards discover-ing relevant information about their changes, their trends, and the interaction between the basic indicators being acquired by appliance of relevant statis-tical migration-related metrics and those portraying the statisstatis-tical regions’
development in the defined period of time. In order to accomplish success
-fully the defined goal, the following plan of statistical research has been
implemented, along with corresponding research methodology:
– Identification of relevant sources of statistical data, both primary and sec
-ondary, about the migration movements in the Republic of Macedonia within the defined time frame, followed by their acquisition, completion, prepara
-tion, grouping, and processing, using the methods of descriptive statistics;
– Creation of an interaction between the migration-related indicators and the indicators of the statistical regions’ development, by employing data process
-ing with the methods of the regression and correlation analysis;
– Definition of statistical hypotheses and carrying out a statistical inference for different modalities of migration movements in various time instances
parametric ANOVA test, and the contingency test (χ2), as well (Сотироски,
2004: 301–323, 275–279; Kranzler, 2007);
– Realization of the above mentioned statistical analyses through relevant sof
-tware support, including IBM® SPSS® Statistics (Allen and Bennett, 2012;
Kirkpatrick and Feeney, 2012).
This concept inevitably introduces the necessity of creating statistical indicators, i.e. elements of statistical metrics for migration movements, in-cluding: migration balance1, migration balance rate2, emigration rate (rate
of outflow)3 and immigration rate (rate of inflow)4. These metrics, along
with the indicators of the regional development that refer to various sta-tistical regions in the Republic of Macedonia, should be continuously as-sessed, computed, and compared over time, since they are supposed to be fundamental constitutional elements of the human migration database for the country, as well as a subject of corresponding statistical analysis and inference.
RELATED RESEARCH
In general, considerably little research has been conducted so far on mi -gration in the Republic of Macedonia, taking into account the dimensions of this global phenomenon. The main reason for this is the absence of relevant data that is systematically and continuously collected on a regular basis,
being unified both by its format and nature, and, at the same time, being
trustworthy, as well. Despite the existence of several domestic bodies that deal with migration data (e.g. the Agency of Emigration of the Republic of
Macedonia, the State Statistical Office of the Republic of Macedonia, the Ministry of Foreign Affairs of the Republic of Macedonia, the Ministry of Labour and Social Policy of the Republic of Macedonia), there are huge dis -crepancies in the dynamics, quality and scope of the raw data being collect-ed, processcollect-ed, or made available by these sources. On the other hand, such data is still considered quite sensitive due to political reasons, as well as in the whole region encompassing the Balkan countries, and therefore it is not 1 Migration balance equals the diff erence between the number of immigrants and the num-Migration balance equals the difference between the number of immigrants and the
num-ber of emigrants in the specified time period.
2 Migration balance rate ��� is a ratio between the migration balance and the average num-Migration balance rate ��� is a ratio between the migration balance and the average
num-ber of residents in a specified time period, multiplied by a factor of 1000.
3 Emigration rate (rate of outflow) [‰] is a ratio between the number of emigrants and the
average number of residents in a specified time period, multiplied by a factor of 1000.
always accessible, at least not to an extent and/or in a form suitable for ex
-ploratory usage. This impedes, or, in the best case, complicates the scientific analyses, assessments and predictions. In most cases, more systematic and
up-to-date information has been obtained by foreign organizations, rather than domestic ones.
However, the recent, ever-increasing number of published scientific pa -pers and organized meetings focused on this complex and important issue point out the necessity of its thorough and continuous tracking and evalua-tion, bearing in mind the multiple aspects: demographic, social, economic,
political, ethnical, national etc. In that sense, it is worth mentioning some of the recent and most important research endeavours. One of the first sci
-entific attempts dealing with the migration characteristics of the population in the Republic of Macedonia, based on the 1981 and 1994 census data, has
been presented by Bubevski (2001). He has focused mainly on the migration balance between the autochthonous and immigrated population. Kljusev (2007) has elaborated the volume and structure of the immigrated
popu-lation within the Republic of Macedonia from 1994 to 2003. He has also
analyzed the number of Macedonian citizens who have resided in certain
European countries from 1996 to 2004, as well as the number of Macedo -nian emigrants in overseas countries. Jakimovski (2007) has focused on the changes in the volume and spatial distribution of the population in the
Sko-pje region from 1994 to 2002, based on 2002 population census data.5
Janes-ka and IvanosJanes-ka (2007) have elaborated the structure of the autochthonous and immigrated population in the Republic of Macedonia from 1994 to 2002, as well as the internal migrations from 1994 to 2004. In addition, they have analyzed the internal and external migrations by regions from 1994 to 2004, and the demographic characteristics of the migrants, as well. Ta -levski (2007) has analyzed the migration balance of the total, urban, and rural population in the Republic of Macedonia according to the population
censuses held from 1948 to 2002. Macedonian post-socialist migrations have been put into focus by Avirović (2012). However, the recent explorations of
strictly demographic migrations on a national level have been carried out
by Joveski (2012), and Trajkova and Andonov (2012). In addition, the demo -graphic changes in the Republic of Macedonia, caused by professional and social migrations, known as “social mobility”, have been elaborated by the recent work of Cacanoska and Slaninka-Dineva (2012).
Most of the recent research has also been focused on treating
since it is closely related to the current problem of the high unemployment
rate in the Republic of Macedonia. For instance, significant contributions in this area have recently been given by Popovski and Tosheva (2012), Bej
-zaroski (2012), Nikolovski, Žibak and Nikolovska (2012), as well as Janeska
(2013). The global dimensions of international economic migrations with special emphasis on the immigration situation in the Republic of Macedonia have been elaborated by Chudoska-Blazevska, Maliciand Zununi (2012).
Besides these, some domestic researchers have focused on investigating
regional/local migrations within the country, including Gjurovski (2012),
Abdulai, Durmishi and Kadrius(2012), and Klopchevska (2012). In this con -text, Vchkov (2012) has explored the phenomenon of daily mobility in the Republic of Macedonia, with special emphasis on its incidence in the Mu-nicipality of Veles.
The effort of Ivanovska and Jovcheska (2012), who have investigated the
relationship between education, unemployment, and migrations in the Re-public of Macedonia, is also worth mentioning, focusing as it does on the phenomenon of “brain drain” and proposing measures for its replacement with the trend of a “brain exchange”.
STATISTICAL ANALYSIS OF THE POPULATION MIGRATION
Migratory movements in the Republic of Macedonia have been
expre-ssed through the total number of immigrants and emigrants flowing in/
from the country, along with all of their modalities, observed in statistical regions (Figure 1), for 2000 and 2011. Table 1 has been obtained by
sublima-ting relevant statistical data about immigrants inflowing to the Republic of Macedonia (2000/2011).
Figure 1. Statistical regions within the Republic of Macedonia
Table 1. Total number of immigrants in the Republic of Macedonia, by
statistical regions (2000/2011) Statistical regions Total number of immigrants in the Republic of Macedonia 2000 2011 Pelagonia region 1,118 1,100 Vardar region 702 616 North-east region 988 597 South-west region 1,127 1,088 Skopje region 6,022 2,014 South-east region 969 754 Polog region 1,076 908 East region 1,056 884 TOTAL 13,058 7,961
Table 2. Total number of immigrants within the Republic of
Macedonia, by statistical regions (2000/2011)
Statistical regions
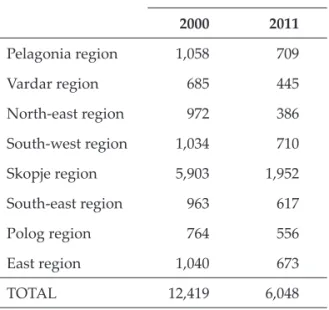
Total number of immigrants within the Republic of Macedonia 2000 2011 Pelagonia region 1,058 709 Vardar region 685 445 North-east region 972 386 South-west region 1,034 710 Skopje region 5,903 1,952 South-east region 963 617 Polog region 764 556 East region 1,040 673 TOTAL 12,419 6,048
Table 1 shows that the total number of immigrants in the Republic of
Macedonia in 2011 has been 1.64 times (39%) less than the corresponding one in 2000 (Statistical Yearbook of the Republic of Macedonia, 2001: 90−95, 102−104; 2012: 102−105). The decreasing trend has been the most distinctive
in the Skopje region (the number of immigrants in 2011 has decreased by almost 3 times or 66.55%, in comparison to 2000) whilst the smallest
decre-ase has been observed in the Pelagonia region (the number of immigrants
in 2011 has decreased about 1.6% in comparison to 2000). One should also mention that the total number of immigrants within the Republic of Mace-donia in 2011 has decreased by 51.3% compared to 2000, which is more than
2 times (Statistical Yearbook of the Republic of Macedonia, 2001: 84−89).
Such a decrease is evident for all statistical regions within the country. The analysis of the sublimated data has shown that the number of immigrants
in the Republic of Macedonia from abroad has decreased by 45.38% in 2011, compared to 2000. The decrease is most evident in the Polog region (80.12%
or almost 5 times). Considerable decreases are also obvious in the Skopje re-gion, the South-west rere-gion, the East rere-gion, as well as in the Vardar region.
the number of immigrants from foreign countries of 72.72% or 3.67 times in 2011, compared to 2000.
In the Republic of Macedonia, the number of immigrated persons within
the country in 2011 has decreased by more than 2 times, compared to 2000. The decreasing trend is obvious in all statistical regions. From 2000 to 2011
the most prevalent relative decrease of the immigrants’ flows within the
country is noticeable in the Skopje region (66.93%), and in the North-east
region (60.29%), as well. The smallest decrease of the immigrants’ flows within the country is evident in the Pelagonia and Polog regions (Table 2).
The conclusions drawn from the statistical analysis of the data presented in Table 3 have indicated that the total number of emigrants in the Republic of Macedonia in 2011 has decreased by 29.73% in comparison to 2000. This is most evident in the Skopje region, where the decrease is 73.38% or 3.75 times. Such a decreasing trend is also evident in the East region, South-east
region, North-east region, the Vardar region, as well as in the Pelagonia region. However, this is not the case with the South-west and the Polog re
-gion, where an increase in the number of emigrants by 82.31% and 18.49%
has been observed, respectively.
Table 3. Total number of emigrants in the Republic of Macedonia, by
statistical regions (2000/2011) Statistical regions Total number of emigrants in the Republic of Macedonia 2000 2011 Pelagonia region 1,107 1,044 Vardar region 774 689 North-east region 1,166 737 South-west region 1,080 1,969 Skopje region 5,320 1,416 South-east region 1,071 761 Polog region 833 987 East region 1,233 1,152 TOTAL 12,584 8,755
Table 4. Total number of emigrants from the Republic of Macedonia in foreign countries, by statistical regions (2000/2011)
Statistical regions
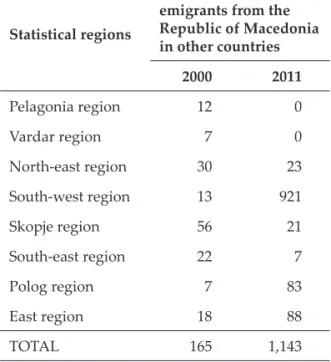
Total number of emigrants from the Republic of Macedonia in other countries 2000 2011 Pelagonia region 12 0 Vardar region 7 0 North-east region 30 23 South-west region 13 921 Skopje region 56 21 South-east region 22 7 Polog region 7 83 East region 18 88 TOTAL 165 1,143
Table 4 shows that the total number of emigrants from the Republic of
Macedonia in foreign countries in 2011 has increased 7 times, relatively
to 2000 (Statistical Yearbook of the Republic of Macedonia, 2001: 96−101, 105−107; 2012: 106−109). The increase is most obvious in the East and South-west regions, as well as in the Polog region. Notwithstanding, the number
of citizens from the Republic of Macedonia who have emigrated abroad in 2011 has decreased by 62.5% in the Skopje region, as compared to 2000.
It should be also pointed out that in 2011 all statistical regions were fa -cing a considerable decrease in the number of emigrated persons, bearing in mind the investigated modalities in the age structure, in relation to 2000. STATISTICAL INDICATORS OF THE POPULATION
MIGRATION
Based on the data available about the population size (number of inhabi-tants), the number of emigrants, as well as the number of immigrants in the Republic of Macedonia, which are given by statistical regions and for the
statistical indicators: the migration balance, the rate of immigrants, and the rate of emigrants (Table 5, Figure 2), using the proposed metrics.
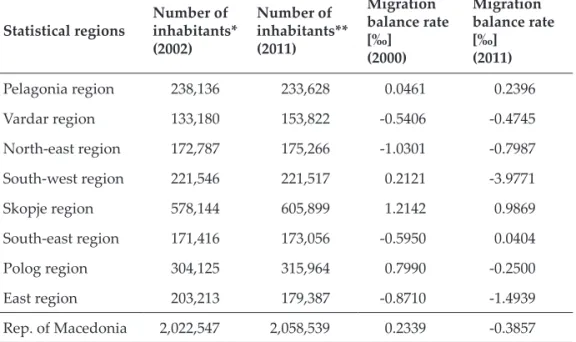
In the observed time period, the number of inhabitants has decreased only in the East region, by 11.73%. Also, an insignificant decrease in the
number of inhabitants is evident in the South-west region. All other regions in the country faced an increased number of inhabitants from 2002 to 2011.
The most significant increase in the number of inhabitants (15.5%) is evi
-dent in the Vardar region. In the observed time period, the population size
in the Republic of Macedonia has grown by 1.78% in total.
Table 5. Migration balance rates, by statistical regions (2000/2011)
Statistical regions Number of inhabitants* (2002) Number of inhabitants** (2011) Migration balance rate [‰] (2000) Migration balance rate [‰] (2011) Pelagonia region 238,136 233,628 0.0461 0.2396 Vardar region 133,180 153,822 -0.5406 -0.4745 North-east region 172,787 175,266 -1.0301 -0.7987 South-west region 221,546 221,517 0.2121 -3.9771 Skopje region 578,144 605,899 1.2142 0.9869 South-east region 171,416 173,056 -0.5950 0.0404 Polog region 304,125 315,964 0.7990 -0.2500 East region 203,213 179,387 -0.8710 -1.4939 Rep. of Macedonia 2,022,547 2,058,539 0.2339 -0.3857
* There is no data for the number of inhabitants by statistical regions for the year 2000 in the Statistical Yearbook of the Republic of Macedonia: 2000 (2001); therefore, we approximate these by the 2002 figures, given in the Номенклатура на територијални единици за статистика на Република Македонија (2005), by assuming that there is no significant difference.
** The numeric values of data have been estimated according to Регионите во Република Македонија, 2012 / Regions of the Republic of Macedonia, 2012 (2012): 93−107, since the 2011 population census has been cancelled due to uncertain reasons, which have not been clarified to date.
Figure 2. Migration balance rates in the Republic of Macedonia, by
statistical regions (2000/2011)
In 2000, the number of immigrants in the Republic of Macedonia was
3.63% higher than the number of the emigrants, thus yielding a positive migration balance rate.
According to Table 5, the number of emigrants in the Vardar region in 2000, as well as in the North-east, South-east and the East region, is higher
than the number of immigrants, thus putting them into the class of emigra
-tion areas. On the other hand, the Pelagonia region has a balanced migra
-tion rate, whilst the South-west region, the Skopje region, and the Polog
region belong to immigration areas (the number of immigrants is higher than the number of emigrants), since their corresponding migration balance rates are, respectively, 0.98%, 11.66% and 22.58%.
In 2011, the relative increase in the total number of emigrants in the Re -public of Macedonia against the total number of immigrants was 9.07%, thus yielding a negative migration balance rate (Table 5).
In the Vardar region, the North-east region, the South-west region (44.74%), the Polog region, as well as in the East region (23.26%), the num -ber of emigrants is higher than the num-ber of immigrants, whilst in the
Sko-pje region (29.69%), the South-east, and in the Pelagonia region, the number
of immigrants is higher than the number of emigrants. The South-west
and the Pelagonia region remain immigration areas, whilst the South-east region and the Polog region transit from immigration to emigration areas
and vice-versa.
The migration balance rate value in the Republic of Macedonia in the observed time period has changed from a positive one (+0,2339�) to a ne-gative one (-0,3857�), which means that more people emigrate than immi-grate.
The Pelagonia region and the Skopje region have continuously retained
positive values of the migration balance rates, despite the evident decrease
of the rate’s value in the Skopje region and its increase in the Pelagonia
region.
On the other hand, the Vardar region, the North-east region, the South-east region and the East region have continuously retained negative values
of the migration balance rates. An insignificant increase in the migration ba -lance rate’s negative value has been observed in the East region, whilst the
increase in the other regions’ migration balance rates is rather significant. A shift from a positive to a statistically significant negative value of the migration balance rate has been detected for the South-west and the Polog
regions.
In 2000, the highest positive value of the migration balance rate has been
detected in the Skopje region, whilst the highest negative value has been
observed in the North-east region. In 2011, the highest positive value of the
migration balance rate has been detected again in the Skopje region, whilst the highest negative values have been observed in the South-west and the East regions.
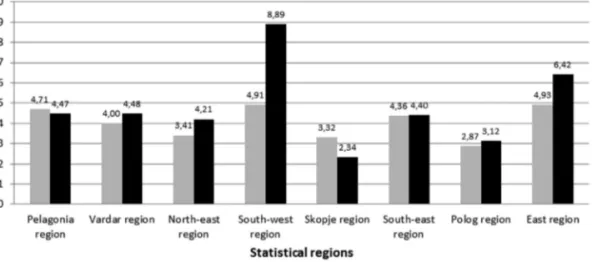
In 2000, the immigration rate’s value was higher than the emigration one (Figures 3 and 4). The highest values of the immigration rate have been de
-tected in the Skopje region (10.416‰), the South-east region (5.6529‰), as
well as in the North-east region (5.518�), whilst its lowest value (3.5380�)
is specific for the Polog region.
The highest values of the emigration rate have been detected in the
Sko-pje region (9.2018‰), the North-east region (6.7481‰), as well as in the South-east region (6.2479‰), whilst its lowest value (2.7390‰) is specific, again, for the Polog region.
In 2011, the emigrant rate within the Republic of Macedonia had higher value (4.253‰) than the immigrant rate (3.8673‰), which is not the case as
with 2000.
on, whilst the highest emigrant rate values are evident for the South-west (8.8887�), the East and the Vardar regions.
In 2011, there was a significant decline of these two measures’ rates for
the South-west, the East, and the North-east regions, where the values of the emigration rates are higher than those corresponding to the
immigra-tion rates. Only the Pelagonia region, along with the Skopje region, had a
higher immigration rate compared to the corresponding emigration rate.
Figure 3. Immigration and emigration rates in the Republic of Macedonia,
by statistical regions, in 2000
Figure 4. Immigration and emigration rates in the Republic of Macedonia,
If the available migration movements data, encompassing the migrati
-ons from/to Republic of Macedonia from 2003 to 2011, is to be statistically
analyzed and presented (Table 6, Figure 5), the following conclusions can
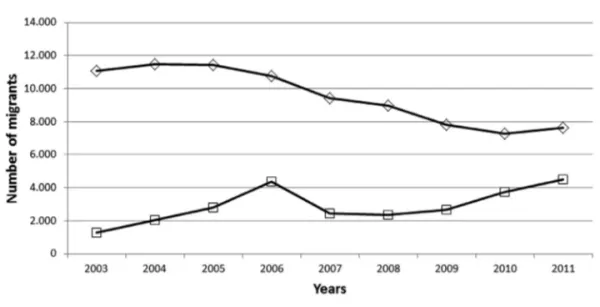
be drawn: from 2004 to 2010, there is a continuous decrease of the internal
migrations’ intensity, except in the period from 2010 to 2011, when it shows an upward trend.
From 2003 to 2011, there was a continuous increase in the external
mi-gration intensity, which is both more evident and significant from 2003 to
2006. A decrease follows from 2006 to 2008, and afterwards there was a con-tinuous increase in the external migrations number until 2011.
Table 6. Migration movement indicators for the Republic of Macedonia
(2003 − 2011) Year Population size in the middle of the year* Internal
migration External migration Migration balance
Migration balance rate [‰] 2003 2,027,000 11,058 1,289 1,001 0.4938 2004 2,032,000 11,495 2,050 712 0.3503 2005 2,037,000 11,411 2,791 191 0.0937 2006 2,040,000 10,740 4,381 2,165 1.0612 2007 2,044,000 9,438 2,421 1,941 0.9496 2008 2,047,000 8,964 2,360 858 0.4191 2009 2,051,000 7,785 2,649 1,065 0.5192 2010 2,055,000 7,276 3,722 1,708 0.8311 2011 2,059,000 7,612 4,501 1,921 0.9329
* The estimates have been carried out on the basis of the total population, according to the 2002 population census data (Statistical Yearbook of the Republic of Macedonia: 2011, 2012: 72)
Sources: Миграции, 2007 / Migrations, 2007 (2008), Скопје, Државен завод за статистика на Република Македонија / Skopje, State statistical office of the Repub
-lic of Macedonia; Миграции, 2009 / Migrations, 2009 (2010), Скопје, Државен завод за статистика на Република Македонија / Skopje, State statistical office of the Repub
-lic of Macedonia; Миграции, 2010 / Migrations, 2010 (2011), Скопје, Државен завод за статистика на Република Македонија / Skopje, State statistical office of the Repub
-lic of Macedonia; Миграции, 2011 / Migrations, 2011 (2012), Скопје, Државен завод за статистика на Република Македонија / Skopje, State statistical office of the Republic of Macedonia.
Figure 5. Internal and external migrations in the Republic of Macedonia (2003 − 2011)
If time series that correspond to internal and external migrations are
analyzed, the following statistical indicators, as well as conclusions can be drawn:
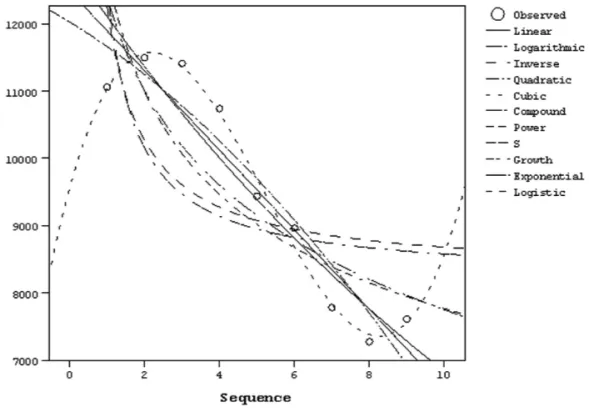
– The time series data that cover internal migrations in the Republic of Mace
-donia from 2003 to 2011 can be approximated most accurately by the cubic trend model (1), since it has the highest value of the coefficient of determi
-nation (0.992) among other presented theoretical models; Equation (1) can be utilized for predicting the values of internal migrations in the forthcoming years; The cubic trend approximation can be seen on Figure 6, based on the model summary depicted by Table 6.
2 3
ˆ 9560.365 2021.877
585.787
37.383
1, 2, ...,
iy
x
x
x
i
n
=
+
⋅ -
⋅ +
⋅
=
(1)Figure 6. Choosing the best fit approximation trend for the internal migrations in the Republic of Macedonia (2003 − 2011)
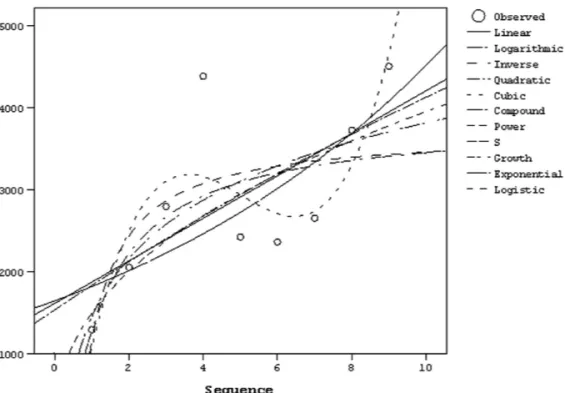
– The time series data that cover external migrations in the Republic of Ma
-cedonia from 2003 to 2011 can be also approximated most accurately by the cubic trend model (2), since it has the highest value of the coefficient of determination (0.739) among all other presented theoretical models; Equati
-on (2) can be utilized for predicting the values of external migrati-ons in the forthcoming years; The cubic trend approximation can be seen on Figure 7, based on the model summary depicted by Table 6.
2 3
ˆ
1430.151 3138.182
677.310
44.864
1, 2, ...,
iy
x
x
x
i
n
= -
+
⋅ -
⋅ +
⋅
=
(2)Figure 7. Choosing the best fit approximation trend for the external migrations in the Republic of Macedonia (2003 − 2011)
Taking into account the interaction between population migrations and economic factors, a plethora of regression models can be developed, be-aring in mind that immigration and emigration rates are both dependent variables, whilst independent variables are the indicators of the regional
development of the Republic of Macedonia, taken by different statistical regions, including the following ones: the Unemployment Rate, GDP per
capita, Average Net Wage per employee, as well as Gross Fixed Capital For-mation (Table 7).
Table 7. Regional development indicators for the Republic of Macedonia, by statistical regions
Statistical regions Unemployment rate [%] (2011) GDP per capita [US$] (2010) Net wage per employee [MKD] (2011) Gross fixed capital formation [MKD] in millions (2010) Pelagonia region 31.4 225,437 19,312 6,295 Vardar region 36.4 206,667 16,125 5,066 North-east region 59.6 108,664 17,009 2,150 South-west region 42.8 155,572 18,499 3,889 Skopje region 30.7 314,809 24,693 45,323 South-east region 9.3 219,714 16,169 5,773 Polog region 31.8 98,848 19,784 6,518 East region 16.4 206,770 15,131 7,953
Rep. of Macedonia Average: 32.3 Average: 192,060 Average: 18,340 Total: 82,967
Sources: Регионите во Република Македонија, 2012 / Regions of the Republic of Mace� Регионите во Република Македонија, 2012 / Regions of the Republic of Mace
-donia, 2012 (2012), Скопје / Skopje, Државен завод за статистика на Република Македонија / State Statistical Office of the Republic of Macedonia.
Linear regression model #1: Using the Immigration Rate as a dependent variable
Based on partial correlation analysis, it is evident that there is a strong positive correlation between the Gross Fixed Capital Formation and:
– Average Net Wage per employee (0.829);
– GDP per capita (0.744).
There is a moderate negative correlation between the Immigration Rate
and:
– Gross Fixed Capital Formation (-0.345);
It can be also noted that there is a very weak correlation between GDP per capita and the Immigration Rate values.
The equation of the regression model that encompasses the previously
defined economic factors and statistical regions can be specified using the values of the regression coefficients (Table 8). It can then be used for esti
-mating the value of the Immigration Rate for various values of the indepen -dent variables (the Unemployment Rate, Gross Fixed Capital Formation,
the Average Net Wage per employee, and GDP per capita).
Table 8. Regression coefficients for the linear regression model #1
Model*
Unstandardized
Coefficients Standardized Coefficients t Sig.
B Std. Error Beta
1 (Constant) 2.206 3.789 .582 .601
Unemployment
rate .001 .023 .023 .052 .962
GDP per capita 1.241E-005 .000 1.101 1.627 .202 Net wage per
employee 6.323E-006 .000 .024 .033 .976
Gross fixed
capital formation -6.553E-005 .000 -1.181 -1.203 .315
* Dependent Variable: Immigration rate
The value of the multiple linear correlation coefficient, R=0.794, shows
that the correlation between the Unemployment rate, Gross Fixed Capital
Formation, the Average Net Wage per employee, GDP per capita, and the Immigration Rate is statistically significant.
The value of the coefficient of multiple linear determination, R2=0.630,
shows that 63% of the Immigration Rate variability emerges as a result of
the variability of the Unemployment Rate, Gross Fixed Capital Formation,
the Average Net Wage per employee, and GDP per capita, whilst 37% of the Immigration Rate variability is due to other factors and random variations
that are not taken into account by the regression model.
For
υ
1=5-1=4 andυ
2=9-5=4 degrees of freedom, the theoretical value ofthe F statistics,
F
t=6.39.Since the empirical value of the F statistics (1.279) is less than the corres-ponding theoretical value (6.39), and taking into account an error margin of 5%, it can be concluded that the Unemployment Rate, the Gross Fixed
Ca-pital Formation, the Average Net Wage per employee, and GDP per capita do not differ in their impact on the Immigration Rate.
Linear regression model #2: Using the Emigration Rate as a dependent variable
The values of the partial correlation coefficients imply that there is a
strong positive correlation between Gross Fixed Capital Formation and: – Average Net Wage per employee (0.829);
– GDP per capita (0.744).
On the other hand, there is a moderate negative correlation between the Emigration Rate and:
– Gross Fixed Capital Formation (-0.495);
– Average Net Wage per employee (-0.474).
It can be also observed that there is a weak correlation among GDP per
capita, the Unemployment Rate, and the Emigration Rate.
Again, the equation of the regression model that encompasses the
previ-ously defined economic factors and statistical regions can be specified using the values of the regression coefficients (Table 9). It then can be used for esti -mating the value of the Emigration Rate for various values of the indepen-dent variables (the Unemployment Rate, Gross Fixed Capital Formation,
the Average Net Wage per employee, and GDP per capita).
Table 9. Regression coefficients for the linear regression model #2
Model*
Unstandardized
Coefficients Standardized Coefficients t Sig.
B Std. Error Beta
1 (Constant) 4.626 13.491 .343 .754
Unemployment
rate .021 .082 .159 .258 .813
GDP per capita 1.014E-005 .000 .349 .373 .734
Net wage per
employee -8.359E-005 .001 -.125 -.121 .911
Gross fixed capital
formation -8.972E-005 .000 -.628 -.463 .675
The value of the multiple linear correlation coefficient, R=0.541, shows
that the correlation between the Emigration Rate and the Unemployment Rate, Gross Fixed Capital Formation, the Average Net Wage per employee,
and GDP per capita is significant.
The value of the multiple linear determination coefficient, R2=0.293, im
-plies that 29.3% of the Emigration Rate’s variations exist as a result of the variations in the Unemployment Rate, Gross Fixed Capital Formation, the
Average Net Wage per employee, and GDP per capita, whilst 70.7% of the
Emigration Rate’s variations are due to other factors and uncertainties that have not been taken into account within the regression model.
For
υ
1=5-1=4 andυ
2=9-5=4 degrees of freedom, the theoretical value ofthe F statistics,
F
t=6.39.Since the empirical value of the F statistics (0.311) is less than the corres-ponding theoretical value (6.39), and taking into account an error margin of 5%, it can be concluded that the Unemployment Rate, Gross Fixed Capital
Formation, the Average Net Wage per employee, and GDP per capita do not differ in their impact on the Emigration Rate. Even though their impact is statistically significant, it is not crucial or decisive for the values of the Emi -gration Rate. To be more precise, there are other factors that are not
inclu-ded in the model, being more significant in determination of the variability
of the Emigration Rate.
STATISTICAL INFERENCES ABOUT THE POPULATION MIGRATION
Based on the previously determined indicators about the population mi-gration in the Republic of Macedonia, given by statistical regions and in the
observed time period, the following statistical hypotheses can be defined:
Hypothesis #1:
– There were no significant differences in the values of the Immigration and Emigration Rates in 2000, among different statistical regions; and,
– There were no significant differences in the values of the Immigration and Emigration Rates in 2000, within each statistical region.
The usage of the parametric ANOVA statistical test (Groebner et al., 2005:
429−439) results in the following conclusions:
– There is a statistically significant difference in the values of the Immigration and Emigration Rates in 2000 between the different statistical regions, since
the computed value of the F statistics (20.390) is much higher than the theo
-retical one, F crit (3.787); Alternatively, one can accept the null hypothesis, since the P-value of 0.000 is smaller than the error margin of 5% (Table 10);
– There is no statistically significant difference in the values of the Immigra
-tion and Emigra-tion Rates in 2000, within each statistical region, since the computed value of the F statistics (0.164) is much lower than the theoretical one, F crit (5.591); Alternatively, one can reject the null hypothesis since the
P-value of 0.697 is higher than the error margin of 5% (Table 10).
Table 10. Two-factor ANOVA without replication: Immigration and Emigration Rates (2000) / Statistical regions
Source of
Variation SS df MS F P-value F crit
Rows 50.582 7 7.226 20.390 0.000 3.787
Columns 0.058 1 0.058 0.1643 0.697 5.591
Error 2.481 7 0.354
Total 53.121 15
Hypothesis #2:
– There are no significant differences in the values of the Immigration and Emigration rates in 2011, between different statistical regions; and,
– There are no significant differences in the values of the Immigration and Emigration Rates in 2011, within each statistical region.
The usage of the parametric ANOVA statistical test results in the fo-llowing conclusions:
– There was no statistically significant difference in the values of the Immigra
-tion and Emigra-tion Rates in 2011, between different statistical regions, sin
-ce the computed value of the F statistics (3.220) is lower than the theoretical one, F crit (3.787); Alternatively, one can reject the null hypothesis since the
P-value of 0.073 is higher than the error margin of 5% (Table 11);
-computed value of the F statistics (1.869) is lower than the theoretical one, F crit (5.591); Alternatively, one can reject the null hypothesis since the P-va-lue of 0.214 is higher than the error margin of 5% (Table 11).
Table 11. Two-factor ANOVA without replication: Immigration and Emigration Rates (2011) / Statistical regions
Source of
Variation SS df MS F P-value F crit
Rows 25.422 7 3.632 3.220 0.073 3.787
Columns 2.109 1 2.109 1.869 0.214 5.591
Error 7.896 7 1.128
Total 35.427 15
Hypothesis #3:
– There are no statistically significant differences between the values of the Immigration rate for 2000 and 2011 between the different statistical regions; and,
– There are no statistically significant differences between the values of the Immigration rate for 2000 and 2011, within each statistical region.
By employing the ANOVA parametric test, the following statistical con-clusions can be drawn:
– There is no statistically significant difference between the values of the Im
-migration rate for 2000 and 2011 between the different statistical regions, since the computed value of the F statistics (0.748) is lower than the theo
-retical one, F crit (3.787); Alternatively, one can reject the null hypothesis since the P-value of 0.644 is higher than the error margin of 5% (Table 12);
– There is no statistically significant difference between the values of the Im
-migration Rate for 2000 and 2011 within each statistical region, since the computed value of the F statistics (3.818) is lower than the theoretical one, F crit (5.591); Alternatively, one can reject the null hypothesis since the P-va-lue of 0.092 is higher than the error margin of 5% (Table 12).
Table 12. Two-factor ANOVA without replication: Immigration Rate (2000 and 2011) / Statistical regions
Source of
Variation SS df MS F P-value F crit
Rows 14.179 7 2.026 0.748 0.644 3.787
Columns 10.338 1 10.338 3.818 0.092 5.591
Error 18.954 7 2.709
Total 43.472 15
Hypothesis #4:
– There are no statistically significant differences between the values of the Emigration Rate for 2000 and 2011 between the different statistical regions; and,
– There are no statistically significant differences between the values of the Emigration Rate for 2000 and 2011 within each statistical region.
By employing the ANOVA parametric test, the following statistical con-clusions can be drawn:
– There is no statistically significant difference between the values of the Emi
-gration Rate for 2000 and 2011 between different statistical regions, since the computed value of the F statistics (0.585) is lower than the theoretical one, F crit (3.787); Alternatively, one can reject the null hypothesis since the
P-value of 0.752 is higher than the error margin of 5% (Table 13);
– There is no statistically significant difference between the values of the Emi
-gration Rate for 2000 and 2011 within each statistical region, since the com
-puted value of the F statistics (0.837) is lower than the theoretical one, F crit
(5.591); Alternatively, one can reject the null hypothesis since the P-value of 0.391 is higher than the error margin of 5% (Table 13).
Table 13. Two-factor ANOVA without replication: Emigration Rate (2000
and 2011) / Statistical regions
Source of
Variation SS df MS F P-value F crit
Rows 19.660 7 2.808 0.585 0.752 3.787
Columns 4.018 1 4.018 0.837 0.391 5.591
Error 33.587 7 4.798
Total 57.264 15
CONCLUSIONS
The population migration flows in the Republic of Macedonia, being ob
-served and analyzed by statistical regions in the specified period from 2000 to 2011, are continuous and varying processes, which have a significant im -pact on the further demographic image, structure and development of the
country. This assumption can be confirmed by the declining immigration
rate, i.e. the decrease of the total number of immigrants in the country. The beginning of the 21st century in the Republic of Macedonia is also
charac-terized by an evident decrease in the total number of emigrants within the country, being evident in all statistical regions. Quite the opposite, a
sig-nificant increase in the total number of emigrant inhabitants towards third
countries has been recorded for the same time period, i.e. the emigration rate is continuously rising. As a direct consequence of such trends, the mi-gration balance rate transforms from a positive to a negative one, meaning
that more inhabitants have emigrated than have immigrated from/into the
country in this period of time.
The analysis of the internal migrations time series for the observed time period shows that there is an obvious continuous decrease, whilst the one corresponding to the external migrations generally exhibits an increasing tendency. Both time series trends can be approximated in a most appropri-ate way by a cubic model, as a basis for predicting future expected values
for both the internal and external migration flows.
Many socio-economic phenomena are thought to be causes for such immigration and emigration rates in the country, including the following ones: Gross Fixed Capital Formation, the Average Net Wage per employee,
confirms that all of these are negatively correlated to the Immigration and Emigration Rates. In addition, all of these have a more significant impact on the Immigration Rate than on the Emigration Rate.
Our statistical analyses also show that there are no statistically signifi
-cant differences in the values of both the Immigration Rates and the Emi -gration Rates for all statistical regions within the country, for the compared time periods. An identical conclusion can be drawn for the structure of the immigrants regarding their gender, marital status, age, ethnicity and the reasons for immigration.
All these findings confirm and point to the necessity of continuous acqui -sition, arranging, analyzing, and assessment of relevant data about
migra-tion flows from/to and within the country, which already faces abundant
problems and challenges regarding the population economic and social discrepancies, and undesirable demographic trends in the last decade. A further persistent study of the volume, dynamics, and types of migrations,
leading towards creating annual migration profiles of the country, will have immense significance in planning demographic and socio-economic
progress on a national level, which can facilitate the consistent implementa-tion of the Naimplementa-tional Strategy for sustainable demographic development of the Republic of Macedonia and other vital strategic documents. However, the accomplishment of these goals relies on several key premises, including: (1) design, implementation, and maintenance of a unique national
statisti-cal database about migrants and migration flows, (2) better coordination
and more intensive collaboration between authorities and all relevant gov-ernmental institutions, bodies, organizations, groups and associations, as well as (3) wider and more substantial support to all research institutions, academia and individuals treating the issue of migrations in the Republic of Macedonia.
REFERENCES
Abdulai, J., Durmishi, I. and Kadrius, B. (2012). The Social Changes and the Migration
from the Gostivar Region to the Western Countries, International Scientific Conference “Migration and Labour Market”, Krushevo, October 19–20, 2012.
Allen, P. and Bennett, K. (2012). SPSS Statistics: A Practical Guide, Version 20. 2nd ed. South Melbourne: Cengage Learning.
Avirović, I. (2012). Macedonian Post-Socialist Migration, Conference “(In�)Equality – Political, Economic, Social, Gender and Spatial Aspects”,Vienna, December 6–8, 2012.
Bornarova, S. and Janeska, V. (2012). Social Impact of Emigration and Rural�Urban Migration in Central and Eastern Europe: Final Country Report – The Former Yugoslav Republic of Macedonia. European Commission, DG Employment, Social Affairs and Inclusion –
GVG.
Бубевски, Д. (2001). Некои аспекти на социо-економската структура и проблеми на населението во Република Македонија [Some Aspects of the Socio-Economic Structure and Problems of the Population in the Republic of Macedonia], in: J.
Jakimovski et al. (eds). Социо�економска структура и проблеми на населението во Република Македонија. Скопје: Институт за социолошки и политичко-правни истражувања, 21−23.
Cacanoska, R. and Slaninka-Dineva, M. (2012). Migration and Demographic Changes,
International Scientific Conference “Migration and Labour Market”,Krushevo, October
19−20, 2012.
Chudoska-Blazevska, I., Malici, N. and Zununi, Z. (2012). International Economic Immigration as a Global Phenomenon, International Scientific Conference “Migration and Labour Market”,Krushevo, October 19−20, 2012.
Gjurovski, S. (2012). Migration of Population in Mariovo Region, International Scientific Conference “Migration and Labour Market”, Krushevo, October 19−20, 2012.
Groebner, D. F., Shannon, W. P., Fry, C. P. and Smith, D. K. (2005). Business Statistics: A Decision�making Approach. Upper Saddle River: Pearson Education International. Ivanovska, M. and Jovcheska, S. (2012). The Educated Unemployment and the
Emigration – Review of the Situation in Macedonia, International Scientific Conference “Migration and Labour Market”, Krushevo, October 19−20, 2012.
Јакимовски, Ј. (2007). Демографски движења и структура на населението во
регионот на Скопје �Demographic Trends and Population Structure in the Region
of Skopje�, in: Актуелните демографски движења во Република Македонија во светлоста на резултатите на пописот на населенето во 2002 година : прилози од научниот собир одржан на 2 и 3 јуни 2005 година во Скопје / Actual Demographic Trends in the Republic of Macedonia in the light of the Results of the Population Census in 2002: proceedings of a scientific meeting held on 2nd and 3rd June 2005 in Skopje. Скопје: Македонска академија на науките и уметностите, 127–141.
Janeska, V. (2013). Labor Market and Labor Migration in the Republic of Macedonia,
6th IZA/ASE Workshop on EU Enlargement and the Labor Markets, Bucharest, 25−26
November 2013.
Јанеска, В. and Ивановска, А. (2007). Преселничките движења во Република Македонија во периодот на транзиција [Migratory Movements in the Republic of Macedonia in the Period of Transition], in: Актуелните демографски движења во Република Македонија во светлоста на резултатите на пописот на населенето во 2002 година: прилози од научниот собир одржан на 2 и 3 јуни 2005 година во Скопје / Actual Demographic Trends in the Republic of Macedonia in the light of the Results of the Population Census in 2002: proceedings of a scientific meeting held on 2nd and 3rd June 2005 in Skopje. Скопје: Македонска академија на науките и уметностите, 211−234. Joveski, Z. B. (2012). Forms of Illegal and Forced Migration in the Republic of Macedonia,
Security Dialogues, 3 (2): 59−74.
Kirkpatrick, L. A. and Feeney, B. C. (2012). A Simple Guide to IBM SPSS® Statistics: for Version 20.0. 12th ed. Belmont CA: Wadsworth Cengage Learning.
Кљусев, Н. (2007). Актуелните демографски движења во Република Македонија
�Actual Demographic Movements in the Republic of Macedonia�, in: Актуелните демографски движења во Република Македонија во светлоста на резултатите на пописот на населенето во 2002 година: прилози од научниот собир одржан на 2 и 3 јуни 2005 година во Скопје / Actual Demographic Trends in the Republic of Macedonia in the light of the Results of the Population Census in 2002: proceedings of a scientific meeting held on 2nd and 3rd June 2005 in Skopje. Скопје: Македонска академија на науките и уметностите, 15–27.
Klopchevska, V. (2012). The Socio-Economic Position and the Migration of the Roma Population in the Municipality of Debar, International Scientific Conference “Migration and Labour Market”,Krushevo, October 19−20, 2012.
Kranzler, J. H. (2007). Statistics for the Terrified. 4th ed. Upper Saddle River: Prentice Hall.
Mиткoвскa, И. (2014). Се раѓа третата генерација Македонци надвор од татковината: од Македонија ќе наследат само пасош и право да гласаат �A Third Generation of Macedonians is being born outside the fatherland: from Macedonia they will inherit only a passport and a right to vote�, Слободен печат, Скопје, 05. 05. 2014.
Nikolovski, M., Žibak, M. and Nikolovska, F. (2012). Illegal Migration and Illegal
Competition on the Labour Market, International Scientific Conference “Migration and Labour Market”,Krushevo, October 19−20, 2012.
HTEC − Номенклатура на територијални единици за статистика на Република Македонија [Nomenclature of Territorial Units for Statistics of the Republic of Macedonia], (2005). Скопје: Државен завод за статистика на Република Македонија.
НТЕС − Номенклатурата на територијални единици за статистика на Република Македонија [Nomenclature of Territorial Units for Statistics of the Republic of
Macedonia�, Службен весник на РМ, no. 158/2007.
Popovski, V. and Tosheva, E. (2012). Migratory Movements in the Republic of Macedonia and Labour Market: Implications for the Regional Economic Development,
International Scientific Conference “Migration and Labour Market”, Krushevo, October
19−20, 2012.
Регионите во Република Македонија, 2012 / Regions of the Republic of Macedonia, 2012
(2012). Скопје / Skopje: Државен завод за статистика на Република Македонија / State Statistical Office of the Republic of Macedonia, http://www.stat.gov.mk/ Publikacii/Regioni2012.pdf (7 May 2014).
Resolution on Migration policy of Republic of Macedonia: 2009−2014 (2008). Skopje: Government of the Republic of Macedonia, http://www.marri-rc.org/upload/ Documents/MKD%20M%20R%202009-2014.pdf (7 May 2014).
Сотироски, K. (2004). Статистика �Statistics�. Прилеп: Економски факултет.
Стратегија за демографски развој на Република Македонија: 2008 – 2015 �Strategy for a Demographic Development of the Republic of Macedonia: 2008 – 2015]. Ckoпje: Министерството за труд и социјална политика.
Талевски, J. Д. (2007). Значајни карактеристики на миграциониот биланс [Important
Characteristics of Migration Balance�, in: Актуелните демографски движења во Република Македонија во светлоста на резултатите на пописот на населенето во 2002 година: прилози од научниот собир одржан на 2 и 3 јуни 2005 година во Скопје / Actual Demographic Trends in the Republic of Macedonia in the light of the Results of the
Trajkova, K. and Andonov, M. (2012). Aspects in the Internal Migrations in the Republic of Macedonia with a Special Emphasis on Their Influence over the Demographic and
the Economic Development, International Scientific Conference “Migration and Labour Market”,Krushevo, October 19−20, 2012.
Vchkov, Lj. (2012). Migration and the Standard of Life of the Population, International Scientific Conference “Migration and Labour Market”,Krushevo, October 19−20, 2012. SOURCES
Миграции, 2007 / Migrations, 2007 (2008). Скопје: Државен завод за статистика на Република Македонија / Skopje: State statistical office of the Republic of Macedonia.
Миграции, 2008 / Migrations, 2008 (2009). Скопје: Државен завод за статистика на Република Македонија / Skopje: State statistical office of the Republic of Macedonia.
Миграции, 2009 / Migrations, 2009 (2010). Скопје: Државен завод за статистика на Република Македонија / Skopje: State statistical office of the Republic of Macedonia.
Миграции, 2010 / Migrations, 2010 (2011). Скопје: Државен завод за статистика на Република Македонија / Skopje: State statistical office of the Republic of Macedonia.
Миграции, 2011 / Migrations, 2011 (2012). Скопје: Државен завод за статистика на Република Македонија / Skopje: State statistical office of the Republic of Macedonia.
Statistical Yearbook of the Republic of Macedonia: 2000 (2001). Skopje: State Statistical Office
of Republic of Macedonia.
Statistical Yearbook of the Republic of Macedonia: 2001 (2002). Skopje: State Statistical Office
of Republic of Macedonia.
Statistical Yearbook of the Republic of Macedonia: 2011 (2012). Skopje: State Statistical Office
Statistički pokazatelji migracija u Republici
Makedoniji na početku 21. stoljeća
Kosta Sotiroski, Ilija Hristoski
SAŽETAK
Republika Makedonija uvijek se smatrala vrlo izraženim migracijskim područjem koje obilježava veliko unutarnje kretanje stanovništva kao i stalni emigracijski pro
-cesi prema drugim zemljama. U središtu ovoga rada su ispitivanje i analiza obima,
dinamike, trendova, demografskih karakteristika i promjena modaliteta
migracij-skih tokova u zemlji tijekom prvog desetljeća 21. stoljeća te njihovo međudjelovanje i učinci na socioekonomske čimbenike. Imajući na umu različitosti migracijskih to
-kova unutar zemlje, očekivani ishodi usmjereni su prema otkrivanju relevantnih in -formacija o njihovim promjenama, kretanjima i uzajamnom djelovanju utemeljenom
na indikatorima dobivenim uporabom relevantne statističke metrike i podacima koji prikazuju razvoj statističkih regija u određenom razdoblju.
KLJUČNE RIJEČI: migracijski saldo, imigracija, emigracija, indikatori regionalnog razvoja, statističko zaključivanje, Republika Makedonija


![Table 6. Migration movement indicators for the Republic of Macedonia (2003 − 2011) Year Population size in the middle of the year* Internal migration External migration Migration balance Migration balance rate [‰] 2003 2,027,000 11,058 1,289 1,001 0.](https://thumb-ap.123doks.com/thumbv2/123dok/1779513.2630934/17.755.109.660.403.769/migration-indicators-republic-macedonia-population-migration-migration-migration.webp)