DAYA SAING EKONOMI
INDONESIA DALAM PASAR
GLOBAL
WEBINAR EKONOM PEREMPUAN INDEF:
KEMERDEKAAN DAN MASA DEPAN EKONOMI BANGSA
EISHA MAGHFIRUHA RACHBINI, PHD
PENELITI INDEF
OUTLINE
•
Kondisi dan Tantangan Perekonomian Indonesia
•
Tantangan Global : Covid19 Pandemic and Economic Recovery
•
Pemulihan Ekonomi Nasional
•
Middle Income Trap
•
Bagaimana untuk dapat keluar dari Middle Income Trap?
TANTANGAN GLOBAL PANDEMIC
• Tren Angka Covid-19 kembali meningkat di beberapa negara akibat varian Delta
• Pengetatan kegiatan ekonomi dapat mengancam recovery ekonomi global
CASE FATALITY RATE & VACCINATION RATE
•
Tingkat vaksinasi secara global belum merata, dimana tingkat vaksinasi negara maju
cenderung lebih tinggi, dibandingkan negara berkembang
•
Fatality rate masih terus meningkat di beberapa negara berkembang, sedangkan di AS
telah mulai melandai
GLOBAL ECONOMIC RECOVERY
Overview of the World Economic Outlook Projections
(Percent change)
Year over Year
Projections 2019 2020 2021 2022 World Output 2.8 –3.2 6.0 4.9 Advanced Economies 1.6 –4.6 5.6 4.4 United States 2.2 –3.5 7.0 4.9 Euro Area 1.3 –6.5 4.6 4.3 Japan 0.0 –4.7 2.8 3.0 China 6.0 2.3 8.1 5.7 Indonesia 5.0 –2.1 3.9 5.9 ASEAN-5 4.9 –3.4 4.3 6.3
Emerging Market and Developing
Economies 3.7 –2.1 6.3 5.2 World Trade Volume (goods and services) 0.9 –8.3 9.7 7.0
Advanced Economies 1.4 –9.2 8.9 7.1
Emerging Market and Developing Economies –0.2 –6.7 11.1 6.9
Commodity Prices (US dollars)
Oil 10.2 – 32.7 56.6 –2.6 –
Nonfuel (average based on world commodity import weights)
0.8 6.7 26.5 –0.8
World Economic Outlook, July 2021 Update
–30 –25 –20 –15 –10 –5 0 5 10 15 20 25 82 85 88 91 94 97 100 103 106 109 112 115 2018 19 20 Jun. 21
Figure 2. Global Activity Indicators
(Three-month moving average, annualized percent change; deviations from 50 for PMIs, unless noted otherwise)
Sources: CPB Netherlands Bureau for Economic Policy Analysis; Haver Analytics; Markit Economics; and IMF staff estimates.
Note: PMI above 50 indicates expansion while below 50 indicates contraction. PMI = purchasing managers' index.
Industrial production Manufacturing PMI: New orders Services PMI: New business
Monthly world trade volumes (seasonally adjusted, 2018=100, right scale)
Global Activity Indicators
(3-month moving average, % change)
• Tingkat vaksinasi yg tidak merata menyebabkan divergensi proyeksi pemulihan ekonomi antar negara
• Indikator aktivitas global menunjukkan tingkat recovery yg berbeda antar sektor, dimana sektor jasa
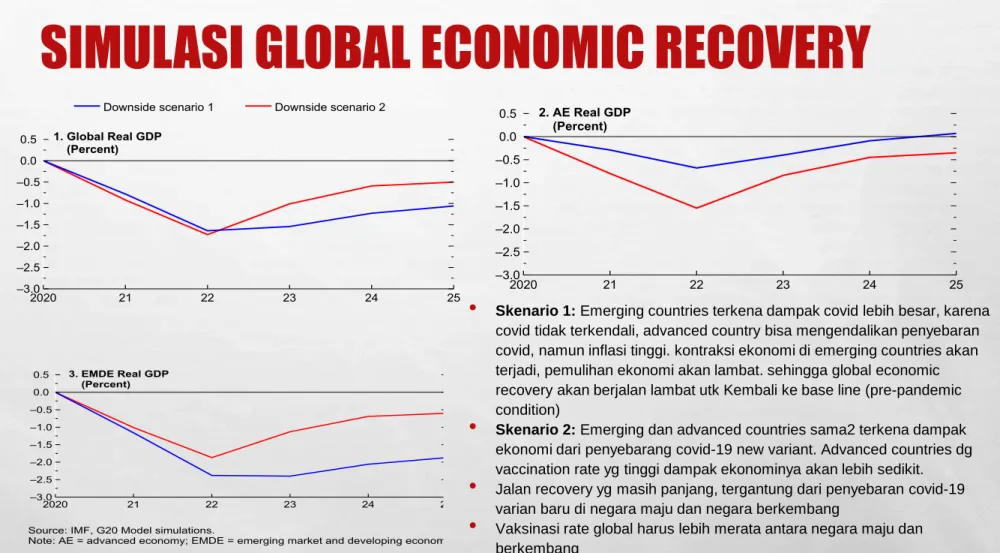
SIMULASI GLOBAL ECONOMIC RECOVERY
•
Skenario 1: Emerging countries terkena dampak covid lebih besar, karenacovid tidak terkendali, advanced country bisa mengendalikan penyebaran covid, namun inflasi tinggi. kontraksi ekonomi di emerging countries akan terjadi, pemulihan ekonomi akan lambat. sehingga global economic recovery akan berjalan lambat utk Kembali ke base line (pre-pandemic condition)
•
Skenario 2: Emerging dan advanced countries sama2 terkena dampakekonomi dari penyebarang covid-19 new variant. Advanced countries dg vaccination rate yg tinggi dampak ekonominya akan lebih sedikit.
•
Jalan recovery yg masih panjang, tergantung dari penyebaran covid-19 varian baru di negara maju dan negara berkembang•
Vaksinasi rate global harus lebih merata antara negara maju dan berkembangFigure 6. Alternative Evolutions in the Fight against the COVID-19 Virus
(Deviation from baseline)
Source: IMF, G20 Model simulations.
Note: AE = advanced economy; EMDE = emerging market and developing economy. –3.0 –2.5 –2.0 –1.5 –1.0 –0.5 0.0 0.5 2020 21 22 23 24 25 –3.0 –2.5 –2.0 –1.5 –1.0 –0.5 0.0 0.5 2020 21 22 23 24 25 1. Global Real GDP (Percent) 2. AE Real GDP (Percent) –3.0 –2.5 –2.0 –1.5 –1.0 –0.5 0.0 0.5 2020 21 22 23 24 25 3. EMDE Real GDP (Percent)
Downside scenario 1 Downside scenario 2
Figure 6. Alternative Evolutions in the Fight against the COVID-19 Virus
(Deviation from baseline)
Source: IMF, G20 Model simulations.
Note: AE = advanced economy; EMDE = emerging market and developing economy. –3.0 –2.5 –2.0 –1.5 –1.0 –0.5 0.0 0.5 2020 21 22 23 24 25 –3.0 –2.5 –2.0 –1.5 –1.0 –0.5 0.0 0.5 2020 21 22 23 24 25 1. Global Real GDP (Percent) 2. AE Real GDP (Percent) –3.0 –2.5 –2.0 –1.5 –1.0 –0.5 0.0 0.5 2020 21 22 23 24 25 3. EMDE Real GDP (Percent)
Downside scenario 1 Downside scenario 2
PEMULIHAN EKONOMI INDONESIA
•
Pertumbuhan ekonomi tumbuh 7.07% Q2-2021
-18.3 -5.3 7.1 -20.0 -15.0 -10.0 -5.0 0.0 5.0 10.0 15.0 03/ 19 94 02 /1 99 5 01/ 19 96 12 /1 99 6 11 /1 99 7 10/ 19 98 09/ 19 99 08 /2 00 0 07 /2 00 1 06/ 200 2 05 /2 00 3 04 /2 00 4 03/ 20 05 02 /2 00 6 01/ 200 7 12 /2 00 7 11 /2 00 8 10/ 200 9 09/ 2010 08 /2 01 1 07 /2 012 06/ 2013 05 /2 014 04 /2 015 03/ 20 16 02 /2 01 7 01/ 2018 12 /2 01 8 11 /2 01 9 10/ 2020
Pertumbuhan PDB Indonesia, Quarterly, yoy, %
PEMULIHAN EKONOMI INDONESIA
6.5 6.3 6.0 5.9 5.8 -6.8 3.2 4.9 6.5 18.3 7.9 5.2 5.1 5.1 5.0 5.0 3.0 -5.3 -3.5 -2.2 -0.7 7.1 4.8 4.7 5.0 4.5 3.7 0.7 -17.2 -2.7 -3.4 -0.5 6.1 5.8 6.0 6.1 6.3 -0.5 -16.9 -11.4 -8.6 -4.2 -13.3 14.3 -12.0-9.1 0.5 12.2 -20.0 -15.0 -10.0 -5.0 0.0 5.0 10.0 15.0 20.0 25.0 12 /2 01 8 01/ 2019 02/ 2019 03/ 20 19 04 /2 019 05 /2 01 9 06 /2 01 9 07 /2 019 08 /2 01 9 09 /2 01 9 10/ 2019 11 /2 01 9 12 /2 01 9 01/ 2020 02/ 2020 03/ 20 20 04 /2 02 0 05 /2 020 06/ 2020 07 /2 020 08 /2 020 09/ 2020 10/ 2020 11 /2 02 0 12 /2 02 0 01 /2 02 1 02/ 2021 03/ 20 21 04 /2 021 05 /2 021 06/ 2021GDP Growth, Quarterly, y.o.y
Brunei China Indonesia Malaysia Philippine s Singapore Thailand United States•
Low-based effect, dibandingkan Q2-2020, juga terjadi di negara lain.
•
Kurva pemulihan ekonomi Indonesia berbeda, cukup landai, dibandingkan negara dengan
rate vaksinasi tinggi seperti Singapura, Amerika Serikat
MIDDLE INCOME TRAP
Grup July 1, 2021 (baru) July 1, 2020 (lama) Low income < 1,046 < 1,035 Lower-middle income 1,046– 4,095 1,035– 4,045 Upper-middle income 4,096 -12,695 4,046 -12,535 High income > 12,695 > 12,535Perubahan Klasifikasi Negara Berdasarkan Pendapatan
Sumber: World Bank, 2021
INDONESIA GNI PER CAPITA (CURRENT US$)
4050
3870
3730
3400
570
1100
•
Menurunnya kinerja ekonomi Indonesia tak lepas dari dampak pandemi Covid-19
ASEAN COUNTRIES COMPARISON
LONG TERM ECONOMIC GROWTH
•
Long-term annual GDP growth, secara rata2 menurun.
•
Ditambah dengan dampak covid-19 terhadap pertumbuhan ekonomi 2020 dan post-pandemic
recovery
•
Tantangan untuk pertumbuhan ekonomi Indonesia agar dapat lepas dari Middle Income Trap
10.9 -13.1 -2.1 2.1 7.7 7.1 5.7 5.0 -15.0 -10.0 -5.0 0.0 5.0 10.0 15.0 01/ 19 61 01/ 19 63 01/ 19 65 01/ 19 67 01 /1 96 9 01/ 19 71 01/ 19 73 01/ 19 75 01/ 19 77 01/ 19 79 01/ 19 81 01 /1 98 3 01/ 19 85 01/ 19 87 01/ 19 89 01/ 19 91 01/ 19 93 01/ 19 95 01/ 19 97 01 /1 99 9 01/ 200 1 01/ 200 3 01/ 200 5 01 /2 00 7 01/ 200 9 01/ 2011 01/ 2013 01/ 2015 01 /2 01 7 01/ 2019
Pertumbuhan Ekonomi Indonesia, Annually, % (1961-2020)
NERACA PERDAGANGAN INDONESIA, USD MILLION
•
Neraca Perdagangan Indonesia Tren positif, kecuali pada periode 2012-2014 dam 2018-2019
•
Di tahun 2020 kembali positif karena Impor mengalami tren menurun sejak tahun 2018
•
Tahun 2021, Q1-Q2, Neraca perdagangan terbantu oleh export, karena negara mitra dagang sudah mulai recovery.
-50000.0 0.0 50000.0 100000.0 150000.0 200000.0 250000.0 01/ 19 84 01/ 19 85 01/ 19 86 01/ 19 87 01/ 19 88 01/ 19 89 01/ 19 90 01/ 19 91 01/ 19 92 01/ 19 93 01 /1 99 4 01 /1 99 5 01/ 19 96 01/ 19 97 01/ 19 98 01/ 19 99 01/ 200 0 01/ 200 1 01/ 200 2 01/ 200 3 01/ 200 4 01/ 200 5 01/ 200 6 01/ 200 7 01/ 200 8 01/ 200 9 01/ 2010 01 /2 01 1 01/ 2012 01/ 2013 01/ 2014 01/ 2015 01 /2 01 6 01/ 2017 01/ 2018 01 /2 01 9 01/ 2020
Exports Imports Trade Balance
NERACA PERDAGANGAN DENGAN MITRA DAGANG UTAMA
0.0 10000.0 20000.0 30000.0 40000.0 50000.0 60000.0Trade with ASEAN countries, USD million
Exports: Asean Imports: ASEAN
0.0 2000.0 4000.0 6000.0 8000.0 10000.012000.0 14000.0 16000.0 18000.0
Trade with South Korea, USD Million
Exports: South Korea Imports: South Korea
0.0 10000.0 20000.0 30000.0 40000.0
Trade with Japan. USD million
Exports: : Japan Imports: Japan
0.0 5000.0 10000.0 15000.0
20000.0
Trade with USA, USD million
NERACA PERDAGANGAN DENGAN MITRA DAGANG UTAMA
•
Sejak 2008, perdagangan dg china selalu defisit.
•
Defisit perdagangan dg China melebar
0.0 5000.0 10000.0 15000.0 20000.0 25000.0 30000.0 35000.0 40000.0 45000.0 50000.0
Trade with China, USD Million
Exports: China Imports: China
NERACA PERDAGANGAN MIGAS
-20000.0 -10000.0 0.0 10000.0 20000.0 30000.0 40000.0 50000.0Neraca Perdagangan Migas, USD million
Exports: Oil and Gas Imports: Oil and Gas Trade Balance: Oil and Gas
NERACE PERDAGANGAN NON MIGAS
0.0 20000.0 40000.0 60000.0 80000.0 100000.0 120000.0 140000.0 160000.0 180000.0Neraca Perdagangan Non-migas, USD million
Exports: Excludes Oil and Gas Imports: Excludes Oil and Gas Trade Balance: Excludes Oil and Gas
EKSPOR BERDASARKAN SEKTOR
-6.54 5.29 14.02 4.01 -2.11 2.91 -30 -20 -10 0 10 20 30 2018 2019 2020Pertumbuhan Ekspor, %
Lainnya Pertanian Industri Pengolahan Pertambangan Non Migas
Share Ekspor, Januari 2019- 2020
PERTUMBUHAN EKSPOR MENURUT KOMODITAS (2019-2021)
Source: BPS
•
Pertumbuhan Ekspor Non-migas didorong oleh Komoditas berbasis sumber daya alam. Seperti Minyak
Kelapa Sawit, besi-baja,
PERTUMBUHAN EKSPOR MENURUT KODE ISIC 2019-2020
Ekspor Non Migas, Dec 2020
Source: BPS
•
Pertumbuhan Ekspor Non-migas Industri Pengolahan, didorong oleh Industri Makanan, dan Industri Logam
Dasar
EKSPOR NON-MIGAS UMKM BERDASARKAN SEKTOR
EKONOMI
GAMBARAN INDUSTRI KECIL INDONESIA
3.9% 7.8% 8.6%9.9% 22.9% 34.2% 0.0% 10.0% 20.0% 30.0% 40.0% 1Distribution of Small Manufacturing Firms by Subsector (Percentage of Unit
Number
Food
Woods&products,Cork Wearing apparel Textile
Other non-metallic mineral products Furniture
Other manufacture Fabricted metal products Tobacco
Beverage
Leather, footwear
Publishing, printing, recorded media chemicals&products
Rubber&plastic products Paper&products
Repairement machinery&equipment Pharmachy&drug
Other transport manufacturing Motor vehicle, trailers&semi trailers Machinery and equipment
Basic metals Electrical machinery
Office&computing machinery
Small manufacturing firms are concentrated in Labor-intensive sub-sectors, e.g. Food, wood
products, Wearing and Apparel, textile and furniture.
Source: BPS, 2013,
diolah
OUTPUT INDUSTRI KECIL
39.7% 16.9% 10.0% 6.6% 5.9% 4.0%Figure 2.11.Small Manufacturing Firms Output by Subsector
FoodWearing apparel Woods&products,Cork
Other non-metallic mineral products Furniture
Fabricted metal products Textile
Leather, footwear Other manufacture
Publishing, printing, recorded media chemicals&products
Tobacco Beverage
Electrical machinery Rubber&plastic products
Motor vehicle, trailers&semi trailers Machinery and equipment
Repairement machinery&equipment Other transport manufacturing