55
OPTIMASI SISTEM PEMETAAN MAGNET SIKLOTRON DECY-13
Taufik, Kurnia Wibowo, Frida Iswining Dyah, Suprapto Center for Accelerator Science and Technology - BATAN Jl. Babarsari P.O. Box 6101 ykbb, Sleman, Yogyakarta, 55281, Indonesia
Received 23 June 2016, received in revised form 21 September 2016, accepted 24 October 2016
ABSTRACT
OPTIMATION OF DECY-13 CYCLOTRON MAGNET MAPPING SYSTEM. A cyclotron magnet serves to deflect the particle beam so that the beam trajectory is circular and also serves to focus the beam. The magnetic flux density of a cyclotron magnet must satisfy the isochronous curve. The magnetic field distribution need to be measured in order to know that the magnetic flux density has fulfilled the isochronous curve, therefore a mapping system is needed to obtain the magnetic field distribution data. The design and construction of mechanical system of magnetic field mapping has been carried out in 2013 using fly mode algorithm, but the test results is not accurate yet. Therefore it is necessary to optimize of the magnetic field mapping system. The aim of this optimation is to improve the accuracy of step position and the precission of magnetic field measurement of the mapping system of DECY-13 cyclotron magnet. The research was done by changing the mapping methods that previously based on the fly mode with the step mode. In the step mode, the magnetic field data would be taken when the probe has been completely stopped at the specified position. The magnet mapping system has been optimized with 89.58% of the average step position accuracy. The mapping system has to be started at minimum of 2 hours after the Magnet Power Supply (MPS) is turned on, in order to get 3.53 gauss of the precision of magnetic field measurement. Although the magnetic field measurement of 1st sensor and 2nd sensor have measurement maximum different of 6.3 gauss
but the two sensors have the same pattern of magnetic field average. The mapping result from one of 2 sensors can be used to calculate magnetic field parameter if the magnetic field is symmetric.
Keywords: optimation, DECY-13 cyclotron, magnetic field, stepping mode, mapping system ABSTRAK
OPTIMASI SISTEM PEMETAAN MAGNET SIKLOTRON DECY-13. Magnet siklotron berfungsi untuk membelokkan berkas partikel sehingga lintasan berkasnya melingkar dan juga berfungsi untuk memfokuskan berkas. Rapat fluks magnet dari magnet siklotron harus memenuhi kurva isochronous. Distribusi medan magnet perlu diukur untuk mengetahui bahwa rapat fluks magnet telah memenuhi kurva isochronous, oleh karena itu sistem pemetaan diperlukan untuk memperoleh data distribusi medan magnet. Desain dan konstruksi sistem mekanik pemetaan medan magnet telah dilakukan pada tahun 2013 dengan menggunakan algoritma fly mode, tetapi dari hasil pengujian, sistem pemetaan belum akurat. Oleh karena itu perlu untuk mengoptimalkan sistem pemetaan medan magnet. Tujuan dari optimasi ini adalah untuk meningkatkan akurasi posisi langkah dan presisi pengukuran medan magnet dari sistem pemetaan magnet siklotron Decy-13. Penelitian ini dilakukan dengan mengubah metode pemetaan yang sebelumnya menggunakan fly mode menjadi step mode. Pada pemetaan step mode, data medan magnet akan diambil ketika probe telah benar-benar berhenti pada posisi yang ditentukan. Sistem pemetaan magnet telah dioptimasi dengan akurasi rata-rata posisi langkah 89,58%. Sistem pemetaan harus dimulai minimal 2 jam setelah Magnet Power Supply (MPS) diaktifkan untuk mendapatkan presisi pengukuran medan magnet sebesar 3,53 gauss. Meskipun pengukuran medan magnet dari sensor 1 dan sensor 2 memiliki perbedaan pengukuran maksimum 6,3 gauss tetapi medan magnet rata hasil pengukuran kedua sensor memiliki pola yang sama. Hasil pemetaan dari salah satu dari kedua sensor tersebut dapat digunakan untuk menghitung parameter medan magnet siklotron jika medan magnet nya simetris.
56
INTRODUCTION
ECY-13 is a cyclotron being developed at Center for Accelerator Science and Technology (PSTA) - BATAN for PET radioisotopes production. This cyclotron development was started in 2009 and aimed to master the cyclotron technology. This cyclotron was designed to produce 50 µA protons beams with the energy of 13 MeV [1].
One of the main component of a cyclotron is a magnet. The magnet serves both to deflect the particle beam so that the beam trajectory is circular and to focus the beam. In a cyclotron, the RF frequency is always kept constant so that when the particle energy increases the average magnetic flux density must increases radially to compensate the relativistic effect that known as the isochronous field. The average magnetic field was calculated using iterative scheme to find equilibrium orbit. The other orbit properties like radial and axial betatron frequencies and phase shift also could be determined from the equilibrium orbit algorithm[2]. To satisfy the above cyclotron magnet requirements, 3 dimensions simulation software is very important to determine the magnet model in the design process. DECY-13 magnet was designed using Opera 3D simulation software and Tosca modul. The isochronous field was easy to obtained by changing the dimensions of the magnetic poles of the simulation magnet model. The DECY-13 magnet design has finished in 2013 and fulfilled the isochronous field requirement with integrated phase shift < ±15º[3]. The beam trajectory simulation also showed that the magnetic field data from the design caould accelerate the ion beam up to 13 MeV[4]. After being constructed, the magnet need to be measured by a mapping system in order to make sure that the magnetic flux density have fulfill the requirements. If the measurement result does not fulfill the isochronous field then the magnet need to be shimmed (correction the magnetic field) by changing the hill side or gap mechanically [5]. The mapping system collect the magnetic field data in the median plane of the magnetic pole with the same step sizes in polar or Cartesian coordinates.
Design and construction of mechanical system of magnetic field mapping has been carried out in 2013 for DECY-13 magnet. This mapping system could map magnetic flux density in two-dimensional cartesian coordinate with map ping range of 960 mm × 960 mm using two Hall probes[6]. A completely different mapping is present in VINCY cyclotron, where the mapping system was made in radial movement[7]. The instrumentation tool of DECY-13 mapping system was made by using National Instruments (NI) Controller CRIO-9022, NI stepper motors module and Group 3 tesla meter. Teslameter and controller are connected to a computer that was programmed with labview software. At first, the method that was used in this mapping system was flying mode. In the flying mode, the magnetic field data was taken at a certain interval time meanwhile the tesla probes keep moving in y coordinate. At that time, flying mode was used in order to reduce the mapping time, so the magnetic field changes respect to time can be minimized. According to the test results of the flying mode with the mapping area of 100 mm × 100 mm, 1 mm step size in Y direction and 10 mm step size in X direction, the amount of data from this test result was different with the the amount of data that should be that was 1111 data, thus there was an error in data sampling. Therefore it is necessary to optimize of the magnetic field mapping system. The aim of this optimation is to improve the accuracy of step position and the precission of magnetic field measurement of the mapping system of DECY-13 cyclotron magnet.
METHODOLOGY
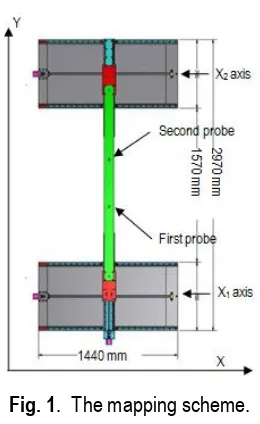
The mapping system is designed to be able to move in two dimensional cartesian coordinates, X and Y coordinates. The X coordinate is arranged in 2 axis that can move simultaneously namely X1 and X2 axis, while the Y coordinate only is arranged in one axis. To map the magnetic field with pole diameter of 960 mm, the X coordinate can move up to a distance of 1000 mm while the Y coordinate can move up to a distance of 500 mm. Two hall probes are mounted in Y coordinate with the range of 480 mm symmetrically, therefore the measuring range of the magnetic field in the Y direction can reach to 1000 mm. The hall probes from Group 3 technology is used to measure magnetic flux density of the magnet. According to the manual the hall probes has been calibrated and the calibration is valid only for 2 years. The calibration of the 1st hall probe is still valid meanwhile
the 2nd has been expired. Calibration of the magnetic field probe is difficult to be done because there is no local
57
Fig. 1. The mapping scheme.
The method that is used to optimize the mapping system was done by changing the mapping methods based on the step mode. In the step mode, the magnetic field data would be taken when the probe has been completely stopped at the specified position. To carry out the step mode algorithm, the hardware of the mapping system was not changed, but the software of controller was changed. After the software was modified, the mapping system testing conducted to determine its characteristics. The testing of the magnetic field alteration on the magnet operation time at a constant current needs to be done to determine how much the magnetic field change with operation time and when the magnetic field is constant.
RESULT AND DISCUSSION
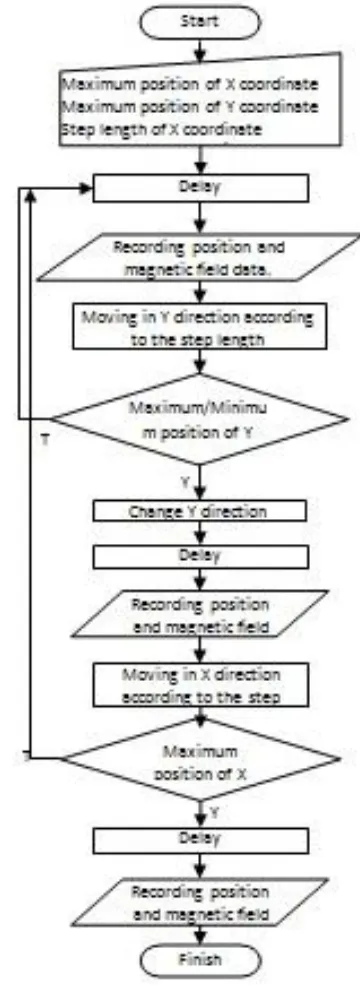
The step mode program of the magnetic field mapping has been created using the algorithm as shown in Fig. 2. According to Fig. 2, the mapping process of the magnetic field was carried out by moving the hall probe step by step in Y direction. After the probe reached a maximum/minimum position of Y coordinate then the probe move 1 step in X coordinate and change the direction of Y movement. The process was repeated until it reachs the maximum position of X coordinate. In this control program, the step size of the movement, the delay and the number of data in one position can be adjusted.
To show the position accuracy of the probe, the calibration is done by comparing the position of the probe that are recorded in the program and the position of the probe that are measured using a ruler with 1 mm minimum scale. Although the minimum scale of the ruler is 1 mm, the reading of the position of 0.5 mm can still be distinguished. The step position is measured three times and the sample of measurement result for X direction is shown in Table 1.
58
600 600.5 600.5 600.5
660 660.5 660.5 660.5
720 720.5 720.5 720.5
780 780 780 780
840 840 840 840
900 900 900 900
960 960 960 960
59 not found when the hall probes move 480 mm in Y direction, meanwhile when the hall probes move 960 mm in X direction, one of the axis has 0.5 mm of position error. When using 10 mm step size of X coordinate, 0.5 mm error occur from the position of 550 mm to 740 mm. This error may be caused by machining process or installing of mechanical part of mapping system. The average step position accuracy along 960 mm in X coordinate is 89.58%. The accuracy of this step position is better than flying mode algoritm in which the step position is not constant[8].
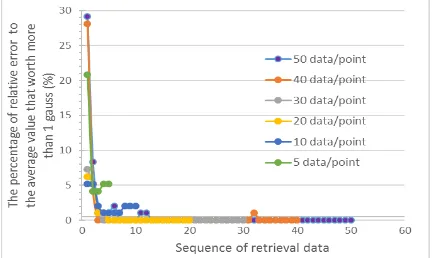
A repeatability testing of the mapping results was made to ensure that the results of the magnetic field data collection had been stable and precision. The test is performed by taking the data repeatedly at every point. In this test the amount of data retrieval at every point was varied in 5, 10, 20, 30, 40 and 50 data. The range of collecting data was conducted at x = 0 mm and y = 0 up to 480 mm with 5 mm of step size, thereby the amount of collecting data was 97 points. The measurement error was calculated relatively to the average magnetic field at each point. The percentage of relative error to the average value of each point that worth more than 1 gauss is shown in Figure 3.
According to Fig 3, the greatest percentage of the relative error that is worth more than 1 gauss obtained in the first sequence of the data retrieval, although at the 10 data/point of data retrieval, the percentage of the relative error of the first data is equal to the second data. To determine which sequence data that provide better error, it is necessary to know the maximum relative error of each sequence of data retrieval. Fig. 4 shows the maximum relative error to the average magnetic field at each point. Based on Fig. 4 the maximum relative error of the first data sequence is always greater than the next data sequence and the difference maximum relative error between the second data and the next sequence data is small. There are also some peaks of maximum relative error in some data sequence. This peaks of error may be caused by a disturbance in measuring unit or in Magnetic Power Suply (MPS). In the graph of 5 data/point, the maximum relative error of the second to the fifth data sequence is still quite large at around 6.4 gauss because the amount of data/point is too small.
Fig. 3. The percentage of relative error to the average value that worth more than 1 gauss (%)
60
Fig. 5. The percentage of relative error to the last data that worth more than 1.9 gauss every retrieval data sequence
To convince that the first data sequence has higher error than the other data sequence and the difference error between the second data and the next sequence data is small, then it is important to show the graph of the percentage of error relative to the last data that worth 1.9 gauss as shown in Fig. 5. Fig. 5 shows that the first data sequence always has higher percentage of relative error than the last data, meanwhile the other sequences have the relative error to the last data less than 1.9 gauss. This higher relative error can be caused due to the first data retrieval is taken when the motor has not stopped completely. Thus, in this magnetic field mapping system, the second data sequence and next other data sequence can be used as a valid measurement with a maximum error of 1.9 gauss. To reduce the time of the mapping process, the data retrieval of each points is done in 2 times/points.
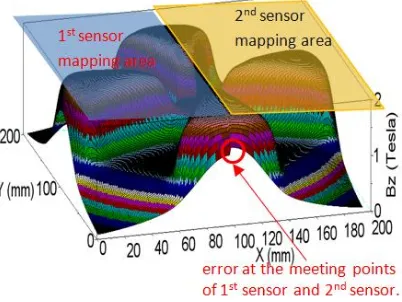
Fig. 6. Magnetic field mapping result.
Based on the above conditions, the mapping system is tried to map the magnetic field in the middle of the pole gap of DECY-13 cyclotron magnet using 5 mm of step size. The mapping process takes 502 minutes and the result of the magnetic field mapping is shown in Fig. 6. Based on Fig. 6, it appears that the meetingpoints between the measurements from the 1st and 2nd sensor are not the same and it gives the maximum difference at
1328 gauss. This difference could be due to the probe carrier is not flat, so the z coordinate level between 2 sensors is not the same. this assumption can be proved after the probe carrier which previously using aluminum box profiles with a thickness of 1 mm was replaced by 1.5 cm thickness of pertinax bar. After the replacement, the maximum difference between 1st sensor and 2nd sensor at the meeting points becomes 149.93 gauss.
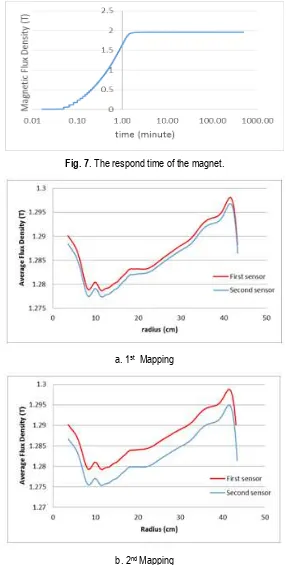
61 system is 3.53 gauss which is the sum of the error from the retrieval data and the respond time of magnet.
Fig. 7. The respond time of the magnet.
a. 1st Mapping
b. 2nd Mapping
Fig. 8. Magnetic field average of mapping result.
62
magnetic field data and calculated by using the cyclone program. Another equilibrium orbit code can be obtained using Simion program[11]. Because of the different mapping result at the meeting points of 1st sensor and 2nd
sensor, the cyclone program can not calculate the average field by using a full (four quadrants) of data. Therefore, the magnetic field average can be calculated from a half (two quadrants) of mapping data obtained from the 1st sensor or 2nd sensor. The other magnetic field average calculation using a quarter data of the
magnet[12]. To show the magnetic field average from the sensors and the position of the sensor, the mapping were done 2 times. The first mapping was done by placing the 1st sensor at one position and the 2nd sensor at
the other position, meanwhile the second mapping was done by changing the positions of both sensors. The magnetic field average calculation results are shown in Fig. 8. Fig. 8 shows that both sensors produce different measurements, the 1st sensor is always greater than the 2nd sensor. The 1st sensor gives a constant result
although the sensor posisiton was changed, meanwhile the 2nd sensor gives a different result when the sensor
position was changed. This different measurement result between two sensors may be caused by the calibaration of the 2nd sensor has been expired.
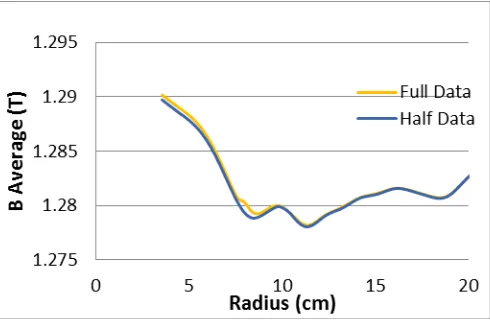
The hall probe position is added in the middle of the probe carrier in order to make sure that the calculation of magnetic field average using half data and full data have the same pattern. With this new hall probe position, one hall probe can get full magnet data (4 quadrant) with mapping area of a half of the radius of the magnetic poles. The comparison of the average magnetic field calculationfrom a full data and a half data is shown in Fig. 9. Referring to Fig. 9, it appears that the magnetic field average pattern using a half data and full data are almost the same, and the maximum difference between 2 magnetic field average is 6.3 gauss at radius 8.3 cm.
Fig. 9. Comparison of the magnetic field average calculation from a full data and a half data
Although there is a different mapping result due to the different hall probes and sensor positions, the magnetic field average have the same pattern. The same magnetic field average pattern is caused due to the form of the magnetic poles of the cyclotron have a symmetrical shape. Beside that this research shows that the calculation of the magnetic field average using half data and full data only produce minor differences. According to this experiment, the results of the mapping of one sensor that produces half the data is sufficient to describe the average magnetic field cyclotron.
CONCLUSION
63 this paper publication. Thank you also to the Head of Center for Accelerator Science and Technology who had supported the budget for this research through cyclotron project budget.
REFERENCES
1. Silakhuddin and S. Santosa, “Conceptual Design Study of 13 MeV Proton Cyclotron,” Atom Indonesia, 38.1 (2012) : 7 – 14
2. C. Baumgarten, “Cyclotron closed orbits on a radial grid,” Nuclear Instruments Methods Phys. Res. Sect. A Accel. Spectrometers, Detect. Assoc. Equip., 647.1 (2011): 31–33
3. Taufik, A. Hermanto, P. Anggraita and S. Santosa, “Determination of Magnet Specification of 13 MeV Proton Cyclotron Based on Opera 3D,” Atom Indonesia, 40.2 (2014): 69 – 75
4. P. Angraita, E. Mulyani and I. A. Kudus, “Simulations of Beam Quality in a 13 MeV PET Cyclotron,” Atom Indonesia, 41.3 (2015): 145–149
5. D. Chen, K. Liu, J. Yang, Z. Chen, D. Li, B. Qin, J. Huang, Y. Q. Xiong and M. Fan, “Fast and accurate magnetic field shimming for a compact cyclotron,” IEEE Transactions on Nuclear Science, 60.3 (2013): 2175– 2179
6. K. Wibowo, Silakhuddin, and S. Santosa. “Rancangbangun Perangkat Mekanik Pemetaan Medan Magnet untuk Siklotron Decy 13”, Prosiding Pertemuan dan Presentasi Ilmiah – Penelitian Dasar Ilmu Pengetahuan dan Teknologi Nuklir, Yogyakarta (2013): 1–5
7. S. Ćirković, A. Ž. Ilić, A. Dobrosavljević, R. Balvanović and J. L. Ristić-Djurović. “Minimization of the measurement errors induced by the cyclotron magnetic field measurement system,” Nuclear Instruments Methods Phys. Res. Sect. A Accel. Spectrometers, Detect. Assoc. Equip., 679 (2012): 54–60
8. F. I. Diah and Saminto. “Rancang Bangun Sistem Instrumentasi dan Kendali (SIK) Perangkat Pemetaan Medan Magnet Metode Flying Mode Siklotron DECY-13,” Prosiding Pertemuan dan Presentasi Ilmiah Teknologi Akselerator dan Aplikasinya, Yogyakarta (2014): 89–98
9. J. Kang, B. H. Hong, D. H. An, I. S. Jung, and K. U. Kang, “Magnet design of the superconducting cyclotron for carbon therapy,” IEEE Transactions on Applied Superconductivity, 22.3 (2012): 2–5
10.H. Ueda, M. Fukuda, K. Hatanaka, T. Wang, X. Wang, A. Ishiyama, S. Noguchi, S. Nagaya, N. Kashima and N. Miyahara. “Conceptual design of next generation HTS cyclotron,” IEEE Tranactions on Applied Superconductivity, 23.3 (2013): 4–8
11.T. Koeth. “Undergraduate Education with the Rutgers 12-Inch Cyclotron”, Physics Procedia, 66 (2015): 622-631