SLOPE DEFORMATION MONITORING USING
REFLECTORLESS TOTAL STATION METHOD
Mohd Asri Bin Hj. Zahid
ABSTRACT
Continuous deformation monitoring of slope along the roads and highways in Malaysia is one of the most effective method to avoid or reduce landslides. On the other hand there are many factors influencing the success of the monitoring system such as accuracy of the instruments, resources of the project, frequency of the slope failure in a particular area, size of potential hazards and people involve on that project. To overcome these problems Reflector-less Total Station (TS) method is introduced. In terms of economic advantage, Reflector-less method will be able to cover more survey points, as prisms are no longer required. Not only the costs for the prisms are saved, but high installation expenses can also be reduced. Additionally it can lower the risk on the people involved in measuring slope deformation in areas which are dangerous and inaccessible. This paper focuses on the potentials of using Reflector-less TS for slope deformation monitoring.
Keywords: Slope deformation, Landslide monitoring, Reflector-less Total Station
INTRODUCTION
Deformation refers to the changes in shapes, dimension and position (horizontal and/or vertical components) of a deformable body (natural or man-made objects). Large engineering structures are subjects to deformation due to factors such as changes of ground water level, tidal phenomena, tectonic phenomena, land movements, or any other natural disasters.
Now a days the monitoring of construction objects and dangerous areas are becoming more and more important due to defects and disasters that happened around us. When carrying out survey in these dangerous areas, staff safety is the primary concern. It involves periodically and automatically measuring reference points in or around the active area to determine deformation. When movement tolerances are exceeded, it is often necessary to immediately analyze the measured data to activate response events. Monitoring tasks and deformation analysis present some of the most sophisticated challenges in the surveying profession today because they require the highest accuracy. Therefore it is important to measure the movement for the purpose of safety assessment as well as preventing any disaster in the future.
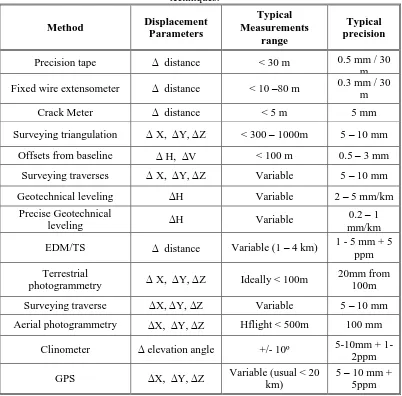
(inclinometer) and water pressure (pyrometer). On the other hand, in geodetic method highly used and understood by surveyors, special measuring techniques can be applied such as Global Positioning System (GPS), close range photogrammetry, precise leveling, TS, laser scanning (terrestrial survey), Very LongBaseline Interferometry (VLBI) and satellite laser ranging. It is the role of geotechnical engineer or surveyor to determine which sensors will allow the deformation to be best described. Each of the instruments and measurements technique has its own advantages and disadvantages. The selection of most appropriate technique or combination of techniques for any particular application will depend on cost such as instruments technology, technical support or experts, survey specification or procedures, the accuracies required, and the scale of the survey involves. Therefore several aspects related to the optimal design of the networks, measurement and analysis techniques suited to the monitoring surveys have to be considered. A list of the most commonly used geodetic methods for deformation monitoring and their associated approximate accuracies are given in Table: 1. [1]
Geodetic techniques have traditionally been used mainly for determining the absolute displacements of selected points on the surface of the object with respect to some reference points that are assumed to be stable. Non-geodetic techniques have mainly been used for relative deformation measurements within the deformable object and its surroundings. Many modern survey systems (e.g., electronic total stations, digital level, GPS, etc,) can easily meet or exceeding the accuracies shown on the Table 2. [2] However, it is important
that accuracy criteria must be defined relative to the particular structure’s
requirements, not the capabilities of a survey instruments or system.
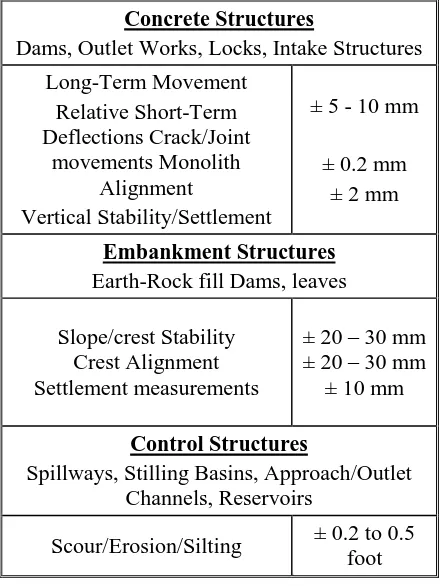
Table 2. Accuracy Requirements for Structure Target Point (95% RMS)
Concrete Structures
Dams, Outlet Works, Locks, Intake Structures Long-Term Movement
Relative Short-Term Deflections Crack/Joint
movements Monolith Alignment
Vertical Stability/Settlement
± 5 - 10 mm
± 0.2 mm ± 2 mm
Embankment Structures Earth-Rock fill Dams, leaves
Slope/crest Stability Crest Alignment Settlement measurements
± 20 – 30 mm ± 20 – 30 mm
± 10 mm
Control Structures
Spillways, Stilling Basins, Approach/Outlet Channels, Reservoirs
Scour/Erosion/Silting ± 0.2 to 0.5 foot
Reflector-less TS are highly effective in situation where it is dangerous or difficult to place prism directly, and when job efficiency is the first priority. This feature provides ultimate flexibility in many field applications such forestry survey, quarries survey, mining, accident investigation, large scale object measurement such as dam, bridge, high rise building, etc. Reflector-less TS helps achieve safer work practices, reduce worker exposure to hazardous environments, and significantly reduces the survey crew size from three to one.
Problem Statement
authorized organization. Latest technology such as laser scanning have high resolution but still relatively expensive. To overcome problems mentioned in the above methods, Reflector-less TS is introduced. In terms of economic advantage, Reflector-less TS will enable a surveyor to survey more points, as prisms are no longer required. Not only the costs for the prisms are saved, but high installation expenses can also be reduced.
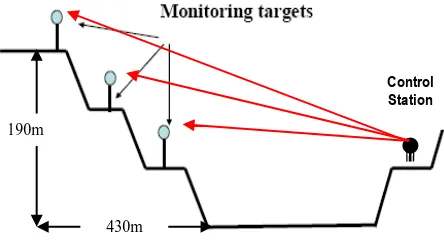
Study Area Description
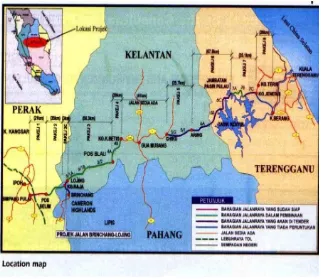
The site lies within the State of Perak at Longitude 101˚ 20’ 43” Latitude 4˚ 35’ 27”. It is situated at the second East-West Highway federal route 145 at CH 23 + 800 is a highway in Peninsular Malaysia which connects Simping Pulai in Perak to Gua Musang in Kelantan as shown in Figure 1. The highway is expected to be extended further east to Kuala Terengganu in the future. This highway features a four-lane carriageway from Simpang Pulai to Cameron Highlands and a two-lane carriageway from Cameron Highlands to Gua Musang.
Figure 2. Overview of study area location, captured by aerial photograph The active landslide is about 190m high and between 200m height and 430m wide and its volume is estimated to be 2 to 3million m3 as shown in figure 2. [5]
Objectives
The objectives of this research are:
a. To calibrate Reflector-less TS using various material targets. b. To employ the Reflector-less TS method for landslide monitoring.
c. To analyze and determine the magnitude of mass movement in landslide prone areas.
d. To compare the coordinate between the Reflector-less TS and ordinary TS technique.
Research Methodology
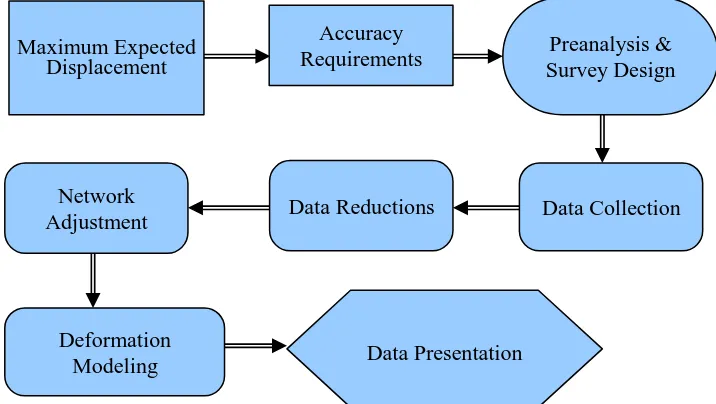
The flow chart shown in Figure 3 describes the project specific measurement scheme and its operating procedures.
Figure 3. Deformation Survey Data Flow 190m-200m
430m
Network Adjustment
Preanalysis & Survey Design Accuracy
Requirements Maximum Expected
Displacement
Data Reductions Data Collection
Deformation
A. Maximum Expected Displacement
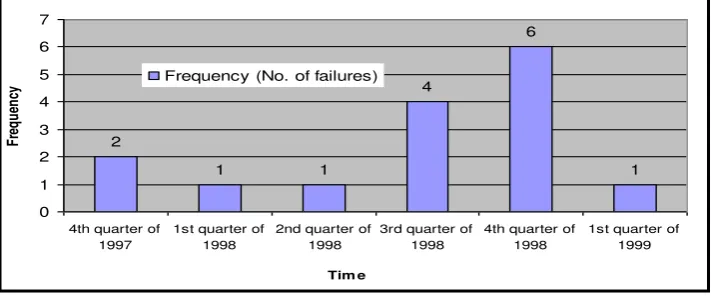
In order to obtain the expected displacement of the study area, the history of the landslides occurrences along the highways must be identified. Hence, information was gathered from relevant bodies such as contractors (MTD) and JKR. According to Husaini (2005), there were 15 failures of cut slopes from 1997 to 1999 at the Pos Selim highway (Figure 4). [3]
Figure 4. Frequency of slope failures from
1997 to1999 (Source: H. Omar, M. Daud, M.B. Zohadie, S. Maail, A.A. Aziz & R. Muniandy, (2005).
B. Accuracy Requirements
In order to obtain the accuracy requirements, the Reflector-less TS must be tested and calibrated. The Calibration of Reflector-less TS is concerned with the determination of instrument errors and reflector, whereas standardization refers to the comparison of the instrument to a standard of length traceable to the National Standard. If the calibration is performed over a certified baseline to prescribe level of precision, the Reflector-less TS is considered to be standardized [4].Calculations used in this research (to determine zero error and TS calibration) were based on parametric least-square adjustment.
C. Preanalysis & Survey Design
The pre-analysis and survey designs are mainly concerned by following some procedures as mentioned below:
i. Required equipment,
The instrument used in this research is a Topcon GPT3007 N/LN Reflector-less total station, as shown in Figure 5. The accuracy of Reflector-Reflector-less TS, is shown in Table 3.
Table 3. Specification of Topcon GPT-3007 LN/N
ii. Monuments types,
Reference mark used for monitoring points was a mini prism which has been planted by MTD survey team, as shown in Figure 6. Unfortunately some of the prisms were stolen and damaged during the construction [7].
Figure 6. Monitoring point
To overcome this problem new reference targets were identified as aimed point as shown in Figure 6.
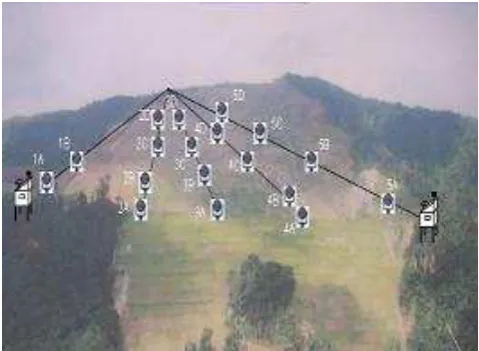
iii. Location and coverage of monitoring points,
There are 20 monitoring points planted at the slope which can be observed from the control station shown in Figure 7.
Figure 7. Monitoring Points
Non Prism Long Mode (Diffusing Surface)
Measuring
Range 5m to 1,200m
Measuring Accuracy
Fine: 1mm: ±(10 mm + 10 ppm * D) m.s.e. Coarse: 5 mm / 10 mm: ± (20 mm + 10 ppm * D) m.s.e.
Tracking: 10 mm: ±(10 mm) m.s.e.
Some of the adapter prism was stolen
New reference
iv. Maintenance and inspection of the monitoring network or control points.
Most deformation monitoring schemes consist of measurements made to monitored object that are referred to several reference points (assumed to be stable) [6]. To obtain correct object point displacements (and thus deformations), the stability of the reference points must be ensured [6]. All the control monuments were established by MTD survey team. They were situated at ideal and stable geographical locations shown in Figure 8. The control points are visible from one to the other.
Figure 8. Control point established by MTD
In order to assess the stability and the system coordinate used by MTD, GPS and TS observations were carried out to check the angles and distances of the three marks according to Malaysian standard survey regulation [7]. (Figure 9 shows the author and his team carrying out GPS observation). According to the rules, the comparison between new observations and old values adopted by MTD, the difference in angle and distance must not exceed 30" in angle and
1/8000 in distance or lines exceeding 40 meters, 30” in bearing and 0.006 m
per 20 m with a maximum of 0.03 m.
D. Data Collection
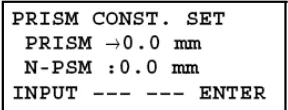
Angle and distances measurement are very important in this research because the accuracy of this project depend on the observations. Before the observation was made all the prism constants must be keyed in to internal memory of the Reflector-less TS as shown in Figure 10. The value was calculated during calibration works. This means all the observation distances was corrected data.
Figure 10. Setting the prism/non-prism constant value
Herewith are the highlight of the procedures and methodology data collection.
i. The first step is to set up the instruments to initial benchmark. Setup the instrument on station 44 and prism at station 43 and station 45 as a reference. As shown in Figure 11.
ii. Check the angle and tie distance to identify the control station in good condition.
iii. Sight shot the monitoring points accordingly in clock wise. Each observation was measured for four times therefore the standard deviation of each observation can be determined. As shown in Figure 12.
iv. All the data storage in internal memory of the instrument.
Base on the diagram as presented in Figure 11. All three control points must
be proved in good condition by checking the angle (θ < 30”) and distance
ration. The first epoch observation was taken on 05/01/08 and the second epoch observation was taken on 07/06/08 using Reflector-less TS, as shown in Table 4. The old value was provided by MTD survey team and the observation was made using TS set Sokkia SET 5B with accuracy of ± (5mm + 5ppm) with prism and was taken on 12/02/03.
Figure 11. Control Point Station Stn 44
Instrument Stn.
Stn 45 Reference
Stn.
Figure 12. Set-up for the field work
Table 4. Bearing and Distance of Control Points
Station Remarks: 12/02/03
Provided By MTD using TS set Sokkia SET 5B
At To Bearing Distance(m)
44 45 178˚33’05” 115.510 Old value
44 43 333˚44’37” 230.351 Old value
First Epoch
Station Remarks: Surveyed on
05/01/08 using Reflector-less TS
At To Bearing Std.Dia Distance(m) Std.Dia(m)
44 45 178˚33’05” ±0” 115.505 ±0.001 New
value
44 43 333˚44’30” ±2” 230.348 ±0.0005774 New value Second Epoch
Station Remarks: Surveyed on
07/06/08 using Reflector-less TS
At To Bearing Std.Dia Distance(m) Std.Dia(m)
44 45 178˚33’05” ±0” 115.505 ±0.0005774 New value
44 43 333˚44’30” ±2” 230.348 ±0.0005774 New value
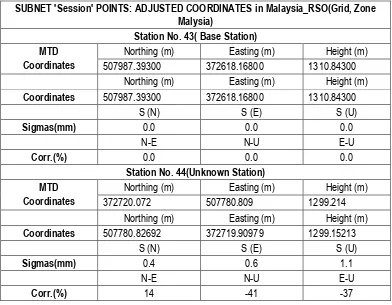
And to check the existing coordinate system used by MTD, observation by GPS was made as presented in Table 5. The observation was done using static method. From the GPS coordinates bearing distance was computed and compares with the MTD control point data in order to see tolerances within the limits describes by survey regulation.
190m mm
Control Station
Table 5. GPS Coordinates
SUBNET 'Session' POINTS: ADJUSTED COORDINATES in Malaysia_RSO(Grid, Zone Malysia)
Station No. 43( Base Station) MTD
Coordinates
Northing (m) Easting (m) Height (m)
507987.39300 372618.16800 1310.84300
Northing (m) Easting (m) Height (m)
Coordinates 507987.39300 372618.16800 1310.84300
S (N) S (E) S (U)
Sigmas(mm) 0.0 0.0 0.0
N-E N-U E-U
Corr.(%) 0.0 0.0 0.0
Station No. 44(Unknown Station) MTD
Coordinates
Northing (m) Easting (m) Height (m)
372720.072 507780.809 1299.214
Northing (m) Easting (m) Height (m)
Coordinates 507780.82692 372719.90979 1299.15213
S (N) S (E) S (U)
Sigmas(mm) 0.4 0.6 1.1
N-E N-U E-U
Corr.(%) 14 -41 -37
E. Data Reductions
Measurements were taken using Reflector-less Topcon GPT 30007LN. The measured data were downloaded to the computer. The raw data were converted into an EXCEL file.
The actual observations was made by Reflector-less TS are the horizontal and vertical angles (Hz and V), and the slope distance (Sd) these called fundamental measurements. From these data, its can determined the relative coordinates of the target as shown in Table 6, and determination of elevation or height difference by trigonometric leveling and can be expressed in equation (1).
∆h = hi + S sin v + hCR - hr (1)
Whereas: ∆h = Difference elevation; hi = Instrument height; S = Slope
distance; v = Vertical angle; hCR = The earth curvature and refraction.
And in order to get the precision (standard deviation) of elevation or height difference by trigonometric leveling its can be expressed in equation (2). [8]
(2)
Whereas: σ∆h = Total Error in Trigonometric leveling; σ hi = Height Instrument Error; σ hr = Height Target Error; z = Zenith Angle; σ z = Zenith
Angle error; S = Slope Distance; CR = Earth Curvature and Refraction; ρ = Radians to Seconds.
i. Applying pre-determined calibration value to the raw measurements and the precision (standard deviation) of distance measurements made with Reflector-less TS and can be expressed in a general from as:
σs = sqrt[ a2 + b2.S2] (3)
Whereas: σs = Standard deviation of distance; a = errors of the phase measurement, centering and calibrations errors; b = scale error due to uncertainties in the determination of the refractive index and the calibration of the modulation frequency; S = measured distance.
ii. Finding mean value for repeated measurements of the same observable, iii. Data quality assessment and statistical testing,
iv. Measurements outlier detection and data cleaning.
Table 6. The N, E and H Coordinate in meters of the 20 Monitoring Targets object
North(m) 507950.883 507950.884 507950.882 East(m) 372816.956 372816.956 372816.963 Height(m) 1373.740 1373.739 1373.739
P2
North(m) 508042.706 508042.707 508042.704 East(m) 372842.843 372842.840 372842.851 Height(m) 1424.956 1424.958 1424.954
P3
North(m) 508133.712 508133.717 508133.711 East(m) 372868.385 372868.372 372868.375 Height(m) 1474.389 1474.386 1474.398
P4
North(m) 508273.908 508273.909 508273.902 East(m) 372904.538 372904.539 372904.547 Height(m) 1546.535 1546.535 1546.545
P5
North(m) 508217.181 508217.180 508217.169 East(m) 372846.541 372846.536 372846.499 Height(m) 1485.075 1485.075 1485.047
P6
North(m) 508161.245 508161.245 508161.241 East(m) 372806.731 372806.731 372806.740 Height(m) 1439.913 1439.913 1439.916
P7
North(m) 508103.725 508103.724 508103.706 East(m) 372756.084 372756.082 372756.085 Height(m) 1388.565 1388.565 1388.561
P8
North(m) 508177.564 508177.562 508177.532 East(m) 372694.852 372694.849 372694.838 Height(m) 1389.367 1389.367 1389.365
North(m) 508212.336 508212.334 508212.310 East(m) 372769.457 372769.455 372769.431 Height(m) 1435.917 1435.914 1435.887
P10
North(m) 508249.405 508249.403 508249.382 East(m) 372820.459 372820.462 372820.411 Height(m) 1485.67 1485.666 1485.613
P11
North(m) 508296.157 508296.158 508296.150 East(m) 372737.178 372737.172 372737.122 Height(m) 1451.997 1451.994 1451.959
P12
North(m) 508404.822 508404.823 508404.827 East(m) 372685.999 372685.994 372685.926 Height(m) 1439.265 1439.259 1439.210
P13
North(m) 508157.199 508157.196 508157.159 East(m) 372630.582 372630.583 372630.570 Height(m) 1364.532 1364.532 1364.532
P14
North(m) 508133.914 508133.914 508133.916 East(m) 372621.335 372621.338 372621.345 Height(m) 1344.071 1344.071 1344.068
P15
North(m) 508578.092 508587.578 508578.089 East(m) 372707.252 372642.511 372707.229 Height(m) 1458.258 508587.578 1458.235
P16
North(m) 508587.575 508578.093 508587.571 East(m) 372642.515 372707.251 372642.496 Height(m) 1415.234 1458.252 1415.226
P17
North(m) 508558.865 508558.863 508558.857 East(m) 372649.341 372649.342 372649.322 Height(m) 1414.838 1414.837 1414.829
P18
North(m) 508508.746 508508.746 508508.737 East(m) 372664.197 372664.194 372664.168 Height(m) 1416.768 1416.767 1416.750
P19
North(m) 508403.922 508403.923 508403.944 East(m) 372595.84 372595.831 372595.736 Height(m) 1385.131 1385.128 1385.106
P20
North(m) 508537.644 508537.642 508537.646 East(m) 372585.832 372585.837 372585.831 Height(m) 1372.932 1372.930 1372.930
F. Network Adjustment
Network adjustment processing is to identify measurements blunders by statistically testing the observation residuals.
G. Deformation Modeling
Geometric modeling is used to analyze spatial displacements as shown in figure 13.
Figure 13. Calculation of displacement
General movement trends and described using a sufficient number of discrete point displacements (dn):
dn(∆x, ∆y, ∆z) for n = point number
Point displacements are calculated by differencing the adjusted coordinates for the most recent survey campaign (f), from the coordinates obtained at some reference time (i),
∆x = xf-xi is the x coordinate displacement
∆y = yf-yi is the y coordinate displacement
∆z = zf-zi is the z coordinate displacement
Each movement vector has magnitude and direction expressed as a point displacement coordinate differences. Collectively, the vector describe the displacement field over a given time interval. Displacements that exceed the amount of movement expected under normal operating conditions will indicate possible abnormal behavior.[6] Comparison of the magnitude of the calculated displacement and its associated survey accuracy indicates whether the reported movement is more like due to survey error:
│dn│< (en)
Whereas: │dn│= sqrt (∆x2 + ∆y2 + ∆z2
) for point n, is the magnitude of the displacement,
The critical value of z-test with 95% significance level can be expressed by: (en) = max dimension of combined 95% confidence ellipse for point n =
(1.96) sqrt (σf + σi).
Whereas: σf is the standard error in position for the (final) or most recent survey; σi is the standard error in position for the (initial) or reference survey.
H. Data Presentation
All surveying field work and analysis leads to the final presentation of the results. The results section will contain the following components.
i. Calibration values
ii. Reference network stability analysis iii. Displacement data
X,Y,Z
X*,Y*,Z* Z
Y
Results and Discussion
The results of the zero errors value and accuracy of various material targets where shown in Table 7 and Table 8. This is to show the constant value of non-prism material.
Table 7. Zero error, standard deviation, fisher test and T-student test of various target surfaces
Table 8. Measurements accuracy
Constant Value Scaling Factor
a (mm) global test is presented in Table 7. The critical value is obtained from Fisher table with 95% significance level and 14 degree of freedom. Table 7 shows the F-computed is lower than 1.70 which indicates that there is no outlier in the data. The result of the zero error and its precision is given in Table 7.
Referring to the result in the Table 7, black material target yields the biggest value of zero error (7.054 ±2.213E-03 millimetres). Prism target gives the smallest value (0.093 ±7.092E-04 millimetres). To check the significance of the zero error value, t-student statistical test was carried out in this study. The critical value of t-table is 2.145 with 95% significance level and 14 degree of freedom. Table 7 depicts the result of t-test for zero error. The table shows that the t-computed for all targets are larger than 2.145 which indicate that the zero error is significantly exist in this baseline measurement. It means that the error is occurred on instruments, so that the appropriate value should be directly appliedto each baseline which observed using Reflector-less TS instrument.
12.130 ppm) than the value as mentioned in the instrument specification ± (10 mm + 10.000 ppm). Prism target gives the smallest value (1.031 for a, and 2.040 ppm for b) but the scaling factor is still bigger than the specification.
Referring to result in Table 9, the inner angles differences between epochs 1 observed by MTD on 12/12/03 using TS set Sokkia SET 5B and Reflector-less
TS data observed on 05/01/08 was 07”, this shows that the angle is below then 30” described by survey regulation. The ratio distances are 1:23102 for line
44-45 and 1:76784 for line 44-43. The results show that the ratio value is better then 1:8000 as described by survey regulation.
Table 9. Datum Verification between Epoch 1 by MTD on 12/02/03 and Epoch 2 By Reflector-less TS on 05/01/08
Difference Remarks Line Bearing Distance 12/02/03
and
Table 10. Datum Verification between Epoch 2 by Reflector-less ts on 05/01/08 and Epoch 3 By Reflector-less TS on 07/06/08
Difference Remarks Line Bearing Distance 05/01/08
and
instruments observed on 07/06/08 was 05”, this shows that the angle is below then 30” described by survey regulation.[8] The ratio distances are 1:115510
From the GPS observation the result shown that MTD used Malaysia RSO coordinates system. This is to ensure that the objectives of the research to compare the coordinate between the reflectorless TS and TS technique achieved. As shown in Table 11.
Table 11. Comparison result between results of GPS vs. TS (MTD)
Easting Northing Height
MTD 372720.072 507780.809 1299.214
GPS 372720.0558 507780.8269 1299.1521 Different 0.0162m -0.0179m 0.0619m
From the table above, the difference between GPS and TS is only in centimeters (Easting 1.6cm, Northing 1.7cm and height 6cm). This indicates that the station is still stabile and using the same of coordinates system. The possibility error occurs because of centering when the instruments were set up, and precision differences of the measurement between both instruments.
Table 12. Mean of Coordinate Difference
Point N(m) E(m) H(m)
1 0.000 0.003 -0.001
2 0.000 0.003 0.000
3 0.002 -0.012 0.003
4 -0.003 0.005 0.005
5 -0.006 -0.024 -0.014
6 -0.002 0.004 0.001
Analysis in mass movement is also referred to the mean and standard deviation of coordinate difference. Table 12 shows the mean value of the coordinate difference in each point of the N and E direction and H. The difference was calculated from the coordinate at first epoch minus coordinate at each other epoch in each E, N and height. This mean was determined by averaging coordinate difference of 3 epochs measurement. Table 12 indicates there are a slightly differences mean of N, E and H. The biggest and smallest value of N mean is -0.017m and 0.0m. -0.057m and 0.00m are the biggest and smallest value of E mean respectively. Further, the biggest of H mean is -0.031m and the smallest of H mean is 0.00m.
The critical value of z-test with 95% confidence ellipse were calculated,
from equation (3) the horizontal position has a standard deviation of σh = 3.0
mm for all epoch surveys and from equation (2) the vertical position has a
standard deviation of σv = 10.0 mm. The combined (95%) confidence level in
vertical, horizontal and total movement displacement would be:
i. (1.96)sqrt( 9.0 + 9.0) ≈ 8.3 mm or 0.008 m at 95% confidence in the horizontal
ii. (1.96)sqrt( 100+100 ) ≈ 27.7mm or 0.028 m at 95% confidence in the vertical
iii.(1.96)sqrt(9.0+9.0+100)≈21.3mm or 0.021m at 95% confidence in the total movement
Table 13. Comparison Magnitude Movement Results between Epoch 1(prism) and epoch 2 - 07/07/07 vs05/01/08
Point no.
Magnitude Movement Direction Azimuth Vertical Horizontal Total
Move.
Table 14. Comparison Magnitude Movement Results between Epoch 1(prism) and epoch 3- 07/07/07 vs 07/06/08
Point no.
Magnitude Movement Direction Azimuth Vertical Horizontal Total
13 0.000 0.039 0.039 45°00’00” 14 -0.003 0.007 0.008 42°45’20” 15 -0.023 0.023 0.033 35°22’40” 16 -0.008 0.019 0.021 42°45’22” 17 -0.009 0.021 0.022 42°30’15” 18 -0.018 0.030 0.035 40°42’10” 19 -0.025 0.106 0.109 44°13’44” 20 -0.002 0.002 0.003 36°41’57”
The magnitude movement in Table 14 was taken in the duration of a year. The direction is azimuth angle from station in first epoch to the station in last epoch at the same station, as shown in Table 13 and 14. Each of the monitoring points moving in same direction in first quadrant. This indicated that the mass movement will appear in one direction of the cutting edge of the slope. Based on the z-test 95% confidence level there was lesser significant movement shown at table 13. Only at point 3 and point 19 show that the horizontal component exceeds the expected survey error margin. This is likely due to actual movement of point in the horizontal plane.
As shown in Table 13, it can be declared that there are significant movement in terms of magnitude movement at most of the points except at point 1, point 14 and point 20. The biggest vertical value is at point 10. Point 19 has the biggest horizontal and total movement which is 0.106m.
Conclusion
REFERENCES
[1]. Savvaidis, P. (2003).Existing Landslide Monitoring Systems and Techniques, From Stars to Earth and Culture, School of Rural and Surveying Engineering, The Aristotle University of Thessaloniki, p. 242-258
[2]. Anonym, (2002), Structural Deformation Surveying (EM 1110-2-1009), US Army Corps of Engineers, Washington, DC
[3]. Bernama (2002). Kronologi tanah runtuh di seluruh negara, Utusan Malaysia. 21 November.
[4]. Land Victoria, 2002, EDM Calibration Handbook, 7th ed, Department of Natural Resources and Environment, the state of Victoria, 2002. Available at: http://www.land.vic.gov.au/land/
[5]. Anonymous, Deformation Surveys and Analysis
http:// www.usace.army.mil/publications/eng-manuals/]
[6]. Chen, Y.Q., A. Chrzanowski, and J.M. Secord, (1990), A strategy for the analysis of the stability of reference points in deformation surveys, CISM Journal ACSGC, Vol.44, No. 2, pp. 141-149.
[7]. Anonymous, (2002), Peraturan ukur Kadaster 2002, JUPEM, BAB III Pengukuran, [24] Datum (1-(b) ) pp. 10
[8]. Kuang, S.L., (1991), Geodetic Network Analysis and Optimal Design: Concepts and Applications. Ann Arbor Press, Chelsea, Michigan.
[9]. Malone A., (2007), Report on Landslide study at CH 23+ 800 Simpang Pulai – Loging Highway Malaysia.