Encoding of Sensing Data for Effective Data Stream
Mining
Dong-Hyok Suh1, Young-Oh Han
1Department of Multimedia Communication, Far East University,
Eumseong, Chungbuk, 369-700, Korea Department of Electronics, Namseoul University
Cheonan city, South Korea
1{[email protected]},{[email protected]}
Abstract : This study proposed an encoding scheme of sensing data for efficient data stream mining the environment which takes into account the frequency analysis and association rule mining of data stream. In this research, sensing data was encoded in the ways of presenting the features of the events detected by sensors and of including the changes of the sensing data stream. Therefore, it was found that the proposed scheme reached the point of reasoning a situation which will be detected and recognized through sensing of multiple sensors.
Keywords : Stream Data mining, Sensor data processing, Context inference
1.
Introduction
Sensors detect the information about an object with a sensor and about the surroundings of the object, and report it to a host. By adopting heterogeneous multiple sensors, they can make the information become higher quality. Sensors do sensing work at a fixed interval and report the sensing information to a host. In this case, they have the criteria as to whether signals are reported or not, and filter data in accordance with the criteria. The process is called data filtering. Sensors compare the value detected at each time zone with certain criteria to see if there is a noticeable increase or decrease. And if so, they report to a host. Something detected and reported by a sensor is called event information. The sensor data containing the event information is not ordinary and has the change to see.
As for data stream mining, frequency analysis and association rule mining have mainly been conducted. In those cases, if the data from a sensor is described as the absolute value measured by a sensor, several cumbersome calculation steps are required. Accordingly, to analyze data stream, it is necessary to convert the signals or data from a sensor into symbols or numbers.
There are two reasons for encoding the data from a sensor. First, the sensing data
transmitted from a sensor is a continuous value and constantly grows in size. So it is necessary to convert them into simpler symbols or numbers to be processed.
The second reason for encoding is to analyze data stream efficiently. Given association rule mining and semantic analysis, the way of converting the sensing values reasonably can be useful.
This study proposed an encoding scheme of sensing data for efficient data stream mining in the environment which takes into account the frequency analysis and association rule mining of data stream.
This thesis is comprised of the following: in chapter 2 relevant studies are described; in chapter 3 an encoding scheme of sensing data for efficient data stream mining is proposed; in chapter 4 the proposed scheme is evaluated and verified, and the result is described; and in chapter 5 the conclusion of this study is described.
2
Previous Studies
Data stream analysis has actively been conducted in various fields. In particular, with a rising necessity of big data application, research on sensing data, a sort of big data, has drawn more attention.
The typical research subjects of data stream analysis are 'frequency analysis' and 'association rule'. Frequency analysis focuses on recognition of the frequency of events among all data. The scheme introduced in the analysis is sliding window technique in which a certain time interval is set to a window. So the frequency analysis scheme recognizes the frequency of events occurring in a relevant window, and moves the window with the lapse of time to recognize the frequency of events in the next time zone.
At the time of mining the conventional database, the analysis of association rules is frequently conducted. The association rule analysis has also been applied actively to data stream. Association rule analysis includes the analysis of recognizing other events which occur in association with specific events and the analysis of other events which occur in serials in a fixed interval.
3 Encoding of Sensing Data for Data Stream Mining
The way of using the sensor data as absolute values causes inconvenience for data stream analysis. The values obtained by multiple sensors have different physical properties. So to process the data from multiple sensors, it is necessary to convert them into symbols or numbers in a different system reflecting the features and properties of the measured values.
The proposed scheme in this thesis reflects only the change of the value detected by a sensor, but presents the value including the type and change of a sensor. As for the change of a sensor, two ways are described: one is to compare with a previous sensing value to present a variation; the other is to set the criteria of changes and compare with the criteria.
The total set of data stream after n unit time is represented as DS={D1,D2,D3,...,Dn}, and
According to the k number of sensor types, the matrix Dk with k rows and 1 column is created.
A change means the continuous relationship between the numerical values in the direction of positive time for a random Dk matrix.
When sensor data become numerical values, what is basically considered is to present how much measured values change.
The criteria of presenting the change are shown as follows: first, the change is presented as the value drawn from a comparison with the value measured in the previous time zone, or a comparison change value. It is shown in the below formula.
(matrix delta)(relative n) = Dn-Dn-1
Secondly, the specific criteria by sensor are set up, and the absolute change drawn from comparison with the criteria is presented for the change. It is shown in the below formula.
The absolute change for the threshold omega is: (matrix delta)(absolute n) = Dn-(omega)
Such a change is different depending on sensors. The physical property of the measured value of each sensor is different. The change measured by each sensor is also different. The changes measured by sensors need to be normalized.
The normalization scheme is displayed as follows: i(m,1)n = |σ(d(m,1)n)|
(σ(x) is sigmoid function, and its median value complies with threshold omega. The result value is one within -1<=σ(x)<=1. The range of the positive m is equal to 1<=m<=k).
Here d(m,1) means the element of the row m and column 1 of matrix delta. The elements of I = i(k,1) matrix are the normalized changes of each sensor. Here, sensors are heterogeneous ones with different functions. So for the analysis of data stream, it is very useful to present the source sensor of each sensor data. The positional information on sensors used for measurement is very essential to situational reasoning.
The scheme of presenting the sensor data including the information about the change of a sensor and about the measurement position of sensors is proposed as follows:
In (=i(k,2), in the row 2, the sensor types of the data values in the row 1 are described; n in the matrix means that the reporting time point is n unit time.)
To sum up the proposed scheme, the sensor data includes the change of sensors, the type of sensors, and the measurement position of sensors.
4
Evaluation
To prove the suitability of the proposed scheme, it was evaluated in the following two aspects:
BPA can be calculated. Based on BPA, it is possible to calculate each focal element of DST, or the number of cases of situational factors comprised on the basis of sensor types, and the reliability of each situational factor. Temperature, humidity and illumination sensors were adopted, and the data reported by sensors via a sink node were recorded as shown in the table 1.
Table.1 Time-based measurement values detected and reported by temperature, humidity and illumination sensors
Time(s) Temperation(℃) Humidity(%) Ilumination(Lx)
1 23.5 65.4 105
2 23.5 65.4 104
3 23.6 65.3 105
4 23.7 65.3 106
5 23.6 65.4 106
6 23.6 65.4 105
7 23,6 65.3 106
8 23.5 65.5 106
9 23.6 65.3 106
10 23.7 65.3 105
11 24.0 64.8 251
12 24.5 63.5 178
13 24.7 63.2 106
14 25.2 62.1 98
15 26.8 62.1 105
The sensor data recorded in the table 1 were converted into the values in the table 2.
Table.2 The result from conversion of the measurement values detected and reported by temperature, humidity, and illumination sensors
Time(s) Temperation(℃) Humidity(%) Ilumination(Lx)
12 [0.5, 0.5] [1.3, 1.5] [73.0, 68.0] 13 [0.2, 0.7] [0.3, 1.8] [72.0, 4.0] 14 [0.5, 1.2] [1.1, 2.9] [8.0, 12.0] 15 [1.6, 2.8] [0.0, 2.9] [7.0, 5.0]
Based on the converted values, the entire power set was comprised. Each element of the set is called a focal element which is shown in the table 3. Each BPA calculated with the changes was recorded in the table 4.
Table 3. Focal elements and Power set
Focal element
H1 H2 H3 H1∩H2 H1∩H3 H2∩H3 H1∩H2∩H3
Tempe ration
Humd ity
Ilumi nation
Temp.+ Humd.
Temp.+ Ilum.
Humd.+I Ilum.
Temp.+Humd. + Ilum
Table 4. BPA by focal element
Focal
element H1 H2 H3 H1∩H2 H1∩H3 H2∩H3 H1∩H2∩H3
BPA 0.132 0.223 0.049 0.227 0.161 0.021 0.187
When each BPA by focal element is calculated, DST is applied to calculate each reliability by focal element. Focal elements mean situational factors that affect an event or a situation which can occur. By using the reliability of each focal element, it is possible to reason a situation. The table 5 shows the reliability of each focal element.
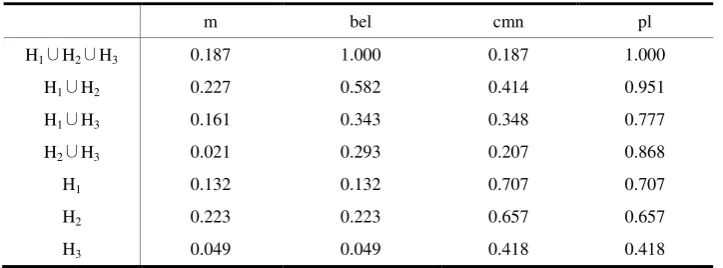
Table 5. reliability of each focal element
m bel cmn pl
H1∪H2∪H3 0.187 1.000 0.187 1.000
H1∪H2 0.227 0.582 0.414 0.951
H1∪H3 0.161 0.343 0.348 0.777
H2∪H3 0.021 0.293 0.207 0.868
H1 0.132 0.132 0.707 0.707
H2 0.223 0.223 0.657 0.657
H3 0.049 0.049 0.418 0.418
highest reliability. It indicates that among many factors affecting a situation or situational factors, the fourth factor gives the strongest influence on the situation.
In addition, the reliability of the fourth factor increases with the lapse of time. It means that the situation affected by the factor constantly spreads and that the causes affecting the situation constantly work. In other words, it indicates that an event gets worse.
5
Conclusion
This study proposed an encoding scheme for various sensor data being reported constantly. The encoding scheme for the constantly reported and transmitted sensor data makes possible more accurate analysis than frequent pattern scheme and association rule scheme do. A sensor aims to recognize the high-quality information about the state and activity of its monitoring object from a long distance. Through the encoding scheme for sensor data, this study suggested that it would be necessary to encode sensor data in a reasonable and valid way in order to perform situational reasoning and extract a variety of high-quality information even in the data stream environment where the continuously transmitted massive sensor data are analyzed one time. In the future, it is necessary to study more detailed schemes to recognize situations in the data stream environment.
References
1. Jong-Hwan, K.,: Ubiquitous Robot, http://rit.kaist.ac.kr, Research topics Intelligent Robotics, December(2009)
2. Garofalakis, M., Gehrke,J., and Rastogi, R.,: Querying and mining data streams: you only get one look a tutorial. In the tutorial notes of the 28th Int'l Conference on Very Large Databases, Hong Kong, China, pp. 635- 635, Aug(2002)
3. Joong Hyuk, C.,and Won Suk, L.,: Finding recent frequent itemsets adaptively over online data streams: Proceedings of the ninth ACM SIGKDD international conference on Knowledge discovery and data mining, pp. 487-492, August( 2003)
4. Shin,S.J., and Lee, W.S.,: On-line generation association rules over data streams: Proceeding of the Information and Software Technology Journal, Vol. 50, Issue 6, pp. 569-578, June(2007)
5. Deligiannakis, A., Kotidis,Y., and Roussopoulos,:Hierarchical In-Network Data Aggregation with Quality Guarantees: LNCS(EDBT 2004),(2004)
6. Chen,G., Wu,X., and Zhu, X.: Mining Sequential Patterns Across Data Streams: Univ. of Vermont Computer Science Technical Report(CS-05-04)(2005)
7. Yang, L.H., Lee, M.L.,and Hsu,W.: Finding Hot Query Patterns over An XQuery Stream: VLDB Journal Special Issue on Data Stream Processing(2004)
8. Hwang,J.H., and Gu, M.S.,: Finding Frequent Structures in XML Stream Data: Computational Science and Its Applications, ICCSA(2009)
9. Hsieh, M.C., Wu, Y.H., and Chen, A.H.,: Discovering Frequent Tree Patterns over Data Stream: In Proc of SIAM( 2006)
10. Leung, C.K.S., Khan, Q.I., and Hoque,T.: CanTree: A Tree Structure for Efficient Incremental Mining of Frequent Pattern Sets: In proc. ICDM( 2005)