EVALUATION OF RECEIVED SIGNAL STRENGTH INDICATION OF BLUETOOTH LOW ENERGY ON DISTANCE ESTIMATION
Willy Dharmawan*, Andi Kurnianto, Retnawati
Pusat Teknologi Elektronika, Badan Pengkajian dan Penerapan Teknologi Kawasan Puspiptek Serpong, Gedung Teknologi 3, Serpong - Tangerang Selatan 15314.
*
Email: [email protected]
Abstract
The concept of using short-range radio technologies to connect group of small devices to internet or capillary networks are significant on IoT. On certain use case, such as localization, BLE (Bluetooth Low Energy) as novel wireless short range radio technology has tremendous potential for enabling coverage of localization network. However, due to its wireless nature, it runs into phenomena such as multipath effect. Therefore, analysis of radio propagation model plays important role in performance evaluation on both theoretical and practical aspect. There are several theoretical evaluations of path loss exponent on different place in the literature. However, there is a lack of experimental evaluation. In this paper, we experiment the measurement in free space, indoor hall, and closed room, where BLE nodes are generally deployed. Log normal model is used in order to evaluate the experimental analysis. Path loss exponent are measured by means of Received Signal Indicator or RSSI. Those parameter are compared with theoretical analysis, which is available in literature. Overall, we obtained minimum MAE (Mean Absolute Error) on indoor hall environment 1.9974 meter for practical PLE, while on PLE theoretical, we obtained 6.2494 meter. This difference shows importance of PLE calibration in RSSI distance estimation..
Keywords: Bluetooth Low Energy, Path Loss Exponent, RSSI
Abstrak
Konsep penggunaan teknologi short range radio untuk menghubungkan perangkat-perangkat kecil ke internet atau disebut capillary networks berperan sangat penting pada perkembangan IoT (Internet of Things). Pada kasus tertentu, seperti penentuan lokasi, BLE (Bluetooth Low Energy) sebagai teknologi wireless short range radio baru memiliki potensi yang cukup besar untuk memungkinkan coverage pada suatu localization network. Meskipun begitu, oleh karena sifat wireless-nya, sinyal BLE mengalami fenomena multipath. Oleh karena itu, analisis dari model propagasi radio memiliki peran yang cukup penting dalam evaluasi performansi teoritis dan praktis. Ada beberapa evaluasi teoritis terkait PLE (Path Loss Exponent) di dalam literatur. Meskipun begitu, terdapat kekurangan terhadap evaluasi experimental. Pada paper ini, kami mencoba melakukan pengukuran pada beberapa kondisi yaitu, free space, koridor dalam ruangan, dan ruangan tertutup, dimana node dari BLE umumnya dibangun. Model log normal digunakan untuk evaluasi secara eksperimental. PLE diukur dengan menggunakan RSSI (Received Signal Strength Indicator). Parameter tersebut dibandingkan dengan analisis teoritis yang ada di literatur. Secara keseluruhan, kami memperoleh MAE (Mean Absolute Error) minimum pada kondisi koridor di dalam ruangan sebesar 1.9974 meter untuk PLE praktis, sedangkan untuk PLE teoritis diperoleh MAE sebesar 6.2494 meter. Perbedaan ini memperlihatkan pentingnya kalibrasi PLE dalam estimasi jarak menggunakan metode RSSI.
Kata kunci: Bluetooth Low Energy, Path Loss Exponent, RSSI
1. INTRODUCTION
viewpoint because of low cost (Anonymous, 2015, https://www.blesh.com/mobile-phones-pcs-tablets-rely-on-bluetooth-for-wireless-connectivity-set-the-stage-for-in-home-automation-hubs/).
The usage of BLE as beacon in localization system needs an accurate distance estimation. Software development kit, which is provided by BLE vendor, doesn’t account for different path loss exponent, therefore the estimate distance won’t be accurate. It needs a further calibration on path loss exponent to improve the result of distance estimation.
There are various phenomena that induce the path loss. Those are reflection, diffraction, fading, shadowing, etc. There are a large number of theoretical analysis on path loss exponent estimation, without considering the practical measurements and environmental conditions. General large-scale path loss analysis for mobile communications like GSM can be found in (Rappaport, 2001), which works on severals distinct bands like 900MHz. There are also practical path loss exponent analysis on wireless sensor network in (Miranda et all, 2013) . However, it is not specifically on BLE.
In this paper, we present practical analysis on Path Loss Exponent. We also evaluate distance estimation using RSSI by comparing difference in distance between the theoretical and practical model. From each of those, Mean Absolute Error (MAE) is calculated to know how close distance estimation is to ideal outcomes. Based on this, we will know the effect of practical path loss exponent to distance estimation presented in this paper.
2. PROPAGATION MODEL
In the literature, there are numerous empirical and deterministic model of indoor propagation. However, this paper focus on empirical model such as log normal model, because of its practicality and implicitness environmental influences. On the other hand, deterministic model usually requires a large database, which is sometimes impractical or impossible to obtain. Moreover, deterministic model usually use a complex algorithm and lack of computational efficiency. Therefore, implementation of deterministic model is commonly restricted to smaller areas of indoor environment (Tummala, 2005).
2.1 Model Log-Distance Path Loss
The path loss of free space model is an ideal transmission case. Multiple factors affecting signal propagation, such as multipath, obstacle and so forth, are omitted in this model. The linear relationship between signal transmission energy and transmission distance is written as follows:
(1)
In this formula, loss indicates as path loss of signal energy, d indicates as signal transmission distance, f indicates as wireless transmission frequency and n indicates path attenuation factor in actual environment.
However, wireless sensor signal application environment won’t be free space, commonly, it applies in obstructed area such as office, industrial sites, and so forth; it need to consider multipath effects, absorbance of obstacle, and so forth. Therefore, average large scale path loss for separation d between transmitter and receiver is expressed as function of distance using path loss exponent, n. According to (Rappaport, 2001), the formula is as follows:
̅̅̅̅̅̅̅̅ ̅̅̅̅̅̅̅̅̅̅ ( ) (2)
Table 1. Path loss exponent for different environments (Rappaport, 2001) Environment Path loss exponent, n
Free space 2
Urban Area cellular radio 2.7 to 3.5
Shadowed Urban Cellular Radio 3 to 5
In building line-of sight 1.6 to 1.8
Obstructed in building 4 to 6
Obstructed in factories 2 to 3
2.2 Log Normal Shadowing
Random shadowing effects occuring over a large number of measurement locations which have the same T-R separation, but different levels of clutter on the propagation path is referred to as Log-Normal Distribution. This phenomenon is refer to log normal shadowing. the formula is as follows:
̅̅̅̅̅̅̅̅ ̅̅̅̅̅̅̅̅̅̅ ( ) (3)
Where Xσ is a zero mean Gaussian distributed random variable with theoretical deviation σ. Xσ is in dB; Reference distance d0, path loss exponent and theoretical deviation σ, statistically describe the path loss model for an arbitrary location on specific transmitter-receiver separation.
3. EXPERIMENTAL SETUP AND MEASUREMENT 3.1 Beacon
As kontakt’s extensiveness and notableness, we used kontakt beacon as measured signal
source. We set the RSSI (Received Signal Strength Indication) value to 4 dbm (maximum value) and the interval advertisement value to 250 ms (default value).
Figure 1. Kontakt’s beacon
3.2 Measurement Device
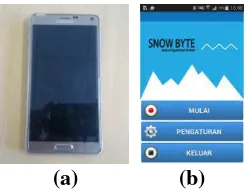
The measurement is done using Samsung Galaxy Note 4 which is certainly support with Bluetooth Low Energy. Custom testbed application, which uses android Bluetooth LE library and supports with android 5.0, is installed on this smartphone. This testbed was set into 40 minutes measurement time as well as 5 seconds for pre-measuring.
(a) (b)
3.3 Measurement Setup
Experiments were carried out in Electromagnetic Compatibility (EMC) chamber, indoor hall room, and closed room. All of these is done with different distance scheme, 1, 2, 3, 4, 5, 6, 7, 8, 9 and 10 meter. During the measurement, beacon position is on line with smartphone position with 2 meters height. The position of Smartphone is standing up as well as beacon position with the back of smart phone faces the front of beacon. The measurement duration on each measurement is 40 minutes.
3.4 Acquisition of RSSI Data
RSSI is obtained through BluetoothLeCallback on ScanResult with public method getRssi(). One of the significant advantage of using api 21 library for Bluetooth low energy is setting up the scanning mode. With this, we can set the smartphone scanning duty cycle. On this paper we set the scanning into the highest duty cycle as we intend to get the sample of data as much as possible. We also filtering the received data using ScanFilter.
4. MEASUREMENT RESULT AND ANALYSIS 4.1 Chamber
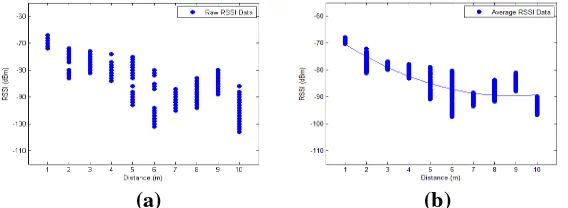
The result of these experiments is shown in Figure 5. The raw RSSI data is shown in Figure 5 (a) and the average of every 10 raw data rssi is shown in Figure 5 (b).
(a) (b)
Figure 5. (a) Plot of RSSI Raw Data in Chamber, (b) Average of RSSI Data in EMC Chamber.
The result presented in Figure 5 (a) shows a similar behavior (Dahlgren, 2014) with great variance in measured RSSI values on each location. Therefore, it is hard to estimate the distance. However, it may coarsely estimate the distance with average of RSSI data, as shown in Figure 5 (b).
In order to exactly describe the actual measurement environment and ensure the accuracy of distance estimation using RSSI, the parameters of signal propagation model are calculated. We set A or p(d0) as on (1) with 1 meter reference distance; there is result that A = -69.3420 dBm. Then, we calculated path loss exponent on each distance, given in Table I. Finally, the final value of the path loss exponent in chamber is 2.1989.
We also want to know the effect of practical path loss exponent. Therefore we have compared MAE between distance estimation using theoretical PLE and distance estimation using practical PLE on each distance. Overall distances, MAE value for Theoretical PLE distance estimation is 3.1264. As predicted, MAE value for Practical PLE distance estimation is smaller that is 2.2297.
4.2 Indoor Hall
(a) (b)
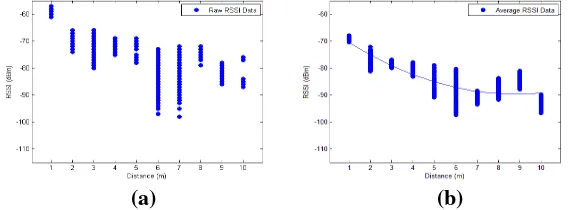
Figure 6. (a) Plot of RSSI Raw Data in Indoor Hall, (b) Average of RSSI Data in Indoor Hall.
As it shows similar behavior with chamber experiment in raw data, it may coarsely estimate the distance with average of RSSI data, as shown in Fig 6 (b).
On this environment, we get A or p(d0) = -58.985 dBm. Then, we calculated PLE on each distance, given in Table 3.
As we calculate mean of PLE, we get result that is in range of PLE theoretical in obstructed factories which is 2.4407. However, we compare it with PLE theoretical in Indoor LOS, arbitrarily 1.8, because it is the real condition of the measurement.
Finally, we calculated MAE value for Theoretical PLE and Practical PLE distance estimation. We get MAE respectively, 6.2494 and 1.9974. Although, there is miss in accuracy on 8m practical path loss exponent, but overall, this is one of good improvement in distance estimation since it shows significant correction on path loss exponent for indoor hall.
4.3 Indoor Closed Room
We have measured BLE RSSI in indoor hall environment, as it is one of place which BLE commonly deployed. The result of these experiments are the raw RSSI data which is shown in Fig 6 (a) and the average of every 10 raw data rssi which is shown in Fig 6 (b).
(a) (b)
Figure 6. (a) Plot of RSSI Raw Data in Indoor Hall, (b) Average of RSSI Data in Indoor Hall.
As it shows similar behavior with chamber experiment in raw data, it may coarsely estimate the distance with average of RSSI data, as shown in Fig 6 (b). On this environment, we get A or p(d0) = -58.985 dBm. Then, we calculated PLE on each distance, given in Table 3.
As we calculate mean of PLE, we get result that is in range of PLE theoretical in obstructed factories which is 2.4407. However, we compare it with PLE theoretical in Indoor LOS, arbitrarily 1.8, because it is the real condition of the measurement.
Finally, we calculated MAE value for Theoretical PLE and Practical PLE distance estimation. We get MAE respectively, 6.2494 and 1.9974. Although, there is miss in accuracy on 8m practical path loss exponent, but overall, this is one of good improvement in distance estimation since it shows significant correction on path loss exponent for indoor hall.
factor in Log Normal Model which determine estimation of received signal strength. Table 5 and table 6 respectively summarizes PLE on each measurement, chamber, indoor hall, and closed room and MAE between the theoretical and practical PLE.
Table 2. Practical path loss exponent on each measurement environment
Environment Path loss exponent, n
Chamber 2.1989
Indoor Hall 2.4407
Closed Room 1.8356
Table 3. Mean absolute error of theoretical and practical PLEon each measurement environment data verifies the theoretical analysis, available in literature. However, there is quite mismatch in indoor hall PLE, which is obtained from our measurement environment and is in range of obstructed factories. Therefore, it shows that you should not count on theoretical PLE, instead of doing measurement to get calibrated PLE. This improves coarse distance estimation which directly improves accuracy.
As future work, applying filter before distance estimation could improve distance estimation, such as particle filter. This will help in determining fine distance estimation.
ACKNOWLEDGMENT
The author wish to thank the Telecommunication & New Media Laboratory in Pusat Teknologi Elektronika for financial support.
REFERENCES
Bluetooth Smart/Bluetooth Low Energy Market: Applications (Consumer Electronics, Healthcare, Sports & Fitness, Retail, Automotive, Security). (2015, January 11). Retrieved from http://industryarc.com/Report/187/Bluetooth-smart-market-forcast.html.
Dahlgren, Erik, Hasan, Mahmood. Evaluation of indoor positioning based on Bluetooth Smart Technology. Thesis For Master Science in Programme Computer Systems and Network, Chalmers University of Technology, June 2014, pp. 59-63.
Dong, Qiang, Dargie, Waltenegus. Evaluation of the Reliability of RSSI for Indoor Localization. IEEE Wireless Communications in Unusual and Confined Areas (ICWCUCA), 2012.
J. Bachrach and C. Taylor, “Localization in Sensor Networks,” Handbook of Sensor Networks: Algorithms and Architectures, I. Stojmenovic, Ed., Wiley, Sept. 2005.
Jung, Joonyoung, Dongoh, Kang, and Changseok, Bae. Distance Estimation of Smart Device using Bluetooth. Personal Computing Platform Research Team Electronics and Telecommunications Research Institute Deajeon, Korea, ICSNC 2013.
Miranda J., Abrishambaf T., et all. Path Loss Exponent Analysis in Wireless Sensor Network: Experimental Evaluation. Conference Paper of Researchgate, University of Minho, July 2013.
https://www.blesh.com/mobile-phones- pcs-tablets-rely-on-bluetooth-for-wireless-connectivity-set-the-stage-for-in-home-automation-hubs/.
T. Rappaport, Wireless Communications: Principles and Practice, 2nd ed. Upper Saddle River, NJ, USA: Prentice Hall PTR, 2001.
T.S. Rappaport, “Wireless Communication Principle andPractice,” Prentice Hall, 1996.