P-ISSN.2503-0817, E-ISSN.2503-0825
CrossMark
Abstract
Objective: Patient satisfaction against the quality of dental health serviceswas a comparison between the perception of care received by expectation before getting treatment. The Research was conducted at Tenriawaru General Hospital in Bone Regency based on the five dimensions of service quality, they were the assurance, empathy, responsiveness, physical appearance and medical services by using Likert scale.
Material and Methods: The study was descriptive with a sample of 65 people. The research subjects were all visitors (patient) Dental Polyclinic of Tenriawaru General Hospital in Bone Regency.
Results: Showed patient satisfaction on dimensions of assurance 84.6% falling into the category satisfied. On the dimensions of empathy showed 81.5% of patients satisfied. On the dimensions of responsiveness showed 36.9% of patients satisfied. On the dimensions of physical appearance showed 84.6% of patients satisfied. On the dimensions of medical services showed 72.3% of patients satisfied.
Conclusion: Patients satisfied against the quality of dental health services at Tenriawaru General Hospital in Bone Regency.
Keywords: Patient satisfaction, The quality of dental health services
Cite this Article: Akbar FH, Pratiwi R. 2016. Patient Satisfaction against the quality of dental health services at dental polyclinic of Tenriawaru General Hospital in Bone Regency. Journal of Dentomaxillofacial Science 1(3): 177-184. DOI:10.15562/jdmfs.v1i3.313
Patient satisfaction against the quality of dental
health services at dental polyclinic of Tenriawaru
General Hospital in Bone Regency
Fuad H. Akbar,*Rini Pratiwi
Itroduction
Along with improving the level of public educa-tion, increasing socio-economic condition of society, as well as the ease in transportation and communication led to information more easily available, in addition to the advancement of science and technology (science and technology) as well as the rapid information system resulted in values in society changed. As a result, people tend to demand higher quality public services, then the service functions in hospitals, health centers, and private practice dentists gradually need to be improved to be more effective and efficient and give satisfaction to patients, families and communities.1
In this case the health service, as one of the factors that contributes to achieving these objec-tives, improving quality of care facilities required of existing health facilities, among others, hospitals, health centers and dental practices. To achieve the goal of health development according the National Health System (NHS), the government in this case the RI Health Department has developed a founda-tional concept and direction. As a guideline for the implementation of health development, that more health programs aimed at improving the quality of health care, quality means customer satisfaction (patients) are very closely related to the quality of health care.1
Health development agenda in 2015-2019 is to achieve access to and quality of health care is growing steadily. Understanding basically is, everyone gets the right to health care as needed, in the health service standards, served by a qualified healthcare professional, using the stan-dard service, at an affordable cost and to obtain adequate information on their own health care needs.2
The decline in the utilization of health services, caused by access to health care are increasing but still low quality or lack of efficiency and effectiveness in delivering services provider to the community. The problems can be known by more and more audible to public complaints about the quality of health services ranging from physical conditions that bad, officer attitude or the way they are served, the system complex bureaucracy, quality of care and treatment are low, working hours are short lead patients can not dilayani.3The decline in the utilization of dental and oral health services is also influenced by the level of patient satisfaction with the quality of dental and oral health services.4
Dental care and oral health care professionals who are devoted to the community, families and individuals both diseased and healthy. Dental care taken to maintain and improve public Department of Dental Public
Health, Faculty of Dentistry, Hasanuddin University, Makassar, Indonesia
*Correspondence to: Fuad H. Akbar,
health in the form of dental health improvement, prevention of dental diseases, dental disease treatment and dental health recovery by the government done in an integrated, integrated and sustainable.5
Regional General Hospital Tenriawaru Bone Regency is the largest hospital owned by the government in Bone regency and the only hospi-tal that has Poly Clinic Denhospi-tal and Oral visited by people who come from a wide range of social status backgrounds and different interests. In addition, this hospital as a referral center of several areas in the surrounding.6
Based on the background of the problems described above, the formulation of the problem this research is how patient satisfaction with quality dental care at Dental Clinic Regional General Hospital Tenriawaru Bone regency. The purpose of this study was to determine patient satisfaction with quality dental care at Dental Clinic Regional General Hospital Tenriawaru Bone regency.
Material and Methods
Type of research is observational. Design study is a cross sectional study site ie dental clinic tenri-awaru district hospitals. bone research conducted on 29 June-11 July 2015 study subjects were all visitors (patient) Hospital dental clinic tenriawaru bone districts during the month of June-July were willing to fill out a questionnaire after treatment. inclusion of all visitors at the dental clinic hospital district tenriawaru bone aged over 13 years and besedia filled out a questionnaire after treatment. The exclusion of patients who are not willing to fill out a questionnaire after treatment.
Measuring the level of satisfaction questionnaire was used for dental and oral health services to the distribution of the sample according to gender, age, education, funding source and the frequency of visits. Questionnaires were used by Ristoria Simbolon with a slight change. Questionnaires in dental and oral health services consists of 22 ques-tions with five dimensions, ie assurance, empathy, responsiveness, physical appearance and the effectiveness of medical services. The results of the sample answers are accumulated and converted into a category of overall satisfaction. All the results are collected and further research is done processing and analyzed using SPSS.
Results
We report the description of levels of patient satis-faction with service quality dental care at Dental
Clinic Regional General Hospital Tenriawaru Bone. This research was observational descriptive study site located in hospitals Tenriawaru Bone. The study was conducted on June 29 to July 11, 2015. The sample is all visitors (patients) that met the selection criteria predefined sample. The amount of the overall sample are 65 people with the fragile age of 13-75 years.
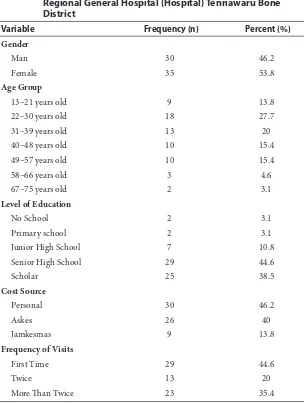
Results of the study appear in the table of distribution as follows: table 1 number of samples in this study was 65 (100%) which consisted of 30 men (46.2%) and 35 women (53.8%). Samples were aged 22-30 years is a sample with the highest frequency, ie 18 people (27.7%). By level of educa-tion, most samples are high school (SMA) with the number of 29 people (44.6%). In addition, samples of which came in the District Hospital Bone Tenriawaru more who use the personal cost that is 30 people (46.2%) compared Askes is 26 people (40%). Based on the frequency of visits, most of the samples that came in Hospitals Bone Tenriawaru first time, as many as 29 people (44.6%).
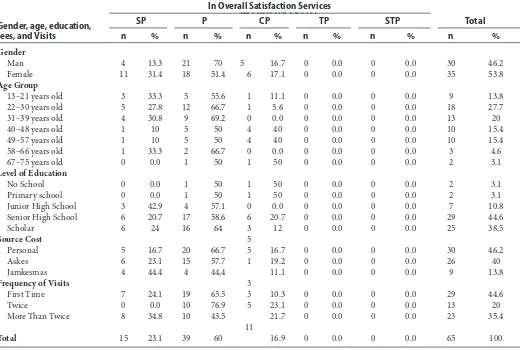
Table 2 shows the distribution of satisfaction of dental and oral health services overall based on gender, age, education, costs and frequency of visits. The results showed that the number of men with category are satisfied (70%) more than women (51.4%), but the number of women (31.4%) are very satisfied with the category more than men (13.3%). The observations also show that the age categories are very satisfied with the level of satisfaction that most of the age of 13-21 years and 58-66 years, each with a percent-age of 33.3%.
The data in table 3 shows the sample satis-faction for the quality of dental and oral health services in terms of the dimensions of security services. At the confidentiality of the disease the patient is awake as many as 37 people were satis-fied, 16 people feel very satissatis-fied, 10 people feel quite satisfied, 2 were dissatisfied. Explanation of working procedures/measures total of 37 people who were satisfied, 14 people feel very satisfied, 13 people feel quite satisfied, one person was not satisfied. Ability and knowledge of dentists handle patient complaints as many as 35 people were satisfied, 20 people feel very satisfied, 9 people feel quite satisfied, one person was not satisfied. The explanation is easy to understand the results of as many as 39 people were satisfied, 16 people feel very satisfied, 9 people feel quite satisfied, one person was not satisfied.
Based on data in table 4 to the sample satis-faction service quality oral health care in terms of the dimensions of responsiveness. At a speed of dentists handle patient complaints as many as 28 people were satisfied, 15 people feel very satis-fied, 20 people feel quite satissatis-fied, 2 were dissatis-fied. Responsiveness dentists in resolving patient complaints as many as 28 people were satisfied, 14 people feel very satisfied, 22 people feel quite satisfied, one person was not satisfied. Speed of the administration in providing services as many as 27 people were satisfied, 10 people feel very satisfied, 26 people feel quite satisfied, and two people are not satisfied.
The data in table 5 shows the sample satisfaction for the quality of dental and oral health services in terms of service dimension of empathy, to the atti-tude of sincerity dentists in checking and dealing with patient complaints as many as 39 people were satisfied, 14 people feel very satisfied, 12 people feel quite satisfied. Service delivery regardless of social status as many as 39 people were satisfied, 14 people feel very satisfied, 12 people feel quite satisfied. Attention dentists in providing the service as many as 36 people were satisfied, 15 people feel very satisfied, 13 people feel quite satisfied, one person was not satisfied. Clarity provides informa-tion about the disease as many as 35 people were satisfied, 13 people feel very satisfied, 16 people feel quite satisfied, one person was not satisfied. Clarity gives instructions before the treatment as many as 40 people were satisfied, 9 people feel very satisfied, 15 people feel quite satisfied, one person was not satisfied. Clarity provides instruction after treat-ment as many as 36 people were satisfied, 12 people feel very satisfied, 16 people feel quite satisfied, one person was not satisfied. Clarity of information and attitude of the clerk as many as 39 people were satis-fied, 10 people feel very satissatis-fied, and 16 people feel quite satisfied.
Data table 6 shows the sample satisfaction for the quality of dental and oral health services in terms of service dimension of physical appear-ance, to the appearance of the dentist as many as 42 people were satisfied, 13 people feel very satisfied, 10 people feel quite satisfied. Cleanliness of treatment rooms as many as 44 people were satisfied, 10 people feel very satisfied, 11 people feel quite satisfied. Neatness of the treatment room is 40 people feel satisfied, 12 people feel very satisfied, 13 people feel quite satisfied. Cleanliness waiting room as many as 38 people were satis-fied, 12 people feel very satissatis-fied, 14 people feel quite satisfied, one person was not satisfied. Dental hygiene equipment to check as many as 42 Table 1 Distribution of the sample according to gender, age,
education, source costs, and the number of visits at the Regional General Hospital (Hospital) Tenriawaru Bone District
Variable Frequency (n) Percent (%)
Gender
Man 30 46.2
Female 35 53.8
Age Group
13–21 years old 9 13.8
22–30 years old 18 27.7
31–39 years old 13 20
40–48 years old 10 15.4
49–57 years old 10 15.4
58–66 years old 3 4.6
67–75 years old 2 3.1
Level of Education
No School 2 3.1
Primary school 2 3.1
Junior High School 7 10.8
Senior High School 29 44.6
Scholar 25 38.5
Cost Source
Personal 30 46.2
Askes 26 40
Jamkesmas 9 13.8
Frequency of Visits
First Time 29 44.6
Twice 13 20
people were satisfied, 12 people feel very satisfied, 10 people feel quite satisfied, one person was not satisfied. On the completeness of the equipment
as much as 37 people were satisfied, 11 people feel very satisfied, 14 people feel quite satisfied and three people were dissatisfied.
Table 2 Distribution of the sample by gender, age, education, fee, with the frequency of visits and satisfaction of dental and oral health care at General Hospital (Hospital) Tenriawaru Bone District
Gender, age, education, fees, and Visits
In Overall Satisfaction Services
Total
13–21 years old 22–30 years old 31–39 years old 40–48 years old 49–57 years old 58–66 years old 67–75 years old
Level of Education
No School Primary school Junior High School Senior High School Scholar
Source Cost
Personal Askes Jamkesmas
Frequency of Visits
First Time
Information: STP: very dissatisfied; TP: not satisfied; CP: quite satisfied; P: satisfied; SP: very satisfied
Table 3 Distribution of samples satisfaction for the quality of dental and oral health services based on the dimension of service guarantees
Dimensions Assurance Services
Sample answers by His satisfaction
SP P CP TP STP
n % N % n % n % n %
1. Confidentiality of the
disease the patient is awake 16 24.6% 37 56.9% 10 15.4% 2 3.1% 0 0.0%
2. Explanation of working
procedures/actions 14 21.5% 37 56.9% 13 20.0% 1 1.5% 0 0.0%
3. Ability and knowledge of dentists handle patient complaints
20 30.8% 35 53.8% 9 13.8% 1 1.5% 0 0.0%
4. The explanation is easy to
understand test results 16 24.6% 39 60% 9 13.8% 1 1.5% 0 0.0%
Table 4 Distribution of samples satisfaction for the quality of dental and oral health services based on the service dimension of responsiveness
Dimensional Response Services
Sample answers by His satisfaction
SP P CP TP STP
n % N % n % n % n %
1. The quick a dentist handle
patient complaints 15 23.1% 28 43.1% 20 30.8% 2 3.1% 0 0.0%
2. Responsiveness dentists in
resolving patient complaints 14 21.5% 28 43.1% 22 33.8% 1 1.5% 0 0.0%
3. The quick of the
administration in providing services
10 15.4% 27 41.5% 26 40.0% 2 3.1% 0 0.0%
Information: STP: very dissatisfied; TP: not satisfied; CP: quite satisfied; P: satisfied; SP: very satisfied
Table 5 Distribution of samples satisfaction for the quality of dental and oral health services based on the service dimension of empathy
Dimensions of Empathy Services
Sample answers by His satisfaction
SP P CP TP STP
n % N % n % n % n %
1. The attitude of seriousness dentists in checking and dealing with patient complaints
14 21.5% 39 60.0% 12 18.5% 0 0.0% 0 0.0%
2. Service delivery regardless of
social status 14 21.5% 39 60.0% 12 18.5% 0 0.0% 0 0.0%
3. Attention dentists in providing
services 15 23.1% 36 55.4% 13 20.0% 1 1.5% 0 0.0%
4. Clarity provides information
about the disease 13 20.0% 35 53.8% 16 24.6% 1 1.5% 0 0.0%
5. Clarity provides instruction
before treatment 9 13.8% 40 61.5% 15 23.1% 1 1.5% 0 0.0%
6. Clarity provides instruction
after treatment 12 18.5% 36 55.4% 16 24.6% 1 1.5% 0 0.0%
7. Clarity of information and
attitudes administrative officer 10 15.4% 39 60.0% 16 24.6% 0 0.0% 0 0.0%
Information: STP: very dissatisfied; TP: not satisfied; CP: quite satisfied; P: satisfied; SP: very satisfied
Table 6 Distribution of satisfaction samples to quality dental care and oral based service dimension of physical appearance
Physical Dimensions Display Services
Sample answers by His satisfaction
SP P CP TP STP
N % N % n % n % n %
1. Appearance dentist 13 20.0% 42 64.6% 10 15.4% 0 0.0% 0 0.0%
2. Cleanliness infirmary 10 15.4% 44 67.7% 11 16.9% 0 0.0% 0 0.0%
3. Neatness infirmary 12 18.5% 40 61.5% 13 20.0% 0 0.0% 0 0.0%
4. Cleanliness waiting room 12 18.5% 38 58.5% 14 21.5% 1 1.5% 0 0.0%
5. Cleanliness equipment to check
the patient’s teeth 12 18.5% 42 64.6% 10 15.4% 1 1.5% 0 0.0%
6. Completeness of equipment 11 16.9% 37 56.9% 14 21.5% 3 4.6% 0 0.0%
Based on data in table 7 shows the satisfaction of samples to quality dental care and oral terms of the dimensions of medical services, to ektifitas medical services as many as 35 people were satisfied, 10 people feel very satisfied, 17 people feel quite satis-fied, three people are not satisfied and the benefits of services provided to patients as many as 35 people were satisfied, 12 people feel very satisfied, 17 people feel quite satisfied, one person was not satisfied.
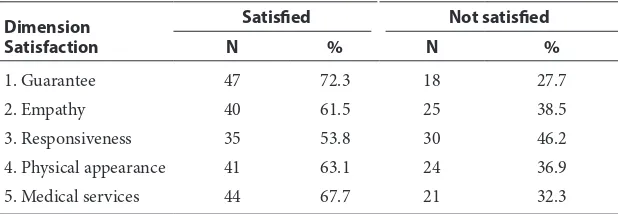
In table 8 shows the sample satisfaction based on dimensions of quality of dental and oral health services in terms of the guarantee, the number of samples with the most satisfied cate-gory is 47 people. Furthermore, the dimensions of medical services by category are satisfied as many as 44 people, then the physical dimensions of the display on the category to settle as many as 41 people and dimensions of empathy as many as 40 people. In the sample of satisfaction in terms of dimensions of responsiveness is the lowest in the category are satisfied with the number of samples is 35 people.
Discussion
The increasing demands of the community will be the quality of health services, the service function should be improved to provide patient satisfac-tion. Patient satisfaction is the current state of desire, expectations and patient needs can be met. Based on sex number of men with more satisfied category of 70% compared to females is 51.4%. This is according to research conducted by Oroh ME, Rompas S and L Pondang stating that the respondents who have a higher level of satisfaction that is male (87.2%). Gender has an influence on the views of the services rendered. Women more detailed look at the appearance, while men do not heed it. How to manage relationships to men, they tend to be more indifferent to the instances cited by women, because they are considered more flexible than women.12
Distribution of patient satisfaction with the quality of dental and oral health services in terms of service dimension of empathy, for clarity gives instructions before the treatment as many as 40 people (61.5%) and clarity of instruction after treatment as many as 36 people (55.4%) respec-tively by category satisfied. Clarity provides instruction before and after treatment is important and it can determine the success of a treatment. In this study, patients were satisfied with the clarity of giving instruction before and after treatment were submitted dentist because these explanations make the patient feel comfortable the treatment provided. Rahmawati AF et al.17 stated that it was the personal interaction consists of a doctor to the patient friendliness, courtesy doctor to the patient, the doctor’s attention to the patient, the doctor encountered ease and clarity of the information given by the doctor, is an important thing by the patient or have a mean satisfaction rating.17
Furthermore, the service dimension of empathy, for the attention of dentists provid-ing services as many as 36 people (55.4%) with the satisfied category. In this study of patients undergoing dental treatment and mouth feel satisfied, very satisfied, fairly satisfied, because of the attention to make the patient feel that the dentist has a sincere interest in them to over-come the problem of oral health that they convey. Attention is part of the dimensions of quality of services that influence customer satisfaction in using services. Research Saragih S et al.18in RS Harapan Pematangsiantar stated that concern Table 7 Distribution of samples satisfaction for the quality of
dental and oral health services based on the dimensions of medical services
Dimensions of Medical Services
Sample answers by His satisfaction
SP P CP TP STP
n % n % n % n % n %
1. Effectiveness of medical services
10 15.4% 35 53.8% 17 26.2% 3 4.6% 0 0.0%
2. The benefits of services provided to patients
12 18.5% 35 53.8% 17 26.2% 1 1.5% 0 0.0%
Information: STP: very dissatisfied; TP: not satisfied; CP: quite satisfied; P: satisfied; SP: very satisfied
Table 8 Distribution of samples satisfaction based on dimensions of service quality dental care at the General Hospital (Hospital) Tenriawaru Bone District
Dimension Satisfaction
Satisfied Not satisfied
N % N %
1. Guarantee 47 72.3 18 27.7
2. Empathy 40 61.5 25 38.5
3. Responsiveness 35 53.8 30 46.2
4. Physical appearance 41 63.1 24 36.9
(empathy) influence the patient’s decision to use the services at the hospital. Basically every patient wants to be treated specially. Thus the sympathy of medical/paramedic is the main tool to meet the expectations of the patient such preferential treatment in which to influence the perception of patient satisfaction.18
Based on various indicators responsive-ness there are some who became an indicator in responsiveness among other fast action by doctors, nurses and administration, in providing clear information to the patient associated with a nurse and provide rapid response in resolving patient complaints. The services provided offi-cers (doctors) is one of supporting the success of services to patients who are undergoing treat-ment. The attitude shown by the behavior should meet the norms foreseen by the public, especially by the patient and the patient’s family. In provid-ing services of a doctor should be polite, patient, friendly, no doubt, full attention to the patient, always give the help that is needed, building a good relationship with nurses who deal with patients, establish a good relationship with the patient and family that raised confidence patient to the doctor.18
This is certainly the expectations of each patient and are the responsibility of the service providers in this case the officer is directly related to the patient. How officers respond to every complaint and wishes of the patient quickly and in accordance with service standards that have been set. This will certainly increase the sense of satisfaction to the patient.
There are two main factors that affect the qual-ity of the securqual-ity services who felt the patient is expected service and perceived service. If the services received or felt able to guarantee the patient the perceived service quality will be satisfactory. Conversely, if a guarantee of the quality of services received lower than expected, the quality of health services will be perceived poor or unsatisfactory.18
Appearance service is not limited to the physical appearance of a magnificent building but also the appearance of the officer and the availability of facilities and infrastructure. This is supported by research Bata19 stating that there was a significant
relationship between physical appearance and patient’s satisfaction of users access social with p=0.001. Another study showed that there is a positive and significant influence on the dimen-sions of comfort (physical appearance) against one of the patient’s satisfaction that there is direct
evidence, namely service and comfort in the lounge area. Indicating that the dimension of comfort (physical appearance) is the most influential dimensions and is associated with the quality of service perceived.19,20
Conclusion
From this research we conclude that patients are satisfied with the quality of dental and oral health services at the dental Polyclinic General Hospital Tenriawaru Bone.
Conflict of Interest
The authors report no conflict of interest.
References
1. Departemen kesehatan RI. Sistem kesehatan nasional,
bentuk dan cara penyelenggaraan pembangunan keseha-tan. Jakarta: DEPKES; 2009. p. 4, 6-11.
2. Moeloek NF. Sambutan menteri kesehatan republik
Indonesia pada peringatan hari kesehatan nasional. Jakarta: KEMENKES RI; 2014. p. 2.
3. Subawa G. Mengelola rumah sakit menyesuaikan SJSN
kesehatan. Yogyakarta: Seminar Nasional; 2013.
4. Sembel M, Opod H, Hutagalung BSP. Gambaran tingkat
kepuasan pasien terhadap perawatan gigi dan mulut di puskesmas bahu. J e-GiGi 2014;2: 57-66.
5. Muninjaya AAG. Manajemen mutu pelayanan kesehatan.
Jakarta: EGC; 2011. p. 12-16.
6. Profil BLUD RSUD Tenriawaru Kabupaten Bone.
Watampone: 2014. p. 1-2.
7. Pohan IS. Jaminan mutu layanan kesehatan, dasar-dasar
pengertian dan penerapan. Jakarta: EGC; 2006. p. 12-3, 18-20.
8. Buchbinder SB, Shanks NH. Buku ajar manajemen
pelayanan kesehatan. Jakarta: EGC; 2011. p. 64-65.
9. Al-Assaf AF. Mutu pelayanan kesehatan: dulu dan
seka-rang. In Al-Assaf AF, editor. Mutu pelayanan kesehatan perspektif internasional. Jakarta: EGC; 2009. p. 15-6, 18.
10. Rangkuti R. Riset Pemasaran. Jakarta: GRAMEDIA; 2007.
p. 66-67.
11. Apendi. Hubungan karakteristik pasien dengan tingkat
kepuasan pasien di tiga UPF rawat inap RSUD Demak. Diponegoro University. 1997.
12. Oroh ME, Rompas S, Pondang L. Faktor-faktor yang
dihubungkan dengan tingkat kepuasan pasien rawat inap terhadap pelayanan keperawatan di ruang interna RSUD Noongan. p. 5-6.
13. Munawaroh S. Analisis hubungan karakteristik dan
kepua-san pasien dengan loyalitas pasien di RSUA DR. Sutomo Ponorogo. p. 7.
14. Susilo WH, Aima H. Skala pengukuran dan instrument
penelitian aplikasi SPSS pada penelitian ilmu keperawatan. Jakarta: IN MEDIA; 2013. p. 3-4.
15. Suliyanto. Perbedaan pandangan skala likert sebagai
skala ordinal atau skala interval. Purwokerto: SEWINDU STATISTIKA; 2011. p. 2-4.
16. Simbolon R. Tingkat kepuasan pasien terhadap pelayanan
Pematang siantar. Sumatera Utara: Fakultas Kedokteran Gigi Universitas Sumatera Utara; . p. 1-19.
17. Rahmawati AF, Supriyanto S. Mutu pelayanan kesehatan
berdasarkan dimensi dabholkar di ruang rawat inap pen-yakit dalam. J Administrasi Kesehatan Indonesia 2013;1: 136-139.
18. Saragih S, Lubis AN, Sutatniningsih R. Pengaruh mutu
pelayanan kesehatan terhadap loyalitas pasien rumah sakit umum herna medan. Medan: 2014. p. 1-8.
19. Bata YW, Alwi, Darmawansyah. Hubungan kualitas
pelayanan kesehatan dengan kepuasan pasien pengguna askes sosial pada pelayanan rawat inap di RSUD lakipa-dada kabupaten tana toraja tahun. Makassar: Universitas Hasanuddin; 2013. p. 6-9.
20. Susmaneli H, Triana A. Dimensi mutu pelayanan
kebidanan terhadap kepuasan pasien program Jampersal. J Kesehatan Masyarakat Nasional 2014;8: 419-421.
21. Depkes RI. Klasifikasi Pembagian Kategori Umur.
2009. Available at: http//id.scribd.com/doc/151484440/
Kategori-Umur-Menurut-Depkes-RI#scribd. Accessed
November 20, 2015.