JURNAL TECH-E
| 2581-1916 (Online)|
Artical
Implementation of Ontime Graduation Prediction for
Buddhi Dharma University Using Comparison of
C4.5 and K-NN Algorithms
Suwitno1
1Universitas Buddhi Dharma, Manajemen Infomatika, Banten, Indonesia
JEJAK PENGIRIMAN A B S T R A K
Diterima: 15 Agustus 2017 Revisi Akhir: 20 Agustus 2017 Tersedia Online: 15 September 2017
Collection of data on academic information system database of Higher Education is often not utilized maximally, whereas from data with data mining technique can give knowledge which not yet known before. The purpose of this research is to know how to form the prediction model of student's graduation rate on time at Buddhi Dharma University, Tangerang through student passing data. Prediction of student graduation on time using comparison of algorithm C4.5 and K-NN done with data selection stage, data transformation, data mining and interpretation. This study uses 300 training data and 90 data testing. Then the process of classification technique using decision tree method using C4.5 algorithm and euclidean distance calculation using K-NN algorithm. Evaluation of classification performance is done to know how well the accuracy of a model is formed. Based on the research that has been done, the model is formed with the help of Rapidminer software, and calculated the average value of k-fold cross validation on testing up to k = 10 for algorithm C4.5 and K-NN. Testing is done with Confusion Matrix and ROC curves. Accuracy results obtained prove that Algorithm C4.5 yields 90% accuracy percentage and K-NN yield 87% accuracy percentage. Thus the C4.5 algorithm has a higher accuracy value than K-NN. This C4.5 algorithm can be used to prototype predictions of students' graduation on time at Buddhi Dharma University Tangerang.
KATA KUNCI
C4.5, K-NN, Ontime graduation, Prediction
KORESPONDENSI
Telepon: 081311190089 E-mail: [email protected]
Introduction
The development of information technology is so advanced today, causing the level of accuracy of a data is needed in everyday life. Any information that exists becomes an important thing to determine every decision in
The percentage rise and fall of the students' ability to complete a timely study is one of the
elements of university accreditation
assessment. Therefore, it is necessary to monitor and evaluate students' tendency to pass on time or not.
I. METHOD
C4.5 Algorithm
The C4.5 algorithm was designed by J. Ross Quinlan, named C4.5 because it is descended from the ID3 approach to construct decision trees. C4.5 is a suitable algorithm used for classification problems in machine learning and data mining. C4.5 maps the attributes of the classes so they can be used to find predictions for data that have not yet appeared. In the decision tree of the central node is the attribute of the tested data (tuple), the branch is the result of the attribute test, and the leaf merup will be a class that is formed. Stages in the C4.5 algorithm, are:
a. Note the label on the data, if it is all the same, then the leaves will be formed with the value of the entire data label.
b. Calculating the total value of the
c. Calculates the info value of each attribute (Info)
InfoA(D) = ∑|D|D| × Info(Dj| j) v
j=1
d. Calculates the gain value of each attribute (Gain) branches, the leaf will be formed with the majority value of the data value.
K-Nearest Neighbor (K-NN) Algorithm
K-Nearest Neighbor (K-NN) algorithm is a method to classify objects based on learning
algorithm uses a supervised algorithm. The difference between supervised learning and unsupervised learning is in supervised learning aims to find new patterns in data by linking existing data patterns with new data. Whereas in unsupervised learning, data does not have any pattern, and the purpose of distance between two points ie the point in the training data (x) and the point in the test data (y) then use the Euclidean formula, with equation:
𝐷 (𝑥, 𝑦) = √∑(𝑥𝑖 − 𝑦𝑗)2 𝑛
𝑖=1
Stages in the K-NN algorithm are:
a. Specifies the parameter k (the number of nearest neighbors).
b. Calculates the square of the Euclidean distance (query instance) of each object against the given training data.
c.Then sort those objects into groups that
have the smallest Euclidean distance. d. Collecting new category k (classification of
Nearest Neighbor).
C4.5 and K-Nearest Neighbor are selected because this method has a high degree of accuracy and speed when applied to large amounts of data and can be used to predict the probability of membership of a class.
II. RESULT
An important step in this research is the use of C4.5 and K-NN algorithms to form a model. The resulting model will be comparative to find the best level of accuracy that will be used to determine the pattern of the ability of students who have the ability to pass on time or not. In this research, validation process is done to find, and convert data to be used in data mining algorithm method and get good accuracy and performance. In the dataset to be used this, the validation of data used is to delete incomplete or empty data that has no value (null). After that, attribute selection is done to select which attributes are needed from the dataset used in the process of analyzing the student's graduation on time at Buddhi Dharma University.
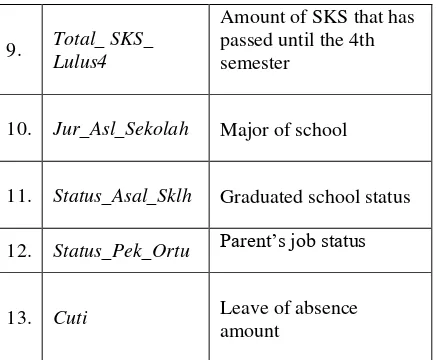
Table 1. Attribute List and Description
No Attribute Description
1. Waktu_Kuliah Time Session
2. Jenis_Kelamin Gender
3. Prodi Study Program
Amount of SKS that has passed until the 4th semester
10. Jur_Asl_Sekolah Major of school
11. Status_Asal_Sklh Graduated school status
12. Status_Pek_Ortu Parent’s job status
13. Cuti Leave of absence
amount
Graduation data for training data and test data collected has 390 records and 13 attributes. All these attributes are collected and analyzed to view dominant data patterns and data types to assist in the process of selecting appropriate data mining methods and algorithms.
Table 2. Comparison of Accuracy and AUC
Prediction C4.5
Figure 1: Accuracy of C4.5 Algorithm
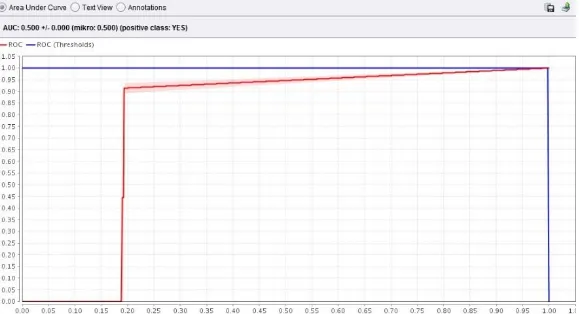
Figure 2: AUC Level of C4.5 Algorithm
Figure 3: Accuracy of K-NN Algorithm
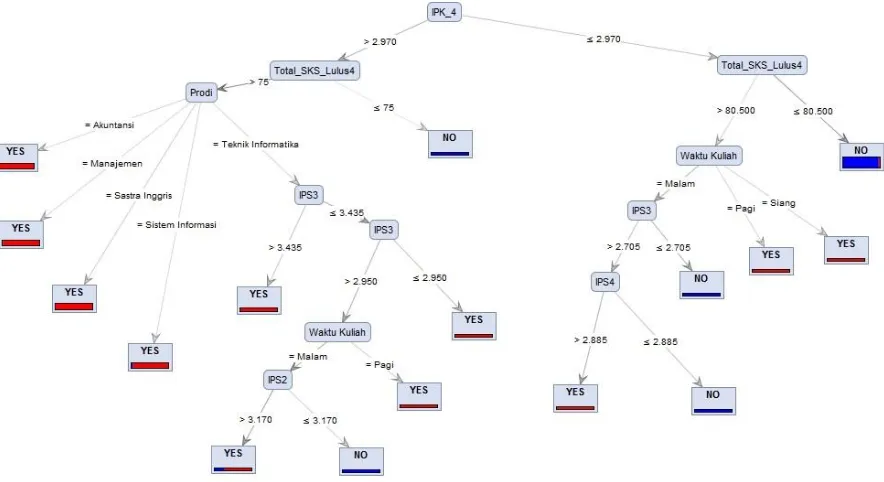
Figure 5: Decision Tree of C4.5 Algorithm
Rules generated from the decision tree based on training data are as follows:
III. DISCUSSION
One of the most important things to determine the errors or deficiencies in the developed prediction application is to test. The test was conducted nine times which involved 90 data in addition to training data and using the confusion matrix method, ie the table used as a useful measuring tool to analyze how well the classification is right and wrong from the
predictions made. Accuracy obtained can be calculated by the formula:
𝐴𝑐𝑐𝑢𝑟𝑎𝑐𝑦 =∑ 𝑐𝑜𝑟𝑟𝑒𝑐𝑡 𝑎𝑛𝑑 𝑖𝑛𝑐𝑜𝑟𝑒𝑐𝑡 𝑝𝑟𝑒𝑑𝑖𝑐𝑡𝑖𝑜𝑛𝑠∑ 𝑐𝑜𝑟𝑟𝑒𝑐𝑡 𝑝𝑟𝑒𝑑𝑖𝑐𝑡𝑖𝑜𝑛𝑠
Whereas to calculate the Error rate can be calculated by the formula:
𝐸𝑟𝑟𝑜𝑟 𝑟𝑎𝑡𝑒 =∑ 𝑐𝑜𝑟𝑟𝑒𝑐𝑡 𝑎𝑛𝑑 𝑖𝑛𝑐𝑜𝑟𝑒𝑐𝑡 𝑝𝑟𝑒𝑑𝑖𝑐𝑡𝑖𝑜𝑛𝑠∑ 𝑖𝑛𝑐𝑜𝑟𝑟𝑒𝑐𝑡 𝑝𝑟𝑒𝑑𝑖𝑐𝑡𝑖𝑜𝑛𝑠
Table 3. Testing Result
Testing accuracy error rate
K-1 80% 20%
K-2 90% 10%
K-3 100% 0%
K-4 90% 10%
K-5 100% 0%
K-6 90% 10%
K-7 100% 0%
K-8 90% 10%
User *
*
login
<include>
*
* impor data
testing summary
data
*
* view data
training
list data testing
*
*
*
*
<ext end>*
*
prediksi data baru
* *
*
*
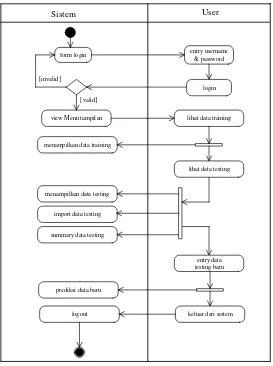
Sistem User
form login entry username & password
[invalid]
login
view Menu tampilan lihat data training
menampilkan data training [valid]
lihat data testing
menampilkan data testing
import data testing
summary data testing
entry data testing baru
prediksi data baru
keluar dari sistem logout
Figure 6: Use Case Diagram
JURNAL TECH-E
| 2581-1916 (Online)|
Of the nine experiments that have been done, then got the summary that is:
for accuracy level of:
80 + 90 + 100 + 90 + 100 + 90 + 100 + 90 + 80
9 𝑥 100%
= 8209 𝑥 100%
= 𝟗𝟏, 𝟏𝟏%
and for the rate of error rate of:
20 + 10 + 0 + 10 + 0 + 10 + 0 + 10 + 20
9 𝑥 100%
= 809 𝑥 100%
= 𝟖, 𝟖𝟗%
IV. CONCLUSION
From the measurement of performance and performance that has been done on two methods of classification algorithm, the result of this research can be concluded that:
1. Data mining classification method is appropriate to be implemented into the
prototype of student predictions
information system on time.
2. The C4.5 algorithm has the best accuracy between the two classification algorithms. So this algorithm will be implemented into the prototype predictions of graduation students on time. It can be seen that the C4.5 algorithm has an accuracy value of 90% and AUC value of 0.874 which belongs to the category of good classification.
REFERENCES
Alpaydın, E., Introduction to Machine Learning. Second., London: The MIT Press, 2012.
Chapman, P., CRISP-DM 1.0, Step-by-step data mining guide, 2000.
Gorunescu, F., Data Mining Concepts, Models and Techniques, Springer, 2011.
Hall, T., A Systematic Literature Review on Fault Prediction Performance in Software
Engineering, 2011.
Vercellis, C., Business Intelligence : Data Mining and Optimization for Decision Making, John
Wiley & Sons, Inc, 2009.
Witten et al., Data Mining Practical Machine Learning Tools and Techniques 3rd, Burlington:
Elsevier Inc, 2011.
Wu, X. et al., Top 10 algorithms in data mining, A Chapman & Hall Book, 2008.
BIOGRAPHY