15th International Conference on Quality in Research (QiR 2017)
AN ASSESSMENT ON SUSTAINABILITY OF THE RAILWAY – AIRPORT LINK AS AN ALTERNATIVE MODE OF TRANSPORTATION
TO RADIN INTEN II AIRPORT
Ika Kustiani
Amril Ma’ruf Siregar Abstract
The rapid economic development in the Province of Lampung is indicated by, among other things, the increase of air transportation mode users. The data shows that for the last four years, the number of passengers of the Radin Inten II Airport increased by 52% and the number of cargos increased by 257%. To support these demand, cost-effective and efficient transportation systems are vital, therefore the government has recently completed the construction of the Radin Inten II Airport expansion. Moreover, currently the government is planning to build a link between the airport facilities with railway transportation mode. This link provides additional alternative of transportation to airport. This research was carried out to assess the future demand for railway transportation mode to airport and to measure how this can achieve financial, environmental and social performance for sustainability. The assessment methods were utilizing dynamic, purposive and random sampling method to review the opinion of stakeholders of transportation system to airport. Stakeholders’ opinion survey also reviewed a set of physical and managerial interventions that could potentially be implemented to improve the performance and sustainability of the railway transportation system. These interventions were drawn from suggestions made by experts in transportation system. The review of these proposed interventions was executed by integrating the results
from a stakeholders’ opinion survey with a Triple Bottom Line (TBL) sustainability
framework. The integration of these two methods was designed to identify an alternative solution that was not only robust but also preferred by the stakeholders of railway and airport transportation system. The results showed that the physical changes that required large capital cost were less desirable and the managerial changes that give private company a greater authority were less favourable by all stakeholders.
Keywords: Transportation mode; Sampling method; Stakeholders opinion survey; physical
and managerial interventions; Triple Bottom Line sustainability framework;
I. INTRODUCTION
At the moment, the only access to the airport from Bandar Lampung Central Business District is through Trans Sumatra Highway. On average travel time is 45 minutes for private cars and taxis. Longer time is needed for Airport Bus. Every year, the travel time is increasing since the number of vehicles are increasing. This problem is exacerbated by the prediction of potentially high increase in the number of airport passengers in the future. It can be predicted that the current transportation mode to access the airport can no longer supports the demand. Therefore, an alternative mode of transportation is urgently needed to shorten the travel time from and to the airport. Fortunately, the airport location is close to railway track and utilizing it is one of possible options to effectively and efficiently transport people in mass from and to the airport.
Railway services has many advantages compare to other forms of transportation mode such as: enable to transport people in mass, lower/affordable cost, lower pollutant emission, lower land requirement, comfortable, safe, and free from traffic. There are some criteria that govern the type, size or class of a train station such as: operation facilities, number of tracks, supporting facilities, frequency of traffics, number of passengers and goods, revenues, and level of service (safety, security, reliability, comfort, easiness and equality). Based on those criteria, an airport train is considered as a short distance type railway service in which the distance is between 10 to 100 kilometers or the time travel is between half to three hours. In general, a high frequency or a short headway type of trains are needed with a maximum headway of 10 to 15 minutes or minimum there are 4 trains in one hour.
The current Branti Railway Station is classified as a small station and operates as longsiding and transfer station. At the moment, the railway provides services to transport passengers in short distance from Tanjung Karang to Kotabumi and medium distance from Tanjung Karang to Kertapati. The railway runs 2 return trains for economy and executive classes for medium distance and 1 return trains for short distance. The railway also provides services for transporting goods such as coals, pulp and others. The travel speed for passengers’ trains are
36 – 52 km per hour and for goods carriages are 25 – 40 km per hour.
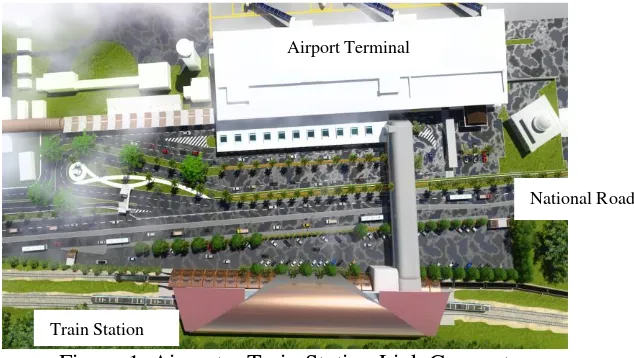
Figure 1. Airport – Train Station Link Concept
Based on the previous assessment, there are some problems exist in developing a mass rapid transportation system from Tanjung Karang CBD to the airport via railway. The nearest train station to the airport (Branti) is about 1.3 kilometers. Therefore, it is needed to relocate the current location of Branti Station to enable it to be operated as an airport train station. It is planned that a skybridge will be constructed to connect the train station with the airport terminal as can be seen from Figure 1. In addition to that, a double track railway is a must as
Airport Terminal
Train Station
3
well as separation of track for passengers and goods. Improvements of facilities at Tanjung Karang and Labuhan Ratu Stations to support airport train station operation are also needed. For Indonesia Railway Authority, pioneering airport train to provide transportation services
that accommodate passengers’ mobility from one transportation mode to another in mass and
in accordance to passengers’ preferences is the challenge that must be done as soon as
possible. Therefore, studies were required to understand the factors that influence users to switch to rail service as well as factors that influence the sustainability of the Railway – Airport Link. This study was conducted to find out the characteristics of passengers of each transportation mode to airport (taxi, private cars, and Trans Lampung bus), the number of passengers that might switching to train; and the technical and managerial intervention alternatives that favourable to stakeholders.
II. METHODOLOGY
2.1.Opinion survey
According to Abernethy, Jinapala, and Makin (2001) the objectives of measuring and quantifying stakeholders opinions are to:
1. Assist users to exert some influence on policies that affect their lives and economies,
2. Assist project planners in identifying the project components that are most likely to
satisfy the concerns of affected users,
3. Provide a balanced view of alternative strategies and estimate differences of opinion
between stakeholders, and
4. Provide a means of continuing mixed (quantitative and qualitative) evaluation of
peoples’ reaction to the impact of a project.
Among different stakeholders of transportation projects, users are the most fundamental. Opinion survey of the people most affected by transportation project is aimed to capture opinion and discourse on the current level of service, expectation of future service levels and willingness to bear the consequences of possible upgrades to service levels and/or infrastructure. It is very important to increase local support, co-operation, and benefit. Abernethy, Jinapala and Makin (2001) explained aspects to be considered when gathering the opinion of people are: technique/methodology, preparation of questionnaires, and analysis of findings. Reported works on opinion surveys generally used a quantitative design with a questionnaire method. It is widely uses since it is an easy, quick and economical method; and reliable and capable of analysing large sample size subsets containing variations of possible determinant factors such as age, gender, or income. In designing the questionnaire, the following should be considered carefully:
1. As short as possible: based on a brief interview via 10 to 15 questions/statements,
2. Should be in written/spoken in the local language,
3. Consider the respondents might have low education level.
In general, the users’ perceptions that need to be taken into account are:
1. Service delivery (operational): adequacy/sufficiency, reliability/predictability,
tractability/convenience/flexibility, equity;
2. Asset/infrastructure condition (maintenance): railway, station, train
3. Economic aspect: fare
4. Environmental aspect: air quality and green corridors
5. Management aspect: effectiveness and efficiency of the services
2.2.Travel Fare
when there is no choice, they are forced to use this mode of transportation. Basically, fare are determined based on the following aspects: users, operator and regulator (government). In determining train service fee, it is needed to compare the ability to pay (ATP) and the willingness to pay (WTP) of train users to pay a sum of money for services provided. The value of ATP and WTP also affect the frequency of using the facility.
When the fare are determined based on ATP and WTP, user aspect is the subject who determine the amount of fare applied. The fare applied follows the following principles: 1. The fare applied cannot exceed the ATP of target communities. When the fare applied is
higher than ATP, government intervention in the form of subsidy (direct or cross-subsidy) or other government supports are needed to obtain a fare that equal to ATP. 2. Since the WTP is the function of level of service of public transportation, the opportunity
to increase fare still exists by increasing performance of service.
3. In case that fare applied is far below the ATP and WTP, there is flexibility in the calculation or application of the new fare.
Basically, ATP is transportation budget to travel intensity ratio. It measure the ability of public to pay the service provided based on ideal income. There are two type of ATP that are general ATP and ATP based on occupation, however both can be calculated using household budget method. ATP is influenced by income, travel frequency, estimation on daily transportation cost, and other costs.
WTP can be defined as the average amount of money that passengers willing to incur as a payment for service received. It is affected by several factors such as: quantity and quality of
service, purpose of utilization and users’ income. One method to analyse WTP for train
services is based on users’ perception on fare and service of the public transport such as: expected rates, service priority expected, and willingness to pay more for improved safety.
2.3.The Triple Bottom Line Sustainability
Sakthivadivel et al. (1999) stated that performance assessment is an integral part of performance-oriented management. It can be used to measure the general health of a system, the impact of interventions and to diagnose the constraint threats and institutional strengths. The most popular type of performance assessment is a measurement on sustainability performance. The triple bottom line (TBL) sustainability performance is a concept proposed by John Elkington in 1995. The TBL is an expanded spectrum of values and criteria for measuring organisational (and societal) success that takes into account ecological and social performance in addition to financial performance. Because of its goal of sustainability, the TBL is famously described as ‘people, planet, and profit’.
5
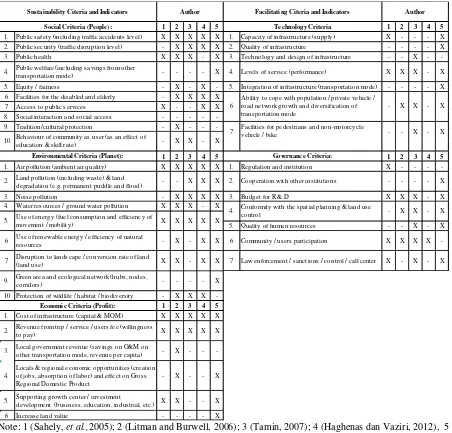
Table 1. Sustainability Citeria and Indicators for Transportation Infrastructure from Previous Research
1 2 3 4 5 1 2 3 4 5
1. Public safety (including traffic accidents level) X X X X X 1. Capacity of infrastructure (supply) X - - - X 2. Public security (traffic disruption level) - X X X X 2. Quality of infrastructure - - - - X 3. Public health X X X - X 3. Technology and design of infrastructure - - X -
-4. Public welfare (including savings from other
transportation mode) - - - - X 4. Levels of service (performance) X X X - X 5. Equity / fairness - X - X - 5. Integration of infrastructure (transportation mode) - - - - X
6 Facilities for the disabled and elderly - X X X X 7 Access to public services X - - X X 8. Social interaction and social access - - - - -9. Tradition/cultural protection - X - -
-1 2 3 4 5 1 2 3 4 5
1. Air pollution (ambient air quality) X X X X X 1. Regulation and institution X - - -
-2. Land pollution (including waste) & land
degradation (e.g. permanent puddle and flood) - - X X X 2. Cooperation with other institutions - - - - X
3. Noise pollution - X X X X 3. Budget for R & D X X X - X
4. Water resources / ground water pollution X X X - X
5. Quality of human resources - - X - X
6 Use of renewable energy / efficiency of natural
resources - X - X X 6 Community / users participation X X X X
-7 Disruption to landscape / conversion rate of land
(land use) X X - X X 7 Law enforcement / sanctions / control / call center X - X - X
9. Green area and ecological network (hubs, nodes,
corridors) - - - - X
10 Protection of wildlife / habitat / biodiversity - X X X -1 2 3 4 5 1. Cost of infrastructure (capital & MOM) X X X X X
2. Revenue from trip / service / users fee (willingness
to pay) X X X X X
3. Local government revenue (savings on O&M on
other transportation mode, revenue per capita) - X - -
-4.
Locals & regional economic opportunities (creation of jobs, absorption of labor) and effect on Gross Regional Domestic Product
- X - - X
5. Supporting growth center / investment
development (business, education, industrial, etc.) X X - - X
6 Increase land value - - - - X
- X - X
- X X 4. Conformity with the spatial planning & land use
control 5. Use of energy (fuel consumption and efficiency of
movement / mobility) X X X X X
Facilitating Citeria and Indicators Author Technology Criteria
Governance Criteria: 6
Ability to cope with population / private vehicle / road network growth and diversification of 10 Behaviour of community as user (as an effect of
education & skill rate) - X X - X
Note: 1 (Sahely, et al.,2005); 2 (Litman and Burwell, 2006); 3 (Tamin, 2007); 4 (Haghenas dan Vaziri, 2012), 5 (Kusbimanto, 2013)
III. RESULTS AND DISCUSSION
Opinion surveys conducted for this study consist of three different surveys that were two users’ opinion survey and one key stakeholders’ opinion survey. As a result, each survey required different respondents and methodologies; however, the stages were typical that are: defining the population of concern, specifying sampling frame, specifying sampling method, developing questionnaires, conducting field surveys, analysing and interpreting data.
3.1.Users’ opinion survey
1. Measuring interest on train service to airport
Passengers’ opinion survey was carried out through questionnaires to gather information about passengers’ interest on choosing airport train service, and origin and destination of
passengers. The survey method utilized Random Sampling and the number of respondents
number of samples, N = number of passengers per day, and e = prediction on passengers’ increase.
Based on the data, the average number of passengers per day in 2016 was 2,448. It was predicted that the rate of passengers’ increase of 5% per year applied following the rate of Sukarno – Hatta Airport. As a result of the equation above, the minimum number of samples needed is 345 per day.
Opinion survey on airport passengers’ interest in using train service to access airport was conducted on Thursday, Friday and Saturday in the month of September 2016 against 450 respondents. From 441 valid respondents, 61% of respondents comes from Bandar Lampung and 74% said interested to choose train service.
Based on the number of passengers in the Year 1998 to 2015, a polynomial regression graphs was drawn to predict the number of passengers in 10 and 20 years (Year 2026 and 2036). Based on the graph, it can be predicted that in the Year 2026: the number of passenger from Bandar Lampung would be 378 passengers and 280 of them would prefer to use train to transport from Bandar Lampung. The number is becoming more striking in the Year 2066. The number of passengers from Bandar Lampung would become 1,704 per day and 1,200 of them would choose train to transport to the airport.
2. Measuring the Ability to Pay (ATP) and the Willingness to Pay (WTP)
The questionnaires survey utilized a Dynamic Method in which the respondent was chosen
based on incidental sampling (anytime and anywhere) as long as they fulfil the requirements as a sample of a population (Amirin, 2011). Respondents were passengers of three different type of transportation mode that exist in the airport at the moment that were: bus, private car and taxi. The number of respondent was 350 passengers that consist of 151 private cars, 148 taxi, and 51 taxi. The responds gathered from the survey was analysed using multiple regression with SPSS. With 95% of confidence level, the value of R2 for formula obtained was 0.72. The questionnaires were designed in four sections as follow:
a. Characteristics of passengers:
It consists of 12 questions that addressed to find out the characteristics of airport passengers at Radin Inten II Airport as follow: age, gender, education, frequency to airport, means of transport most frequently used, alternatives of transport that can be selected, time travel to airport, travel origin, travel destination, purpose of travel, number of dependents, and the one-time cost travel to airport.
From about 350 respondents, 56% of travel purpose was for work, 23% for social activities, 13% for business, and the rest was for others such as holiday and family matters. In addition to that, 51% of respondents who work were private employees, education level of passengers was dominated by under graduate level by 71%, and family income for taxi and bus passengers were 1 to 3 million Rupiahs per month while for private car passengers were 3 to 5 million Rupiahs per month.
Since the majority of passengers’ purposes is for work, they choose air transportation
because its punctuality. Since most of the passengers’ purpose is for work, the frequency
of passengers to airport 59% travel twice a month, 32% travel 4 times a month, and 9% travels more than 4 times a month. Only a very small fraction of the passengers are one time travellers.
b. Ability to pay (ATP)
7
Based on the calculation, the minimum ATP of respondents was USS 0.75 and maximum
was USS 3.75 with an average of USS 2.6. The most ATP was in the range of < USS 1.5
(25%), then followed by USS 2.25 - 3 (16.67%), > USS 3 (16.67%) and USS 1.5 – 2.25
(15%). If the airport train fare are in the range of USS 0.75 – 2.25, the ATP of
respondents are 60%. However, if the fare is increased to USS 2.25 – 3.75 the ATP of
respondents decrease to 40%.
c. Willingness to pay (WTP)
The questions asked for this study consist of for questions as follow: appropriate airport train fare, highest priority of airport train service, willingness to pay more for improved
safety, and added costs for the program. Hence, the respondents’ WTP can be
calculated.
Based on the calculation, minimum WTP of respondents was USS 0.75 and maximum
was USS 4.5 with an average of USS 2.1. The most WTP of respondents was in the
range of USS 1.5 – 1.9 (26.67%), then followed by USS 0.75 – 1.5 (20%) and USS 1.9 –
2.25 (20%). If the airport train fare are set in the range of USS 1.5 – 2.25, the WTP of
respondents are 78,33%. However, if the fare is increased to USS 2.25 – 3 the WTP of
respondents decrease to 50%.
The study results show that the average ATP was higher than the average WTP. This means that the respondents' ability to pay is greater than the desire to pay for the services. This condition is caused by:
Low utility of public services often caused by users with relatively high income not
willing to utilize it because the service are below their expectation. In this case, users are called choice riders since they have a choice on transportation modes. They tend to utilize transportation modes with a better service or using their own car even with a higher cost.
Respondents’ perception on airport train are is still influenced by the assumption that
all public transportation have similar level of service, as a result they expected the fare would be similar.
d. Respondents’ expectation
The questionnaire was designed to assess respondents expectations on service provided. The results can be he results can be used to determine the priority of service.
From about 350 respondents, 35% of taxi passengers and 37% of private car passengers were not willing to switch modes of transport to bus. On the other hand, the respondents were willing to switch from previous transportation to train because they expect the train will have shorter travel time/avoid congestion (49.3%), much cheaper (17.6%) and comfortable (10.3%).
Based on the survey on priority of services, respondents prioritize punctuality of service was 51%, comfort of service was 20%, convenience in obtaining service was 17% and others (responsibility, completeness, politeness and friendliness in providing services and other supporting attributes). In addition to this, 80% of respondents are willing to pay more than the original rate to increase safety.
3.2.Measuring sustainability of proposed railway – airport link
Opinion survey also carried out to gather key stakeholders preferences on the planning (physical and managerial interventions) to assess the sustainability of the planning.
Stakeholders’ opinion survey was carried out based on Purposive Sampling Technique.
The sampling units or respondents in a purposive sampling method are selected based on
experience for the research field; (2) having position, reputation and credibility as stakeholders; and willing to be a respondent and can be met for an interview. The key stakeholders consisted of representatives from South Sumatra Region Railway Engineering
Institution, Lampung Railway Development Office, Regional Division IV Tanjung Karang –
Indonesia Railway Authority, the Province of Lampung Local Transport Authority, Radin Inten II Airport Office, Radin Inten II Railway Station Development Team, the Province of Lampung Local Planning Office, the Province of Lampung Office - National Road Planning and Supervision, the Province of Lampung Road Authority - the Department of Public Work, the Directorate General of Airport Transportation, the consultant companies of Radin Inten II Airport Development Planning (PT. Aria Graha and PT. Muara Consult) and the University of Lampung.
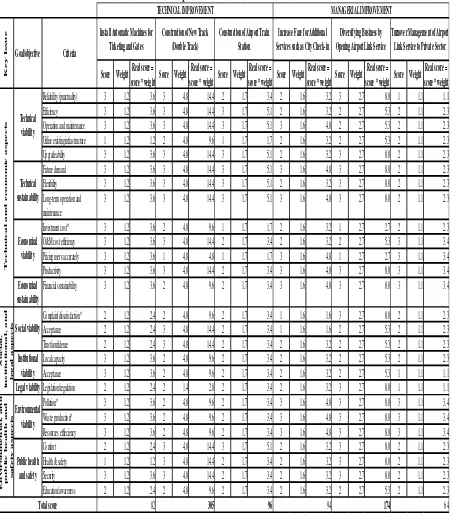
Table 2. The TBL Assessment on Proposed Interventions
Reliability (punctuality) 3 1.2 3.6 3 4.8 14.4 2 1.7 3.4 2 1.6 3.2 3 2.7 8.0 1 1.1 1.1
Financial sustainability 3 1.2 3.6 2 4.8 9.6 2 1.7 3.4
Complain/dissatisfaction* 2 1.2 2.4 2 4.8 9.6 2 1.7 3.4 1 1.6 1.6 3 2.7 8.0 2 1.1 2.3
Acceptance 2 1.2 2.4 3 4.8 14.4 2 1.7 3.4 1 1.6 1.6 2 2.7 5.3 2 1.1 2.3
Trust/confidence 2 1.2 2.4 3 4.8 14.4 2 1.7 3.4 2 1.6 3.2 2 2.7 5.3 2 1.1 2.3
Local capacity 3 1.2 3.6 2 4.8 9.6 2 1.7 3.4 2 1.6 3.2 2 2.7 5.3 2 1.1 2.3
Acceptance 3 1.2 3.6 2 4.8 9.6 2 1.7 3.4 2 1.6 3.2 2 2.7 5.3 1 1.1 1.1
Legal viabilityLegislation/regulation 2 1.2 2.4 2 1.4 2.8 2 1.7 3.4 2 1.6 3.2 3 2.7 8.0 1 1.1 1.1
As mentioned before that there some problems exist in developing a mass rapid transportation system from Tanjung Karang CBD to the airport via railway. The proposed alternatives of physical and managerial improvements to enable this link operated are shown on the Table 2. These proposed interventions then were tested against three key sustainability issues i.e., the goals to be achieved in implementing the alternatives. The three key sustainability issues were: technical and economic; social, institutional and legal issue; and environmental, public health and safety. These key issues were then developed further into several criteria of sustainability/viability that determined whether the goals were achievable. The key sustainability issue and its criteria were framed based on previous researches as summarized in Table 1.
Each criteria of the three key sustainability issues was measured through examining statements in which a score was imposed based on the ability to satisfy the statements. The scores were 1 for low, 2 for moderate and 3 for high. Weights were also allocated to each criteria based on the rank of the options obtained from the key stakeholders opinion survey analysis using the Pairwise Comparison Matrix and Analysis. The higher the value obtained by an action, the more viable. Further discussion on the TBL sustainability viability assessment of proposed intervention priorities is presented in the Table 2. From the table, it can be seen key stakeholders preferences were: constructing a double track, diversifying business by opening airport link service and constructing a new airport train station.
IV. CONCLUSIONS AND SUGGESTIONS
Based on the analysis on potential airport train users’ responds, airport train station authority must provide transportation services with satisfactory level of service and appropriate fare, so the potential users are willing to utilize airport train services. In addition to these, to realize the plan to link railway and airport, there are physical and managerial alternatives that has to be taken by Indonesia Railway Authority. The following are conclusions and suggestions resulting from the study:
1. Fare
Appropriate fare (basic fare) for airport train service from Tanjung Karang Station to Branti Airport Station based on the study was about USS 2.6.
2. Travel Time with Express Train and Special Track
Average travel time for train services in Indonesia is 60 km/hour. With travel distance of 24.5 km (Tanjung Karang to Branti Airport Station), it is expected that the airport train travel time would be 30 minutes without stopping (express train). Since the travel time of private car for the same origin and destination is about one hour in normal condition, it is expected to attract users since it provides punctuality for passengers. Even with stopping at two places will not affect the travel time too much since it only needs to stop
for 5 minutes each. This will greatly increase users’ access to airport train. In addition
to this, providing a special track for airport train also become an alternative to guarantee no delays.
3. Travel Schedule (Frequency and Punctuality)
Frequent and punctuality of departure as well as train schedule according to flight schedule will greatly affect the interest of airport users. It provides convenience and comfort to choose the time to go without fear of missing the train or the flight as well as reducing waiting time at station and airport.
4. Supporting Facilities for Comfort
passengers. Smoking, eating (bottled water is permitted) and littering in the train are prohibited. Since it is a short distance train, there will be no restriction for the number of passengers and there is possibility of standing passengers.
5. Safety and Security (Access In and Off Station)
Rules regarding only people with ticket may enter the station must be upheld. In addition to this, security officers have always ready at the entrance and exit of the station. This will also remove hawkers from the station so that the station safer, cleaner and more comfortable. It is needed to consider to provide automated ticketing and automated entrance and exit gate.
6. Additional Services
City check-in enables airport passengers to check-in their flight and baggage at Tanjung Karang Station and arrive at the airport 30 minutes before departure time. This will also reduce queues and waiting time at the airport. This service is very helpful for visitors, so they have extra time to stroll, shop or do other activities without carrying heavy luggage. 7. Priority of intervention alternatives
In order the railway - airport link plan can be realized, several physical and managerial intervention alternative needs to be taken. Several phases are needed and the first three priorities are: constructing a double track, diversifying business by opening airport link service and constructing a new airport train station.
V. ACKNOWLEDGEMENT
The authors would like to thank for the support of the University of Lampung and the consultants PT. Aria Graha and PT. Muara Consult for providing some data for the study.
VI. REFERENCES
Abernethy, C. L., Jinapala, K., and Makin, I. W., (2001), Assessing the opinions of users of water projects, Irrigation and Drainage 50(3): 173-193.
Haghenas, H. and Vaziri, M., (2012), Urban sustainable transportation indicators for global
comparison, Ecological Indicators 15: 115–121.
Kusbimanto, I.W., (2013), Models of sustainable urban transport infrastructure development policies in Metropolitan Mamminasata Southern Sulawesi, Dissertation, Graduate School IPB Bogor.
Litman, T. and Burwell, D., (2006), Issues in sustainable transportation, International Journal of Global Environmental Issues 6(4): 331-347.
Sakthivadivel, R., Fraiture, C. D., Moden, D. J., Christopher, P. and Kloezen, W., (1999), Indicators of land and water productivity in irrigated agriculture, International Journal of Water Resources Development 15(1-2): 161-179.
Sahely, H., Kennedy, C.A. and Adams, B.J., (2005), Developing sustainability criteria for urban infrastructure system, Canadian Journal of Civil Engineering 32(1): 72-85. Tamin, O.Z., (2007), Towards sustainable transportation system in Bandar Lampung City,
Proceeding of Sustainable Transportation Seminar, Bandung Institute of Technology.