Social Responsibility Journal
The value relevance of environment al perf ormance: evidence f rom Indonesia Susi Sarumpaet, Melinda Lydia Nelwan, Dian Nirmala Dewi,
Article information:
To cite this document:Susi Sarumpaet, Melinda Lydia Nelwan, Dian Nirmala Dewi, (2017) "The value relevance of environmental performance: evidence from Indonesia", Social Responsibility Journal, Vol. 13 Issue: 4, pp.817-827, https://doi.org/10.1108/
SRJ-01-2017-0003
Permanent link t o t his document :
https://doi.org/10.1108/SRJ-01-2017-0003
Downloaded on: 12 Oct ober 2017, At : 18: 57 (PT)
Ref erences: t his document cont ains ref erences t o 51 ot her document s. To copy t his document : permissions@emeraldinsight . com
The f ullt ext of t his document has been downloaded 45 t imes since 2017*
Users who downloaded this article also downloaded:
(2017),"CSR and cost of capital: evidence from Japan", Social Responsibility Journal, Vol. 13 Iss 4 pp. 798-816 <a href="https://doi.org/10.1108/SRJ-10-2016-0170">https://doi.org/10.1108/SRJ-10-2016-0170</a>
(2017),"What drives employees to participate in corporate volunteering programs?", Social Responsibility Journal, Vol. 13 Iss 4 pp. 661-677 <a href="https://doi.org/10.1108/SRJ-06-2017-0097">https://doi.org/10.1108/SRJ-06-2017-0097</a>
Access t o t his document was grant ed t hrough an Emerald subscript ion provided by emerald-srm: 600023 [ ]
For Authors
If you would like t o writ e f or t his, or any ot her Emerald publicat ion, t hen please use our Emerald f or Aut hors service inf ormat ion about how t o choose which publicat ion t o writ e f or and submission guidelines are available f or all. Please visit www. emeraldinsight . com/ aut hors f or more inf ormat ion.
About Emerald www.emeraldinsight.com
Emerald is a global publisher linking research and pract ice t o t he benef it of societ y. The company manages a port f olio of more t han 290 j ournals and over 2, 350 books and book series volumes, as well as providing an ext ensive range of online product s and addit ional cust omer resources and services.
Emerald is both COUNTER 4 and TRANSFER compliant. The organization is a partner of the Committee on Publication Ethics (COPE) and also works with Portico and the LOCKSS initiative for digital archive preservation.
*Relat ed cont ent and download inf ormat ion correct at t ime of download.
The value relevance of environmental
performance: evidence from Indonesia
Susi Sarumpaet, Melinda Lydia Nelwan and Dian Nirmala Dewi
Susi Sarumpaet is Senior
Purpose–This paper aims to extend previous developed market-based research on the value relevance of environmental performance by testing the relationship between share prices of Indonesian-listed corporations and their environmental performance ratings.
Design/methodology/approach–The sample consists of 60 listed firms which are rated by the Indonesia Ministry of Environment between 2002 and 2012, resulting in a sample of 246 observations. The Ohlson (1995) model was utilized and modified by including environmental ratings.
Findings–The research finds that superior environmental performance is associated with higher share price, whereas inferior environmental performance is value irrelevant to the market.
Research limitations/implications–Considering the significance of PROPER, this research did not observe other types of corporate environmental performance, such as those released by the press and reported in the company annual reports and websites. These limitations are not controlled for in the tests, and this might confound inferences.
Originality/value–The paper addresses a gap in the literature by providing insight on how a developing capital market values both superior and inferior environmental performance. It also provides implication on the effectiveness of environmental monitoring policy in providing incentives for firms to improve their environmental performance
Keywords Indonesia, Share price, Value relevance, Environmental performance, Developing market Paper typeResearch paper
1. Introduction
This research extends prior extensive work from developed markets on the value relevance of environmental performance. Using a sample of companies listed on Indonesia Stock Exchange, we examine whether the environmental performance of Indonesian firms is value-relevant and useful for predicting future returns. Following prior studies on the value relevance of financial and non-financial information (Hughes, 2000;Clarksonet al., 2004;
Middleton, 2015; Hassel et al., 2005), we applied the Ohlson (1995) model to test the relationship between the share prices of Indonesian-listed corporations and their environmental performance ratings.
The results of previous studies have been mixed, with the majority of findings in support of the argument that environmental performance is valued by investors as reflected in increased share prices (Hughes, 2000;Ba and Stallaert, 2013;Middleton, 2015). However, some studies found inconsistent results (Amatoet al., 2011;Endrikat, 2015;Hasselet al., 2005). The various ways of measuring environmental performance might have been attributed to the inconclusiveness. The literature reports different measures of environmental performance, including environmental ratings or rankings, scores and indexes, environmental innovations, violations, level of emissions/pollutions, companies with hazardous sites and number of Superfund sites for partially responsible parties (Clarksonet al., 2004.;Decker and Jalbert, 2003;Johnson, 1995;Konar and Cohen, 2001;
Shadbegian and Gray, 2003;Hutchison, 1997). Some of these indicators only measure
Received 4 January 2017 Revised 13 March 2017 Accepted 22 March 2017
either negative or positive performance (e.g. environmental violations or innovations), whereas others incorporate both superior and inferior performance (e.g. environmental ratings and indexes). These indicators are mostly released by external parties, such as government and private environmental agencies through an independent evaluation, whereas others are derived from internal reports and announcements provided by internal management.
In this study, we used PROPER ratings by Indonesia Ministry of Environment which is considered suitable and reliable for this type of study because of the following reasons. First, PROPER ratings are released by the government agency through an independent and thorough evaluation on the documentation and verification process. Second, the ratings incorporate good and poor performance in a five-color code scale, which enables us to examine both types of performance in relation to the share values. Third, the ratings were disclosed annually to the public, and thus potentially reduce information asymmetry. This objective and rigorous measure by an independent party with subsequent public disclosure, which distinguishes both poor and good performers in the form of five-color code ratings, provides contribution to the literature.
PROPER targets selected Indonesian companies whose operational impacts are considered significant to the environment. Initiated in 1995 as a pilot project funded by the World Bank, PROPER was suspended during the Asian 1997-1998 financial crisis and revived in 2002 under the state budget, and the results were released in 2003. The number of PROPER participants has increased over time, from 82 in 2002 to more than 1,000 in 2012. Due to its limited economic resources, PROPER only evaluates companies whose environmental impacts are considered significant, but the government hopes to expand coverage over time. One of its purposes is to provide rewards and punishment mechanism for targeted companies based on their environmental performance. By publicly releasing their environmental performance ratings to the stakeholders the ministry expects that the PROPER ratings will influence stakeholders in making investment and related decisions (Indonesia Ministry of Environment, 2012). For instance, green investors and creditors may use PROPER ratings in assessing the risks and return of the rated firms. Meanwhile, green consumers may find PROPER ratings useful for making purchase decisions.
After nearly two decades of implementation, however, there has been little research undertaken to evaluate the effectiveness of the PROPER program, specifically on how different stakeholders value such information as a reward and punishment mechanism, as intended by the ministry. Previous studies on PROPER focus on the changes of emissions concentrations by the rated facilities after the program implementation (Afsah, 1996;
Blackmanet al., 2004). Therefore, the results of study also provide practical implication on the implementation of Indonesian government policy of environmental monitoring program.
2. The value relevance of environmental performance
2.1 The value relevance of non-financial information
In capital markets research, financial information derived from accounting reports is considered to be value-relevant because it indicates future profitability, and is thus used by market participants in corporate valuation (Beaver, 2002). While only some economic activities are manifested in current earnings, other information about current economic performance and its implications for future profitability can be assessed by capital market participants (Jiambalvoet al., 2002). If it has implications for future earnings, then it will be reflected in current share prices.
Companies are competing for limited capital resources; therefore, information about earnings is of particular interest for investors in relation to their investment decisions. Early studies (Ball and Brown, 1968; Beaver, 1968) expound that earnings information contributes to the changes in the market value of a company, hence has been used to
predict future earnings. Similarly, Nichols and Wahlen (2004) assert current period earnings offer wealth creation information that is useful for predicting future earnings.
Earnings information may be more value-relevant to the market than the book value of equity for companies that have a good financial condition (Barthet al., 1998a) and may provide complementary information to book value of equity when abnormal earnings are more persistent (Ohlson, 1995). However, book value of equity (which is the information provided by the balance sheet) is adequate to determine the market value of a normal-growth corporation (Nwaeze, 1998) and is deemed to be more relevant than earnings information where losses are more prevalent and one-time items are substantially impounded in earnings (Barthet al., 1998b). Therefore, the complementary value relevance of earnings and book value in various contexts has been a particular interest in extant value relevance studies.
The literature suggests that the value relevance of accounting information has declined over time due to various reasons (Hail, 2013; Nilsson, 2003; Scott, 2003). In fact, sophisticated investors not only utilize financial but also non-financial information to predict future earnings, and this information may be impounded in the current share prices (Jiambalvo et al., 2002). Accordingly, although non-financial information might not be manifested in current earnings, it may have an impact on future earnings. Therefore, accounting information may not adequately represent future corporate financial performance.
The value relevance of information beyond earnings and book value has also been investigated by many studies, which includes financial and non-financial information. For example,Barthet al.(1998a)studied the relationship between market values and estimates of brand value; other scholars investigated the value relevance of non-financial information, such as population size (Amir and Lev, 1996), intangible assets (Barth and Clinch, 1998) and various measures of internet usage in the valuation of internet companies (Trueman et al., 2000).
Extensive research on how environmental performance information affects share prices have been initiated since the mid-1970s. With some exceptions likeHull’s (1978)that used a field behavioral experiment, most studies from various countries typically utilize event study method or apply a valuation model (Belkaoui, 1976; Ingram and Frazier, 1980;
Stevens, 1984;Hamilton, 1995;Dasgupta and Laplante, 2001;Hasselet al., 2005;Moneva and Cuellar, 2009;Fazziniet al., 2016). There are two types of environmental information used in these studies: environmental disclosure and environmental performance. The former uses environmental information provided by the companies in their annual reports or corporate announcements, and thus may raise question of bias due to subjectivity of internal management that tends to disclose favorable information (Verrechia, 1983). However, measurement of this variable is relatively consistent across different studies, and there is no substantial debate on the way it is measured (Moneva and Cuellar, 2009;Fazzini et al., 2016). The latter uses environmental performance, ratings or indexes which varies in the way it is measured and might have been attributed to the inconclusiveness of the findings (Ba and Stallaert, 2013;Endrikat, 2015;Hasselet al., 2005;Middleton, 2015).
2.2 Environmental performance and its value relevance
The various measures of environmental performance have been documented in prior literature, such as environmental fines and achievements (Lorraine et al., 2004), toxics release inventory (TRI) by US-EPA (Patten, 2002), environmental ratings by the Russian Independent Ecological Rating Agency (NERA) (Middleton, 2015), events of environmental violation of existing laws and regulations (Xu et al., 2012), damage awards (Hall and Stammerjohan, 1997), partially responsible party by US-EPA (Hutchison, 1997) and environmental news (Dasguptaet al., 2006;Deák and Karali, 2014). These studies used third-party’s information in determining environmental performance, and the measurement
varies from a dichotomous category (for bad news and good news) to a ratio scale. The information derived from independent parties, such as environmental protection and rating agencies, is argued to be more independent and objective as compared to that provided by the internal management, such as voluntary environmental disclosures.
However, some environmental rating agencies may release environmental performance indicators (i.e. ratings, scores, indexes or awards) using the data obtained from corporate annual reports or announcements and base their indicators on these. For example,Amato et al. (2011) used “The Greenest Big Companies in America” published by Newsweek
magazine. Ba and Stallaert (2013) searched for the announcements of green vehicle innovations by the automakers using Dow Jones Factiva database. The various measures of environmental performance might have contributed to the mixed findings of prior studies.
To measure environmental performance in this study, we use PROPER ratings, which are released annually by Indonesia Ministry of Environment (formerly Indonesia Environmental Protection Agency) since 2002. The PROPER program covers large companies whose operating facilities are considered as having significant impacts on the environment. The ministry expects that the ratings will provide a stick and carrot mechanism (e.g. companies with superior performance are expected to gain rewards by experiencing higher sales, higher share prices, lower costs of capital, and vice versa). PROPER ratings are given based on the documentation provided by the participating companies and the environmental audit performed by the ministry. The process incorporates three distinct steps: data collection and verification from different sources at the participating plants, data analysis and assigning ratings with subsequent public disclosure (Indonesia Ministry of Environment, 2012). The use of PROPER ratings in this study is expected to provide a better measure of environmental performance, and therefore is more reliable in examining its value relevance.
Besides PROPER ratings, a limited number of Indonesian companies also regularly receive environmental performance awards from other organizations, such as Yayasan Keanekaragaman Hayati (Kehati) and La Tofi School of CSR. The former is a non-governmental organization founded in 1995 and annually grants Kehati Environmental Awards to individuals and organizations, whereas the latter have been conducting Indonesia Green Awards (IGA) to individual, government and business organizations since 2010. However, considering the limited coverage of these environmental awards and to maintain consistency, we exclude this information from our study.
Prior research in value relevance of environmental performance dominated by studies from developed markets, such as the USA, Australia, European countries and used samples from different types of industry. The majority of the findings support the argument that environmental performance is positively associated with share price. For example,Hughes (2000)examines the value relevance of air pollution measures and finds that this proxy is value-relevant for high-polluting electric utilities targeted for air pollution abatement by the US Clean Air Act Amendments (CAAA). A study byShane and Spicer (2012)uses four industries: pulp and paper, electric power, iron and steel and petroleum and finds price movements are associated with the release of eight major studies conducted by the CEP of firms’ environmental performances. The findings of these studies are consistent with the hypothesis that environmental performance is positively associated with share price. However, the specific findings have been mixed. For instance,Hasselet al.(2005)find a negative relationship between environmental performance and the market value of equity. Even though their results confirm that environmental performance has an incremental explanatory power, as suggested by the literature, their finding indicates that firms rated highly in terms of environmental performance are not valued highly by investors. Furthermore, a study byAmatoet al.(2011)that examines the impact of Newsweek’s “The Greenest Big Companies in America” on stock values for large US companies reveals a positive impact on stock values from favorable environmental performance, but finds no
effect for low-ranked firms.Endrikat (2015)finds a positive relationship across studies in terms of positive market reactions to positive events and negative reactions to negative events; however, the findings show that the market reactions are stronger for negative events than for positive events.
Based on these inconsistent results, a new investigation on the value relevance of environmental performance information will have an important contribution to the existing literature. Using a different context and measures of environmental performance, it is expected that this research will provide empirical findings on how environmental-related information influences share markets. The focus on Indonesia as an emerging economy is timely and important, as major existing literature comes almost exclusively from developed nations.
Information regarding environmental performance ratings can be value-relevant if it provides additional information to the accounting numbers and helps investors assess the future financial performance of firms. As discussed earlier, firms with superior performance may gain benefits from such ratings because they are protected from environmental costs or liabilities. Firms with good PROPER ratings can have higher reputation and legitimacy, which may improve their competitive advantages and future profitability. As PROPER ratings indicate future profitability, we predict that PROPER ratings are valued by investors as reflected in share prices. The hypothesis to be tested for this research is:
H1. Environmental performance ratings are value-relevant to the market.
3. Research design and method
3.1 Sample and data selection
The population of this study consists of 71 unique listed companies covered under PROPER from the period of 2003 to 2012 (except for 2006 and 2007 when PROPER was suspended). This forms 313 firm-year observations. As the sampling method is based on the availability of data, companies that do not provide the information needed for this study are excluded from the sample. After cleaning for the unavailable data, the sample consists of 62 unique companies forming 256 firm-year observations. Further, observations with negative book value of equity were excluded from the sample to isolate the effect of the negative information on share prices. The final sample consists of 246 observations from 60 unique companies.
The two types of data sources used in this study are financial data and environmental performance data. The financial data were mainly collected from electronic database, OSIRIS. When these databases failed to provide such data, corporate financial reports from the Indonesia Stock Exchange website and ICMD (Indonesian Capital Market Directory) were used to obtain financial figures. Data regarding environmental ratings (PROPER) were obtained from the website of the Indonesia Ministry of Environment when such ratings were released. PROPER includes both listed and unlisted companies and the latter, which greatly outnumbered the former, were excluded from the sample.
3.2 Research model
The value relevance of environmental ratings in this study is examined using theOhlson (1995)
model modified by including the environmental ratings. FollowingClarksonet al.(2004), the model was expanded later in the additional tests by including other financial information in the control variables, in which it is argued that environmental ratings are information incremental to those of accounting information. The complete model is as follows:
SPit⫽ ␦0⫹ ␦1Eit ⫹␦2BVit⫹ ␦3PROPERit⫹ it Where:
SPit ⫽Share prices of companyiat yeart;
Eit ⫽Earnings per share of companyiat yeart;
BVit ⫽Book value per share of companyiat yeart; and
PROPERit ⫽Environmental Performance (PROPER) ratings of companyiat yeart.
To measure the dependent variable, this study uses share prices three months after the end of fiscal year. In this case, they are the share prices as of March 31 the following year of the related financial reports. Share prices represent firms’ expected future cash flows, and therefore provide a more objective measure of firms’ financial performance. Earnings per share is measured by earnings before interest and taxes divided by number of shares outstanding. According toBall and Brown (1968),Beaver (1968)andTucker and Zarowin (2006), earnings which are the product of income statements have a role in determining firms’ market value. This is because studies have shown that earnings contain information useful for shareholders to examine firms’ value.
Book value per share is calculated by dividing book value of equity by the number of shares outstanding. Book value of equity is the product of the balance sheet (or statement of financial position) and is deemed value-relevant because it provides information that can affect the value of equity.Ohlson (1995)states that the current book value can be a factor in determining future earnings, thus providing a fair estimation for the market value of the firms.
To operationalize the variable for environmental performance, this study uses PROPER ratings. PROPER rates corporate environmental performance using five color codes: black, red, blue, green and gold, indicating the poorest to best environmental performance (Indonesia Ministry of Environment, 2012). Black was given to facilities that made no effort in pollution control or environmental documentation. Red was rewarded to facilities with little effort and insufficient reporting and failed to meet legal standards in environmental effort. Blue facilities have met legal standards and had reasonable frequency of reporting. Green was intended for the “proactive” companies and was awarded if pollution was significantly below legally required standards and the firm conducted good equipment maintenance, reporting and environmental work. Gold was intended to those who have met international standards of environmental management systems. PROPER ratings provide information about corporate environmental performance to stakeholders such as equity investors.
As PROPER evaluates and rates companies of their selection based on operating facilities, such as manufacturing plants, companies with more than one facility will be likely to earn more than one rating, the ratings were averaged. For example, in 2001, PT. Indocement Tunggal Prakasa Tbk. (IDX ticker: INTP) was awarded two blues and one green for its three facilities located in different areas. The average rating for INTP is 3.33. Furthermore, companies with PROPER ratings larger than 3 were categorized as good performers, and poor performers otherwise.
To increase the goodness of fit of our model, we include control variables in an additional test, namely, growth, liquidity and leverage. Growth is proxied by the percentage of changes in sales. This is one indicator of firms’ potential future financial performance because it provides information regarding future investment opportunities (Minnis, 2011). As a result, shareholders may consider that this information is valuable to capture firms’ future performance. Liquidity is measured by total assets divided by total liabilities. Liquidity is one indicator of firms’ performance. Firms that are more liquid have more financial resources to conduct environmental-related activities as a signal of their capacity in complying with environmental regulation. Leverage is calculated by dividing total liabilities by total assets. Leverage captures firms’ capacity to finance their assets through debt (Clarkson et al., 2004). Higher debts to assets ratio results in a highly leveraged company which makes it riskier to invest in. This means if a company defaults, shareholders may lose all their investments.
4. Results and discussion
4.1 Descriptive statistics
The descriptive statistics of 246 observations are presented inTable I. On average, the share prices of all companies are around Rp3,500, with the minimum of Rp50 and maximum of Rp55,050. This shows the relative wide range of samples. The earnings per share is approximately Rp223, while the book value per share has an average of Rp1,760. However, it can be seen from the table that there are companies with negative earnings which might influence the examination. PROPER ratings are around 2.96, in which the average samples can be categorized as poor environmental performers. The sample companies have PROPER ratings as low as 1 and as high as 4.5.
4.2 Regression results
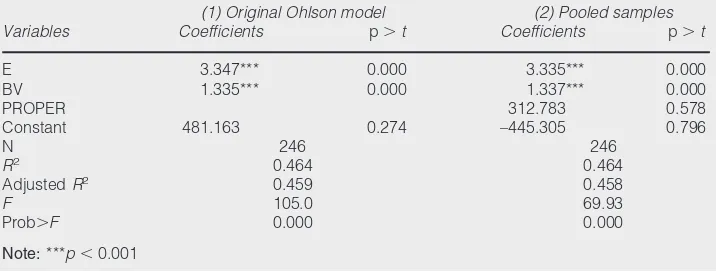
The first regression was conducted on the original Ohlson model. The results inTable II
show that the basic assumption of accounting information value relevance still holds (Model 1). To test the hypothesis whether environmental performance is value-relevant information, the regression was conducted on the pooled samples (Model 2). Although accounting information is still value-relevant to the market, PROPER is not (p-value ⫽ 0.578). However, reflecting on the descriptive statistics where, on average, the samples are comprised of poor performers, it would be problematic to draw an early conclusion about the results because different performance might affect the share prices differently. Hence, additional testing was conducted to refine the results.
Table IIIshows that accounting information is not the only value-relevant for the market. After the sample was split into good and poor performers, we found that, for good performers, PROPER is positively associated with share price atp⫽0.001. Comparing with the explanatory power of the original Ohlson model that is approximately 46 per cent, the model on good performers has higher explanatory power of around 56 per cent. The findings confirm that the good environmental performance information is value-relevant to the market. However, the results cannot be found on poor environmental performance. This
Table I Descriptive statistics
Variables Obs Mean SD Minimum Maximum
SP 246 3,577.472 7,734.751 50 55,050
E 246 223.2654 830.1167 –6,433 4,415
BV 246 1,760.245 2,582.335 5 15,353
PROPER 246 2.958293 0.6486554 1 4.5
Notes:SP: share price; E: earnings per share; BV: book value per share; PROPER: PROPER ratings
Table II Regression results on the original Ohlson (1995) model and pooled data
Variables
(1) Original Ohlson model (2) Pooled samples Coefficients p⬎t Coefficients p⬎t
E 3.347*** 0.000 3.335*** 0.000
BV 1.335*** 0.000 1.337*** 0.000
PROPER 312.783 0.578
Constant 481.163 0.274 –445.305 0.796
N 246 246
R2 0.464 0.464
AdjustedR2 0.459 0.458
F 105.0 69.93
Prob⬎F 0.000 0.000
Note:***p⬍0.001
indicates that the market values environmental performance of good and poor performers differently.
Good environmental performance, according toHasselet al.(2005), might be a form of value creation. Companies that performed well environmentally may position themselves as having competitive advantage, which can be translated into better financial returns to the shareholders. Similarly, the positive market response might be because of the capacity of a firm in building good relations with its primary stakeholders (i.e. customers, communities, employees and suppliers). These good relations are also valuable to create competitive advantage, thus leading to the increase in shareholders’ wealth (Hillman and Klein, 2001).
It can also be argued that good environmental performers might have better financial condition (Al-Tuwaijriet al., 2004), thus were able to adopt better environmental practices. On the other hand, good environmental performance can also be an indication of corporate ability to avoid future environmental costs. These companies might be better off in the future. Consequently, those that do not perform well might be penalized by the market by the discounted share prices (Clarksonet al., 2004).
As mentioned earlier, a number of control variables, namely, growth, leverage, and liquidity were added to the model. However, none of those was found to be significantly associated to the changes of share price. We also found that these added variables did not serve the initial purpose as they were unable to increase the goodness of fit of our model. Therefore, we limit our analysis on the use of basic Ohlson model modified by featuring only the firms’ environmental performance ratings.
5. Conclusions
This paper investigates whether corporate information of environmental performance is value-relevant. Using environmental performance ratings by Indonesia Ministry of Environment, called the PROPER ratings, we tested whether such information influences share prices in Indonesian capital market. Prior studies from different contexts using various measures of environmental performance have resulted in mixed findings. The use of Indonesia as an emerging economy and PROPER ratings, which indicate both negative and positive environmental performance, provide contribution to the empirical findings on how financial and non-financial information can be both value-relevant (Jiambalvoet al., 2002;Clarksonet al., 2004).
This research uses a sample of 60 firms during 2003-2012, resulting in 246 firm-year observations as our final sample. FollowingClarksonet al.(2004)who modified theOhlson (1995)model, this study examines the value relevance of environmental performance by regressing the share prices with earnings (EPS), book value (BVS) and PROPER ratings. We did not find significant results on the overall model using the pooled data. However, when the sample was split into good and poor performers, we find a positive relationship
Table III Regression results on split samples
Variables
(3) Good performers (4) Poor performers Coefficients p⬎t Coefficients p⬎t
E 3.196*** 0.000 2.510 0.051
BV 1.045*** 0.000 2.126*** 0.000
PROPER 3,701.308*** 0.000 –4,024.125 0.064
Constant –11,308.616*** 0.000 8,585.550 0.076
N 174 72
R2 0.569 0.499
AdjustedR2 0.561 0.476
F 74.72 22.54
Prob⬎F 0.000 0.000
Note:***p⬍0.001
between PROPER and share prices among superior performers (firms with good ratings), although such association was not found among inferior performers (firms with poor ratings). This confirms that the market values environmental performance of superior and inferior performers differently. It also indicates that environmental performance information partly complements accounting information and can be useful in explaining market values of Indonesian stock market.
There are several limitations of this study. First, due to limited funding, PROPER only rates a small portion of listed companies, mostly those that are large and environmentally sensitive. This selection creates obvious issues in the sample selection bias, because the stock market could also value environmental performance of smaller and less environmentally sensitive firms. Second, this study did not observe different types of corporate environmental performance other than PROPER. Environmental events involving corporations which are reported by the press may also contain information for investors in assessing firm value. These limitations are not controlled for in the tests and potentially confound inferences.
Extensive research on this topic mostly used archival method using secondary data. This opens opportunities for further investigations. The use of financial analysts in an experimental or survey setting would advance the research methodology and improve the understanding on how the stock market values environmental performance. Finally, this study also offers practical implications for management and regulators, such as the Indonesia Ministry of Environment, on the effectiveness of the PROPER program. Our finding shows that Indonesian capital market values positive rather than negative environmental ratings, implying that the rewards mechanism seems to function better than the punishment.
References
Afsah, S. (1996), “Going public on polluters in Indonesia: Bapedal’s Proper Prokasih Program”, available at:www.worldbank.org/nipr/work_paper/proper/#toc1
Al-Tuwaijri, S.A., Christensen, T.E. and Hughes, K.E. (2004), “The relations among environmental disclosure, environmental performance, and economic performance: a simultaneous equations approach”,Accounting, Organizations and Society, Vol. 29 Nos 5/6, p. 447.
Amato, L.H., Amato, C.H. and Carolina, N. (2011), “Environmental policy, rankings and stock values”,
Business Strategy and the Environment, available at:http://doi.org/10.1002/bse.742
Amir, E. and Lev, B. (1996), “Value-relevance of nonfinancial information: the wireless communications industry”,Journal of Accounting and Economics, Vol. 22 Nos 1/3, pp. 3-30.
Ba, S. and Stallaert, J. (2013), “Stock market reaction to green vehicle innovation”,Production and Operation Management, Vol. 22 No. 4, pp. 976-990.
Ball, R. and Brown, P. (1968), “An empirical evaluation of accounting income numbers”,Journal of Accounting Research, Vol. 6 No. 2, pp. 159-178.
Barth, M.E. and Clinch, G. (1998), “Revalued financial, tangible, and intangible assets: associations with share prices and non-market-based value estimates”,Journal of Accounting Research, Vol. 36 No. 1, pp. 199-233.
Barth, M.E., Beaver, W.H. and Landsman, W.R. (1998a), “Relative valuation roles of equity book value and net income as a function of financial health”,Journal of Accounting and Economics, Vol. 25 No. 1, pp. 1-34.
Barth, M.E.C., Beaver, M.F., George, F. and Kasznik, R. (1998b), “Brand values and capital market valuation”,Review of Accounting Studies, Vol. 3 No. 1, pp. 41-68.
Beaver, W.H. (1968), “The information content of annual earnings announcements”, Journal of Accounting Research1, Vol. 6, pp. 67-92.
Beaver, W.H. (2002), “Perspectives on recent capital market research”, The Accounting Review, Vol. 77 No. 2, pp. 453-474.
Belkaoui, A. (1976), “The Impact of the disclosure of the environmental effects of organizational behaviour on the market”,Financial Management, Vol. 5 No. 4, p. 26.
Blackman, A., Afsah, S. and Ratunanda, D. (2004), “How do public disclosure pollution control programs work? Evidence from Indonesia”,Human Ecology Review, Vol. 11 No. 3, pp. 235-246.
Clarkson, P.M., Li, Y. and Richardson, G.D. (2004), “The market valuation of environmental capital expenditures by pulp and paper companies”,The Accounting Review, Vol. 79 No. 2, pp. 329-353.
Dasgupta, S. and Laplante, B. (2001), “Pollution and capital markets in developing countries 1”,
Journal of Environmental Economics and Management, Vol. 42 No. 3, pp. 310-335.
Dasgupta, S., Ho, J., Laplante, B. and Mamingi, N. (2006), “Disclosure of environmental violations and stock market in the Republic of Korea i”,Ecological Economics, Vol. 58 No. 1, pp. 759-777.
Deák, Z. and Karali, B. (2014), “Stock market reactions to environmental news in the food industry”,
Journal of Agricultural and Applied Economics, Vol. 46 No. 2, pp. 209-225.
Decker, J.L. and Jalbert, T. (2003), “An empirical analysis of where firms choose to emit and corresponding firm performance”, Journal of American Academy of Business, Cambridge, Vol. 3 Nos 1/2, p. 190.
Endrikat, J. (2015), “Market reactions to corporate environmental performance related events: a meta-analytic consolidation of the empirical evidence”,Journal of Business Ethics, Vol. 3, pp. 1-14.
Fazzini, M., Dal, L., Fazzini, M. and Maso, L.D. (2016), “Experience the value relevance of ‘assured’ environmental disclosure the Italian experience”,Sustainability Accounting, Management and Policy Journal, Vol. 7 No. 2, pp. 225-245.
Hail, L. (2013), “Financial reporting and firm valuation: relevance lost or relevance regained?”,
Accounting and Business Research, Vol. 43 No. 4, pp. 329-358.
Hall, S.C. and Stammerjohan, W.W. (1997), “Damage awards and earnings management in the oil industry”,The Accounting Review, Vol. 72 No. 1.
Hamilton, J.T. (1995), “Pollution as news: media and stock market reactions to the toxics release inventory data”,Journal of Environmental Economics and Management, Vol. 28 No. 1, pp. 98-113.
Hassel, L., Nilsson, H. and Nyquist, S. (2005), “The value relevance of environmental performance”,
European Accounting Review, Vol. 14 No. 1, pp. 41-61.
Hillman, A. and Klein, G.D. (2001), “Shareholder value, stakeholder and social issues: what â€TMs
management”,Strategic Management Journal, Vol. 22 No. 2, pp. 125-139.
Hughes, K.E. (2000), “The value relevance of nonfinancial measures of air pollution in the electric utility industry”,The Accounting Review, Vol. 75 No. 2, pp. 209-228.
Hull, R.P. (1978),An Investigation of The Impact of Environmnetal Disclosure on Stock Investment Decision: A Behavioral Field Experiment, Oklahoma State University, Oklahoma.
Hutchison, P.D. (1997), An Examination of the Information Content of A Specific Environmental Disclosure, Potentially Responsible Party Status, in Publicly held Corporations, Texas Tech University, Texas.
Indonesia Ministry of Environment (2012), “PROPER Program Peniliaian Peringkat Kinerja Perusahaan dalam Pengelolaan Lingkungan Hidup”, Jakarta.
Ingram, R.W. and Frazier, K.B. (1980), “Environmental performance and corporate disclosure”,Journal of Accounting Research, Vol. 18 No. 2, pp. 614-662.
Jiambalvo, J., Rajgopal, S. and Venkatachalam, S.M. (2002), “Institutional ownership and the extent to which stock prices reflect future earnings”, Contemporary Accounting Research, Vol. 191, pp. 117-145.
Johnson, S.D. (1995),An Analysis of the Relationship between Corporate Environmental and Economic Performance at the Level of the Firm, University of California, Irvine, California.
Konar, S. and Cohen, M.A. (2001), “Does the market value environmental performance?”,The Review of Economics and Statistics, Vol. 83 No. 2, p. 281.
Lorraine, N.H.J., Collison, D.J. and Power, D.M. (2004), “An analysis of the stock market impact of environmental performance information”,Accounting Forum, Vol. 28 No. 1, pp. 7-26.
Middleton, A. (2015), “Value relevance of firms’ integral environmental performance: evidence from Russia”,Journal of Accounting and Public Policy, Vol. 34 No. 2, pp. 204-211.
Minnis, M. (2011), “The value of financial statement verification in debt financing: evidence from private US firms”,Journal of Accounting Research, Vol. 49 No. 2, pp. 457-506.
Moneva, J.M. and Cuellar, B. (2009), “The value relevance of financial and non-financial environmental reporting”,Environmental and Resource Economics, Vol. 44 No. 3, pp. 441-456.
Nichols, D.C. and Wahlen, J.M. (2004), “How do earnings numbers relate to stock returns? A review of classic accounting research w”,Accounting Horizons, Vol. 18 No. 4, pp. 263-286.
Nilsson, H. (2003),Essays on the Value Relevance of Financial Statement Information: Studies in Business Administration (Vol. 50), Umeå University, Umeå.
Nwaeze, E.T. (1998), “Regulation and the valuation relevance of book value and earnings: evidence from the United States”,Contemporary Accounting Research, Vol. 15 No. 4, pp. 547-573.
Ohlson, J.A. (1995), “Earnings, book values, and dividends in equity valuation”, Contemporary Accounting Research, Vol. 11 No. 2, pp. 661-686.
Patten, D.M. (2002), “The relation between environmental performance and environmental disclosure: a research note”,Accounting, Organizations and Society, Vol. 27 No. 8, pp. 763-773.
Scott, W.R. (2003),Financial Accounting Theory, Third ed., Pearson Education Canada Inc, Toronto, Ontario.
Shadbegian, R. and Gray, W. (2003), “What determines environmental performance at paper mills? The roles of abatement spending, regulation, and efficiency”,Topics in Economic Analysis & Policy, Vol. 3 No. 1, p. 1144.
Shane, P.B. and Spicer, B.H. (2012), “Market response to environmental information produced outside the firm”,The Accounting Review, Vol. 58 No. 3, pp. 521-538.
Stevens, W. (1984), “Market reaction to corporate environmental performance”, Advances in Accounting, Vol. 1, pp. 41-61.
Trueman, B., Wong, M.H.F. and Zhang, X.J. (2000), “The eyeballs have it: searching for the value in internet stocks”,Journal of Accounting Research, Vol. 38 No. 1, pp. 137-162.
Tucker, J.W. and Zarowin, P.A. (2006), “Does income smoothing improve earnings informativeness?”,
The Accounting Review, Vol. 81 No. 1, pp. 251-270.
Verrechia, R.E. (1983), “Discretionary disclosure”,Journal of Accounting and Economics, Vol. 5 No. 1, pp. 179-194.
Xu, X.D., Zeng, S.X. and Tam, C.M. (2012), “Stock market’s reaction to disclosure of environmental violations: evidence from China”,Journal of Business Ethics, Vol. 107 No. 2, pp. 227-237.
Further reading
Clarkson, P.M., Li, Y., Richardson, G.D. and Vasvari, F.P. (2008), “Revisiting the relation between environmental performance and environmental disclosure: an empirical analysis”, Accounting, Organizations and Society, Vol. 33 Nos 4/5, pp. 303-327.
Corresponding author
Susi Sarumpaet can be contacted at:[email protected]
For instructions on how to order reprints of this article, please visit our website:
www.emeraldgrouppublishing.com/licensing/reprints.htm
Or contact us for further details:[email protected]