International Journal of Applied Business and Economic Research
ISSN : 0972-7302
available at http: www.serialsjournal.com
© Serials Publications Pvt. Ltd.
Volume 15 • Number 20 • 2017
Determine Student’s Loyalty with Student’s Trust As Moderating
Variable
Lusiah
1*, Paham Ginting
1, Arlina Nurbaity Lubis
1and Endang Sulistya Rini
1 1Universitas Sumatera Utara.*Correspondent author. E-mail: [email protected]
Abstract: The student’s attrition rate at five private universities in Medan is at 14.86%, this figure is considered very high. Students who dropped out of the university revealed many reasons about the disloyalty. The high level of student’s loyalty on their university showed from the less number of drop-out students. The less of attrition’s rate (drop-out) determine that the student who study at that program was loyal. This is applying otherwise, rate of the higher attrition that determine the lower of the student loyalty.
The purpose of this study is to determine the effect of the university’s image and student’s perceived value and student’s trust as moderating variable on student’s loyalty. This study involved 296 respondents from five private universities which have the largest number of students enrolled in the Faculty of Economics. SEM PLS with the help of a software called WarpPLS is used for data analysis. The results showed that the image of university and student’s perceived value have a positive and significant effect on student’s loyalty. The result also showed that student’s perceived value gives the greatest direct impact on student’s loyalty. Student’s trust has significant as moderating variable between student’s perceived value and student’s loyalty.
Keywords: Image, Perceived Value, Trust, Loyalty.
INTRODUCTION
Competition among universities makes higher education providers leave the context of improving the quality of higher education, they are more concerned with how to get the target number of students to ensure continuity of college operations. The number of private universities in the Province of North Sumatra is the largest on the island of Sumatra. (Statistic Indonesia, 2015). This shows that competition among private universities in North Sumatra Province is very high.
International Journal of Applied Business and Economic Research 154 Lusiah, Paham Ginting, Arlina Nurbaity Lubis and Endang Sulistya Rini
standard time period for the undergraduate program. The fewer levels of attrition (drop-out) indicated that students who study in the course are satisfied and will form loyalty later, vice versa. The level of drop-out students at Open University’s Faculty of Economics is quite high at 22% per semester (Mulyana and Ayuni, 2014). Online Universities or distance education have higher level of drop-out compared to conventional colleges (Barefoot, 2004). The level of drop out at online universities or distance education is at about 30-50% (Frankola 2001 in Yulselturk and Inan, 2006). In Asian countries it is recorded that the drop-out rate at online universities or distance education is at 50% (Shin and Kim, 1999 in Fozdar et al., 2006).
At Medan, five private universities that have the largest number of economy students namely, Univesitas Muhammadiyah Sumatera Utara, Universitas Prima Indonesia, Universitas Katolik Santo Thomas, Universitas Pembangunan Panca Budi and Universitas Methodist Indonesia (based on data processed from forlap.ristekdikti.go.id, 2016) have students drop-out level 18,76 % ; 14,19%; 12,05% ; 13,95% and 15,33% respectively. It can be concluded that the average level of student attrition at universities in Medan reached 14.86% per year.In accordance with the statement Barefoot (2004) which states the level of attrition at conventional universities are lower online universities or distance education.
Image of university and students perceived valueare the key to student loyalty. Also if an university can gain trust of student, so it can be concluded that students are going to be loyalor not.A university is said successful in producing qualified graduates only if the students feel satisfied with the process of studying. Student’s loyalty is the main thing that must be obtained by the college. A loyal student will certainly uphold his alma mater, will not drop-out in the middle of his studies and spread positive information to the public about the university where he or she is studying.
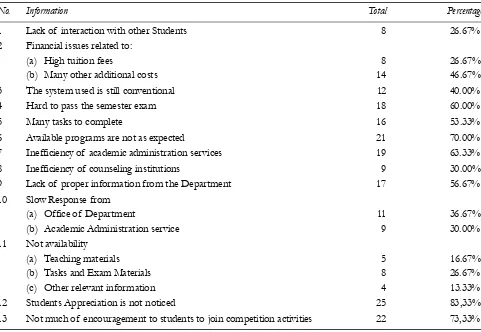
Following is the result of a survey conducted on the undergraduate Management Program at private universities in Medan, the initial survey of 30 respondents who were transfer students of the undergraduate Management Program was conducted at 10 universities in Medan City. The results of responses from 30 respondents can be seen in the table 1.
Based on the survey results, can be seen that the strong reason for students to move to other university is difficult to pass the exam and many tasks to be completed. Available programs are not as expected, Inefficiency of academic administration services, lack of proper information. Furthermore, University’s image is not as expected, Students Appreciation is not noticed and university did not much of encouragement to students to join competition activities
The research conducted by Kunanusorn and Puttawong (2015) shows a strong relationship between student’s value, image of university and student trust. Image has a direct and significant relationship to loyalty (Kunanusorn and Puttawong, 2015; Usman et al., 2016; Wong et al., 2016; Taecharungroj, 2014; Hasyim et al., 2015; Helgesen and Nesset, 2007). Sampaio, et al. (2012) emphasizes that in using services provided by the University, student trusts will first form student perceived value and then will form a decision to keep using the services provided in the future or to recommend it to others. Hasan, et al. (2014) states that trust is between perceived value and customer loyalty. Hashim, et al. (2015) explains that trust does not moderate the relationship between student’s perceived value and student’s loyalty.
Purpose of Study
Table 1
Reasons Students moved from previous University
No. Information Total Percentage
1 Lack of interaction with other Students 8 26.67%
2 Financial issues related to:
(a) High tuition fees 8 26.67%
(b) Many other additional costs 14 46.67%
3 The system used is still conventional 12 40.00%
4 Hard to pass the semester exam 18 60.00%
5 Many tasks to complete 16 53.33%
6 Available programs are not as expected 21 70.00%
7 Inefficiency of academic administration services 19 63.33%
8 Inefficiency of counseling institutions 9 30.00%
9 Lack of proper information from the Department 17 56.67%
10 Slow Response from
(a) Office of Department 11 36.67%
(b) Academic Administration service 9 30.00%
11 Not availability
(a) Teaching materials 5 16.67%
(b) Tasks and Exam Materials 8 26.67%
(c) Other relevant information 4 13.33%
12 Students Appreciation is not noticed 25 83,33%
13 Not much of encouragement to students to join competition activities 22 73,33% Sources: Initial survey of transfer students on 10 universities in Medan, 2016.
LITERATURE REVIEW Influence of University’s Image to Student’s Loyalty
The relationship between institutional image to loyalty lies in the desire and consumer choice. Decesion (Attitudes) toward a particular institution often affect whether the consumer will be loyal or not. Good perceptions and consumer’s trust in an institution will create consumer buying interest and even increase customer loyalty to the institution.
Analysis of the relation between institutional image with customer loyalty statistically shows that the image has a significant and positive influence on consumer loyalty (Tu, 2013, Barusman, 2014, Hashim, 2015, Kunanusorn and Puttawong, 2015; Usman and Mokhtar, 2016). The result of Hashim’s (2015) study explains that the influence of image on loyalty is greater than the influence of perception of value to loyalty.
The Effect of Student’s Perceived Value on Student’s Loyalty
International Journal of Applied Business and Economic Research 156 Lusiah, Paham Ginting, Arlina Nurbaity Lubis and Endang Sulistya Rini
Hashim et al. (2015) indicates that values have a direct positive and significant effect on student loyalty. Values also have a good effect as a mediating variable between image and loyalty.
However, Kunanusorn (2015) and Taecharungroj (2014) explained that the value are influenced more on loyalty through student satisfaction than directly. Several further studies indicate a strong relationship between consumer value and student loyalty. (Hasan et al., 2014; Carvalho, 2010)
The Impact of University’s Image on Student’s Perceived Value
Brown and Mozzarol (2008) Stated that institutional image has a strong effect on students’ perception of value. Kunanusorn and Puttawong (2015) Argue that students’ perceptions of value have the greatest impact on image, while Hashim et al (2015) also examines the strong relationship between institutional image and student perceptions. Tu, Li and Chi (2013) state that companies must build a positive image in the eyes of consumers. This is very important in creating good value from consumers.
The higher the identification with overall brand image, the higher the willingness of the students to enroll; likewise, the lower the identification with overall brand image, the lower the willingness of the students to enroll. Therefore, the overall brand image of schools was highly related to the customer lifetime value of students. (Chen and Chen, 2014).
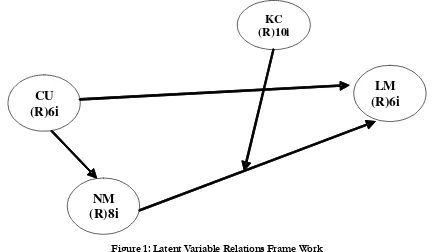
Conceptual Framework
According to reviewing the literatures, there are two independent latent variables which effects student loyalty: university’s image, student’s perceived value and one moderating variable is student’s trust. Student’s Perceived Value is an antecedent or mediator of a construct which is assumed to be the driver of student’s loyalty as will be subsequently discussed. The conceptual frame work and relations between latent variables of this research are presented in Figure 1 below.
CU
(R)6i
NM
(R)8i
LM
(R)6i
KC(R)10i
RESEARCH METHODOLOGY Population and Samples
The study involved five private universities in Medan specifically on the undergraduate Management Programs, namely as many as 296 students from Universitas Muhammadiyah Sumatera Utara, Universitas Prima Indonesia, Universitas Katolik Santo Thomas, Universitas Pembangunan Panca Budi, dan Universitas Methodist Indonesia. The election of five private universities is based on the highest number of students in the Faculty of Economics. Student sampling is based on students’ willingness to fill out questionnaires.
Measure of Concept
This research was a quantitative research. The model had been adjusted as latent and manifest variables in accordance with environment and culture of population aimed to be studied. An operational definition in questionnaire was tested and modified in case of some operational definitions that suitable for operation in the field.
Due to complex nature of the model, the Partial Least Squares (PLS) structure equation modeling approach was used to test the model. This procedure allowed us to test the proposed structure of the model totally.
Measurement for independent and dependent variables used was a seven-point Likert type response format, with “strongly disagree” to “strongly agree” (1 = strongly disagree, 2 = disagree, 3 = somewhat disagree, 4 = neither agree nor disagree, 5 = somewhat agree, 6 = agree, 7 = strongly agree). In measurement model, 21 indicators were used to measure study of latent constructs; student’s satisfaction (7 indicators), university’s image (6 indicators) and student’s perceived value (8 indicators).
Data Analysis
Data analysis technique used in this research is SEM (Structural Equation Model) analysis technique. SEM with component or variance basis is an alternative covariance with component-based approach with PLS which aim as prediction. Beside to confirm the theory, PLS also explain the presence or absence of relationships between latent variables, therefore in the framework of research-based predictions PLS is more suitable for analyzing data. PLS can simultaneously analyze constructs formed with reflective and formative indicators. This cannot be done by a Covarian-based SEM as it would be an unidentified model. There are 2 models that must be analyzed in PLS, namely: Assessing outer model or measurement model and Assessing inner model or structural model.
Analytical Results
Initially, results from description of respondents were summarized that 67.57% of them were females and 32.43% were males. 73.65% were just study not working and 26.35% study and working. Most of them (55.07%) know the university from friends and 58.11% of the students were in the 6th semester.
Validating Measurement Model and Validating Structural Model
International Journal of Applied Business and Economic Research 158 Lusiah, Paham Ginting, Arlina Nurbaity Lubis and Endang Sulistya Rini
are assessed in terms of the R2 values of the dependent variables on independent variables had a high value (50%) in the model.
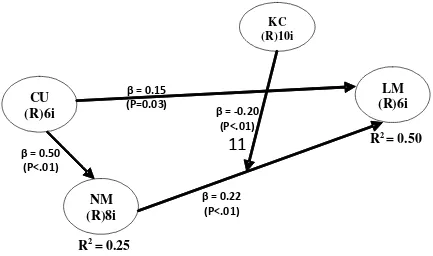
Figure 2: Latent Variable Relations Frame Work
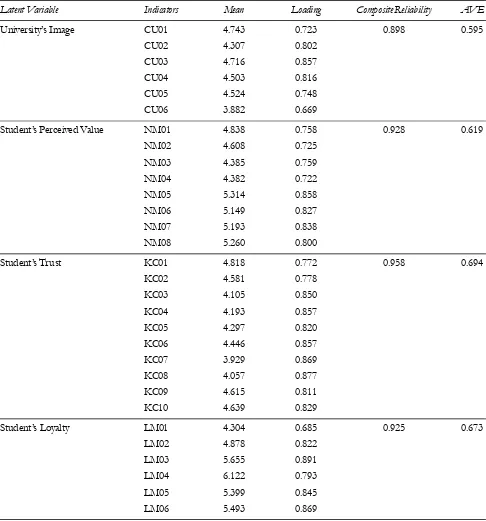
In outer model, the measure’s quality using the Loading (Table 1) of each measured variable was examined to ensure the measurement variable load meaningfully to their related constructs. Overall, the measurement variable loading are all relatively large and positive. An individual loading was exceeded 0.400-0.700 (Sholihin dan Ratmono, 2013) to ensure that at least half of the variance in the observed variable is shared with the construct.
An Average Variance Extracted (AVE) is used to check the validity of the measurement model which is widely used. To ensured discriminant validity of the constructs, the AVEs of the latent variables should be greater than the square of the correlations among the latent variables. The discriminant validity result which show the lowest value of AVE is 5,95. AVE value on CU latent variable. AVE value for each latent variable has the value greater than 0,5.
Moreover, in Table 2, table shows that the lowest value of cronbach alpha is 0,862 on CU latent variable. The lowest value of composite reliability 0,898 on CU latent variable. It shows that there are high consistency and stability of the instrument . In other words all constructs or variables of this study can already be a fitting gauge, and all the questions used to measure each construct have good reliability.
Testing The Hypotheses
Table 1
Summary of Results for Reflective Outer Model
Latent Variable Indicators Mean Loading Composite Reliability AVE
University’s Image CU01 4.743 0.723 0.898 0.595
CU02 4.307 0.802
CU03 4.716 0.857
CU04 4.503 0.816
CU05 4.524 0.748
CU06 3.882 0.669
Student’s Perceived Value NM01 4.838 0.758 0.928 0.619
NM02 4.608 0.725
NM03 4.385 0.759
NM04 4.382 0.722
NM05 5.314 0.858
NM06 5.149 0.827
NM07 5.193 0.838
NM08 5.260 0.800
Student’s Trust KC01 4.818 0.772 0.958 0.694
KC02 4.581 0.778
KC03 4.105 0.850
KC04 4.193 0.857
KC05 4.297 0.820
KC06 4.446 0.857
KC07 3.929 0.869
KC08 4.057 0.877
KC09 4.615 0.811
KC10 4.639 0.829
Student’s Loyalty LM01 4.304 0.685 0.925 0.673
LM02 4.878 0.822
LM03 5.655 0.891
LM04 6.122 0.793
LM05 5.399 0.845
International Journal of Applied Business and Economic Research 160 Lusiah, Paham Ginting, Arlina Nurbaity Lubis and Endang Sulistya Rini
Table 2
Assessment of the Validity of the Latent Variables Latent Variable Correlation
Latent Variables University’s Student’s Perceived Student’s Student’s Cronbach’s
Image Value Trust Loyalty � R2
University’s Image 0.772 0.498 0,349 0,451 0.862 0.000
Student’s Perceived Value 0.498 0.787 0,625 0,611 0.911 0.248
Student’s Trust 0.443 0.706 0,833 0,776 0.951 0.000
Student’s Loyalty 0,451 0,611 0,557 0,820 0.901 0.503
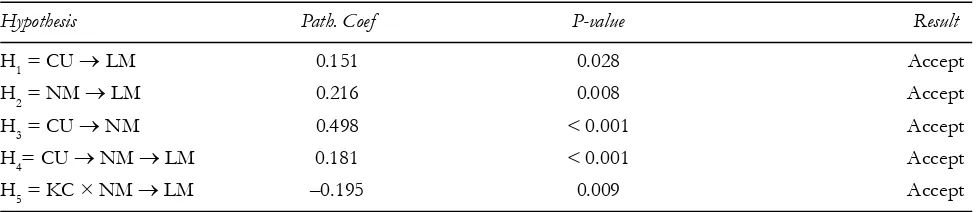
from Student’s Perceived Value to Student’s Loyalty is 0,216.P-values between University’s Image and Student’s
Perceived Value is P < 0.001, with path coefficient from University’s Image to Student’s Perceived Value is
0,498. P-values between University Image and Student’s Perceived Value as mediating variable is P < 0.001,
which is smaller than significance value of 0,05. Path coefficient from University Image and Student’s
Perceived Value as mediating variable to Student’s Loyalty is 0.181. P-values between Student’s Perceived
Value and Student’s Trust as moderating variable is 0.009, which is smaller than significance value of 0,05. Path coefficient from Student’s Perceived Value and Student’s Trust as moderating variable to Student’s Loyalty is -0,195. The indirect influence of the University’s Image on Student’s Loyalty through Student’s Perceived Value is significant. In other words, the Student’s Perceived Value significantly mediates the relationship between the University’s Image on Student’s Satisfaction.
Table 3
P-Value for Path Estimates
Hypothesis Path. Coef P-value Result
H1 = CU � LM 0.151 0.028 Accept
H2 = NM � LM 0.216 0.008 Accept
H3 = CU � NM 0.498 < 0.001 Accept
H4= CU � NM � LM 0.181 < 0.001 Accept
H5 = KC × NM � LM –0.195 0.009 Accept
In Table 3 shows that the positive hypotheses are supported and the proposed relationships are significant. The results from this study (including measures of overall quality and overall outcomes) also provides support to the hypothesized relationships. University’s image is a causal variable that put effect on the student’s loyalty, and there are influenced by mediating variables via Student’s perceived value.
CONCLUSIONS
The result of the research shows that the university’s image and student’s perceived value have a positive and significant influence either directly or indirectly to student’s loyalty. The results of this study are supported from previous research which also found that the university’s image and student’s perceived value influenced student’s loyalty (Tu, 2013; Barusman, 2014; Hashim, 2015; Kunanusorn dan Puttawong, 2015; Usman dan Mokhtar, 2016). The result of this research share the same result as Hashim, 2015 the university’s image gives a greater indirect impact on student loyalty through student value. In this research, Student’s trust in Medan, is measured by student’s trust about technical competence mastery, the University’s management team’s attitude, the openness to accept and share information, the sincerity to serve and consistency; in the end, trust can serve as moderating variable between student’s perceived value and student’s loyalty.
In conclusion, the students value can be one of the things that need to be considered as an important strategy for the planning of higher education institutions.
REFERENCES
Asmawi, MR. (2005), Strategi Meningkatkan Lulusan Bermutu di Perguruan Tinggi. Jurnal Sosial Humaniora. Vol. 9. No. 2. Desember 2005 : 66-71.
Brown, Robert M. and Timothy William Mazzarol. (2009), The importance of institutional image to student satisfaction and loyalty within higher education. High Educ. Vol. 58: 81-95.
Carvalho,Sergio W. and Ma´rcio de Oliveira Mota. (2010), The role of trust in creating value and student loyalty in relational exchanges between higher education institutions and their students. Journal of Marketing for Higher Education. Vol. 20(1): 145-165.
Chen, Chun-Fu dan Chin-Tsu Chen. (2014), The Effect of Higher Education Brand Images on Satisfaction and Lifetime Value from Students’ Viewpoint. Anthropologist, 17(1): 137-145.
Ghozali, Imam dan Latan, Hengky. (2014), Partial Least Squares Konsep, Teknik dan Aplikasi Menggunakan Program SmartPLS 3.0 Untuk Penelitian Empiris Edisi 2. Badan Penerbit Universitas Diponegoro Semarang.
Hasan, Haslinda, Teo Poh Kiong, and Raja Azimah Ainuddin, (2014), Effects of Perceived Value and Trust on Customer Loyalty towards Foreign Banks in Sabah, Malaysia. Global Journal of Emerging Trends in e-Business, Marketing and Consumer Psychology (GJETeMCP) An Online International Research Journal (ISSN: 2311-3170) 2014 Vol: 1 Issue 2.
Hashim, Noor Azmi, Aliyu Olayemi Abdullateef, and Bashir Danlami Sarkindaji, (2015), The Moderating Influence of Trust on the Relationship between Institutional Image/Reputation, Perceived Value on Student Loyalty in Higher Education Institution. International Review of Management and Marketing, 2015, 5(3), 122-128.
Helgesen, Øyvind and Erik Nesset. (2007), Images, Satisfaction and Antecedents: Drivers of Student Loyalty? A Case Study of a Norwegian University College. Corporate Reputation Review. Vol. 10(1): 38 –59.
Kunanusorn, Anusorn and Duangporn Puttawong. (2015), The Mediating Effect of Satisfaction on Student Loyalty to Higher Education Institution. European Scientific Journal. Special Edition Vol. 1 : 449-463.
International Journal of Applied Business and Economic Research 162 Lusiah, Paham Ginting, Arlina Nurbaity Lubis and Endang Sulistya Rini
Sampaio, Claudio Hoffmann, Marcelo Gattermann Perin, Cla´udia Simo˜es and Hamilton Kleinowski. (2012), Students’ trust, value and loyalty: evidence from higher education in Brazil. Journal of Marketing For Higher Education. Vol. 22(1): 83-100.
Sholihin, Mahfud dan Ratmono, Dwi. (2013), Analisis SEM-PLS dengan Warp-PLS 3.0 Untuk Hubungan Nonlinear dalam Penelitian Sosial dan Bisnis. Penerbit Andi. Yogyakarta.
Taecharungroj, Viriya. (2014), University Student Loyalty Model: Structural Equation Modelling of Student Loyalty in Autonomous, State, Transformed, and Private Unversities in Bangkok. Scholar. Vol. 6 No.1 : 66-77.
Tu, Yu Te, Mei Lien Li and Heng-Chi Chih. (2013), An Emperical tudy of Corporate Brands Image, Customer Perceived Value and Satisfaction on Loyalty in Shoe Industry. Journal of Economics and Behavioral Student. Vol. 5 No. 7 pp: 469-483.
Usman, Umar, Sany Sanuri Mohammad Mokhtar. (2016), Analysis of Service Quality, University Image and Student Satisfaction on Student Loyalty in Higher Education In Nigeria. International Business Management 10(12): 2490-2502. Wong, Antony, Arison Woo and Canon Tong. (2016), Student Satisfaction and School Reputation: The Moderating Role