FORMULIR ISIAN PASIEN
No MR :
Kelompok :
Kasus/Kontrol
Identitas Umum
Nama
:
Berat Badan :
kg
Usia
:
tahun
Tinggi badan :
cm
Pendidikan :
IMT
:
Pekerjaan
:
Keluhan
:
Asesmen pra operasi
Paritas
: G P A
Usia Menars :
tahun
Riw. Haid
: teratur / tidak teratur
siklus :
hari
Riw KB
: (+) / (-)
Jenis KB
:
Pemakaian terakhir :
Diagnosa
:
No. PA / tanggal
:
Asesmen paska operasi
Hasil PA Akhir
:
Jenis mioma uteri
: subserosa/intramural/submukosa
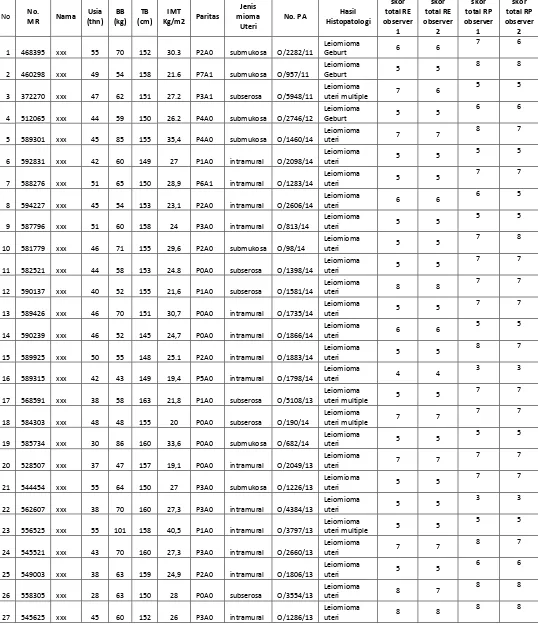
28 541631 xxx 53 60 163 22,6 P3A0 submukosa O/971/13
Leiomioma
uteri 7 7
7 7
29 538301 xxx 50 52 157 21,1 P6A1 subserosa O/72/13
Leiomioma
uteri 5 5
8 8
30 561020 xxx 43 65 154 27.4 P0A0 intramural O/3842/13
Leiomioma
uteri 7 7
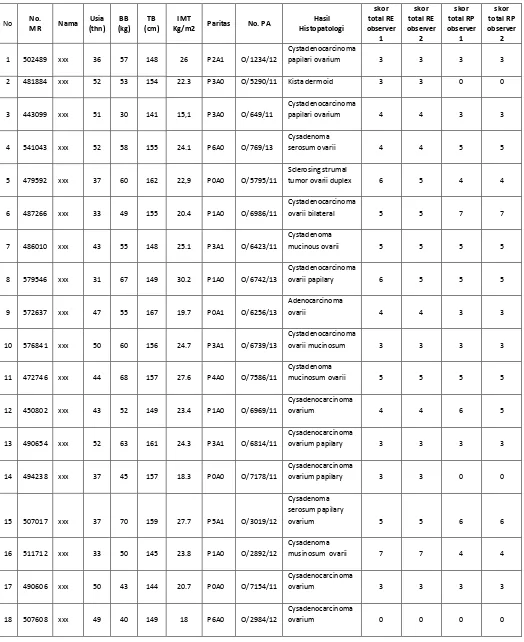
TABEL INDUK KELOMPOK KONTROL
Sclerosing strumal
tumor ovarii duplex 6 5 4 4 serosum papilary
19 482703 xxx 46 64 152 27.7 P5A0 O/5161/11
Cysadenocarcinoma
ovarium papilary 5 5 5 4
20 475890 xxx 53 55 155 22.9 P3A0 O/752/12 Fibroma ovarii 4 4 6 6
21 505694 xxx 42 50 158 20 P0A0 O/1288/12
Cystadenocarcinoma
ovarii 6 6 7 7
22 480616 xxx 53 45 150 20 P7A0 O/5844/11
Cystadenoma
musinosum ovarii 3 3 3 3
23 482391 xxx 38 47 158 18.8 P2A0 O/6043/11
Cystadenoma
mucinosum 6 6 7 6
24 476720 xxx 41 68 150 30.2 P0A1 O/4065/11
Cystadenocarcinoma
ovarii papilary 5 5 6 6
25 502325 xxx 52 50 154 21.1 P4A1 O/526/12
Cystadenicarcinoma
ovarii 3 3 6 6
26 476981 xxx 41 57 150 25.3 P3A0 O/4547/11
Cystadenoma
musinosum ovarii 4 4 5 5
27 493061 xxx 48 50 153 19.2 P4A0 O/7172/11
Cystadenoma
serosum ovarii 3 3 5 5
28 543695 xxx 56 55 150 24.4 P7A1 O/858/13
Adenocarcinoma
ovarii papilary 3 3 5 5
29 564597 xxx 53 55 145 26.2 P7A3 O/5213/13
Cystadenocarcinoma
ovarii mucinosum 3 3 5 5
30 536783 xxx 55 48 150 21.3 P6A0 O/744/13
Adenocarcinoma
GAMBARAN EKSPRESI IMUNOHISTOKIMIA RESEPTOR ESTROGEN DAN PROGESTERON
Ekspresi negatif reseptor estrogen
Ekspresi lemah reseptor estrogen
Ekspresi sedang reseptor estrogen
Ekspresi kuat reseptor estrogen
Ekspresi negatif reseptor progesteron
Ekspresi lemah reseptor progesteron
ANALISA STATISTIK
usiakel * kelompok penelitian Crosstabulation
kelompok penelitian
Total
Kasus
kontrol
Kasus
usiakel
1.00
Count
6
8
14
% within kelompok
penelitian
20.0%
26.7%
23.3%
2.00
Count
24
22
46
% within kelompok
penelitian
80.0%
73.3%
76.7%
Total
Count
30
30
60
% within kelompok
penelitian
100.0%
100.0%
100.0%
1 : =< 40 tahun
2 : > 40 tahun
IMTkel * kelompok penelitian Crosstabulation
kelompok penelitian
Total
Kasus
kontrol
Kasus
IMTkel 1.00
Count
0
3
3
% within kelompok
penelitian
.0%
10.0%
5.0%
2.00
Count
13
18
31
% within kelompok
penelitian
43.3%
60.0%
51.7%
3.00
Count
12
7
19
% within kelompok
penelitian
40.0%
23.3%
31.7%
4.00
Count
5
2
7
% within kelompok
penelitian
16.7%
6.7%
11.7%
Total
Count
30
30
60
% within kelompok
penelitian
100.0%
100.0%
100.0%
1 :
Underweight
(< 18.5)
2 :
Normoweight
(18.5-24.9)
3 :
Overweight
(25-29.9)
paritaskel * kelompok penelitian Crosstabulation
kelompok penelitian
Total
Kasus
kontrol
Kasus
paritaskel 1.00
Count
8
6
14
% within kelompok
penelitian
26.7%
20.0%
23.3%
2.00
Count
4
4
8
% within kelompok
penelitian
13.3%
13.3%
13.3%
3.00
Count
12
9
21
% within kelompok
penelitian
40.0%
30.0%
35.0%
4.00
Count
6
11
17
% within kelompok
penelitian
20.0%
36.7%
28.3%
Total
Count
30
30
60
% within kelompok
penelitian
100.0%
100.0%
100.0%
1 :
nullipara
2 : primipara (
1)
3 :
Multipara (2-3)
4 :
Grandemultipara (>= 4)
Group Statistics
kelompok
Independent Samples Test
Levene's Test for
Equality of
Variances
t-test for Equality of Means
F
Sig.
t
df
95% Confidence
Interval of the
Group Statistics
Independent Samples Test
Group Statistics
Independent Samples Test
Levene's Test
for Equality of
Variances
t-test for Equality of Means
F
Sig.
T
df
95% Confidence
Interval of the
Difference
Levene's Test
for Equality of
Variances
t-test for Equality of Means
F
Sig.
T
df
95% Confidence
Interval of the
Nilai kappa RE Symmetric Measures
a Not assuming the null hypothesis.
b Using the asymptotic standard error assuming the null hypothesis.
Nilai kappa RP Symmetric Measures
Value
a Not assuming the null hypothesis.
b Using the asymptotic standard error assuming the null hypothesis.
Group Statistics
kelompok penelitian N Mean
Independent Samples Test
Levene's Test for Equality of
Variances t-test for Equality of Means
F Sig. T df
95% Confidence Interval of the
Difference
Lower Upper Lower Upper Lower Upper Lower Upper Lower Skor Ekspresi
RE
variances not assumed
5.295 52.654 .000 1.900 .359 1.180 2.620
Skor Eskpresi RP
variances not assumed
ANOVA
Sum of Squares df
Mean
Square F Sig. Skor Ekspresi
RE
Between
Groups 3.244 2 1.622 1.254 .301
Within Groups 34.923 27 1.293
Total 38.167 29
Skor Eskpresi RP
Between
Groups 5.692 2 2.846 1.428 .257
Within Groups 53.808 27 1.993