PATIENT SATISFACTION ANALYSIS IN HASAN SADIKIN
HOSPITAL AT PEDIATRIC DEPARTMENT BY COMPARING IPA
AND THREE FACTOR ANALYSIS
Fitroh1, Ruswana Anwar2, Mursyid H Basri1, Indra Dewanata1 1School of Business and Management, Bandung Institute of Technology, Indonesia
2RSUP Dr. Hasan Sadikit Hospital Bandung, Indonesia
E-mail: [email protected]
Abstract
Patient satisfaction is one of several factor of successful business in a hospital. This research chooses the service industry on health care institution in hasan sadikin hospital at Bandung, Indonesia. Hasan sadikin hospital wants to improve their service to get more satisfaction from the patient as the one of several aspect to get the International Accreditation from Joint Commission International (JCI) that responsible for determining and assessing the performance standards of health care providers. Researcher will be focused on service given by resident in pediatric department to the patient in class three. This research used several theoretical , first Revised Importance•Performance Analysis (IPA), As theoretical has shown, revised IPA using regression analysis and dummy variable asses attribute-level performance and overall satisfaction has asymmetric relationship. Second is Kano Model that stated suggest research in customer satisfaction of quality categorized into three; basic factor, performance factor, and excitement factor. With IPA and Kano Model, performance and importance attribute of basic and excitement factor is nonlinear and asymmetric. Then attribute importance can be interpreted as the function of performance. The result of this research are= Casic factor that must be present are= •Sesponse Tpeed• •Sesponse Bttitude• •Iospitality• •Nedical Jnfo• •Oeatness• and •Oeeds Vnderstanding• Uhe attribute that categorized as excitement factor are= Pn schedule-asking opportunity, diagnosis accuracy, accessibility, and two way communication.
Keyword: Importance•Performance Analysis, Service Quality, Satisfaction, Hospital
INTRODUCTION
The rapid technological developments make health care is not only made by the government or private, but educational institutions engaged in the health sector can also have health care institution that can be enjoyed by the local community. One of which is Hasan Sadikin Hospital, Bandung, Indonesia. Researcher will choose only one department which is pediatric department.
An effective method to set priorities of satisfaction is by knowing the performance level of Hospital (performance level of resident ) and the importance of the patient, this method is called as Importance-Performance Analysis (IPA). By knowing this two dimension then combined into matrix allow the hospital to identify the key drivers of satisfaction, to formulate improvement priorities and find an area of disadvantages (Matzler K. B., 2004). Knowing the priorities will be very helpful in deciding how to allocate the scarce resources in order to maximize the patient satisfaction and efficient in cost.
With IPA model and Kano model we will find three categories of satisfaction ; basic factor, performance factor and excitement factor (Anderson, 1994; Mittal, 1998)/ Jn Lanos model of customer satisfaction, performance and importance are nonlinear and asymmetric, then the importance attribute can be interpreted as the function of performance. Basic factor is critical when performance is low, but satisfaction will decrease when performance is high, patient will dissatisfy when basic factor not present, and the patient will not be excited when basic factor are present (Kano, 1984). Then excitement factor plays as the opposite of Basic Factor. it will play an important factor when performance is high and unimportant when performance is low, patient will be very satisfied when excitement factor is present and will not dissatisfy when excitement factor not present (Kano, 1984). We can improve both basic factor and excitement factor to improve the service quality of hasan sadikin hospital then get the patient satisfaction.
THEORITICAL FRAMEWORK
ImportancehPerformance Analysis
Importance•Performance Analysis was first introduced by Martilla and James in 1977 to measure customer satisfaction of product or services. Data from satisfaction survey recognized into two component ; first the importance service or product to a customer and second the performance of service or product (Martilla, 1977). Performance is measured as the patient rate each attribute on its performance of the service, the attribute is measured as the self-stated importance of item as the same form of a performance by the patient. The mean of the result in performance and importance divided into the matrix into four quadrants. The vertical axis is the mean of importance and the horizontal axis is mean of performance. There are two assumptions regarding the traditional Importance • Performance Analysis ; First is attributed performance and importance are independent and the second is attributed performance has a linear and symmetric impact on overall performance (Matzler K. B., 2004).
The four quadrants in importance-performance analysis are characterized as (Martilla, 1977):
1. Quadrant I, Keep up with the good work - high importance, high performance: it is competitive advantage and major strength for the hospital. Should maintaining this attribute
3.
3. Quadrant III . Low priority - low importance low performance: hospital should not made any improvement on this quadrant
4.
4. Quadran IV Possible overkill - low importance, high performance: indicate that business resources committed to these attributes would be overkill and should be deployed elsewhere•/
Figure 1: Matric Importance Performance Analysis
Kano Model
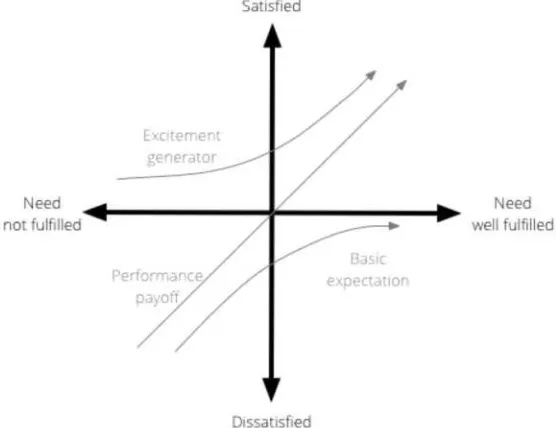
Kano model is one theory of customer satisfaction model by Professor Narioki Kano to classify service/product based on customer perceived and the effect on customer satisfaction. This model/theory is useful to identify whether the service/product is good enough or better.
Kano Model of customer satisfaction divided into three categories, (Kano, 1984) ; Basic Factor, performance and Excitement factor (figure 2). Basic factor is critical when performance is low, but satisfaction will decrease when performance is high, the patient will dissatisfy when basic factor not present, and the patient will not be excited when the basic factor is present. Then excitement factor plays as the opposite of Basic Factor. it will play an important factor when performance is high and unimportant when performance is low, the patient will be very satisfied when excitement factor is present and will not dissatisfy when excitement factor not present. Performance attribute is those which if these attribute fulfilled then the customer will be satisfied and if these attributes does not fulfil then the customer will be dissatisfied.
METHODOLOGY
This research, patient satisfaction was measured to know are the Basic Factor and Excitement factor that needed to get the highest satisfaction of patient in Class three of pediatric department. A standardized questionnaire was used to measure attribute performance and importance of service given by the resident. This questionnaire used liked scale 1 (extremely dissatisfied ) • 5 (extremely satisfied) for performance attribute and 1 (extremely importance ) • 5 (extremely unimportance). Researcher also uses in-depth interview with the respondent to get closer with them and make sure that the data is valid.
DISCUSSION
Here is the Analysis of knowing what are the Three Factors of patient on Pediatric Department in Hasan Sadikin Hospital that needed to get highest satisfaction. With this tools, Hasan Sadikin Hospital can control the use of resource based on the level of importance of their service. Below is step by step result of knowing the basic and excitement factor of Padiatric Department in class III of Hasan Sadikin Hospital;
As the result of questionnaire, the data will be coded as 0 and 1. Only the result of performance attribute questionnaire will be coded. The result will coded as Low and High
group/ Gor low group- Sesult of questionnaire that coded as 1 are all result of patients
answer with answer 4 and 5 of each question on questionnaire. Result of questionnaire that coded as 1 are all attribute that answered as 1 and 2. For group of High the coding process will be vice versa with Low group. The answer of quesionnaire that 1 and 2 will be coded as 0 and 4 and 5 will be coded as 1.
Tabel 1. Anova of High Group
Model Sum of Squares df Mean Square F Sig.
1
Regression 1194,693 12 99,558 29,957 ,000b
Residual 96,378 29 3,323
Total 1291,071 41
a. Dependent Variable: OverAllPerf
b. Predictors: (Constant), High12, High7, High6, High4, High2, High5, High1, High10, High8, HIgh9, High3, High11
1 (Constant) 21,649 2,294 9,436 ,000
High1 3,466 1,273 ,245 2,723 ,011**
High2 4,147 1,093 ,279 3,796 ,001*
High3 1,239 1,237 ,083 1,002 ,325(ns)
High4 3,032 ,825 ,240 3,673 ,001*
High5 2,198 1,064 ,128 2,065 ,048*
High6 3,180 ,895 ,225 3,551 ,001*
High7 -2,750 1,530 -,146 -1,798 ,083***
High8 4,036 ,780 ,343 5,174 ,000*
HIgh9 3,605 1,200 ,228 3,005 ,005*
High10 2,271 ,819 ,185 2,774 ,010*
High11 2,660 1,695 ,168 1,569 ,128(ns)
High12 7,244 2,286 ,278 3,169 ,004*
a. Dependent Variable: OverAllPerf b. * : Sig <= 0,01 * :
** : Sig <= 0,05 *** : Sig <= 0,1
(Ns) : Sig Not Significant
Two table above are the result of regression process with SPSS. The first table with the name •BOPWB• to see Tignificant- the mean of Tig/ Uhis analysis is to see how the relationship between independent and dependent variable. It will be linear relationship or there is a relationship between dependent variable and independent variable If the result of sig is lower than 0,05 and it is means constant or no relationship between dependent variable and independent variable. The result of this analysis for High group is 0,000 it is means that there is a relationship between dependent variable and independent variable.
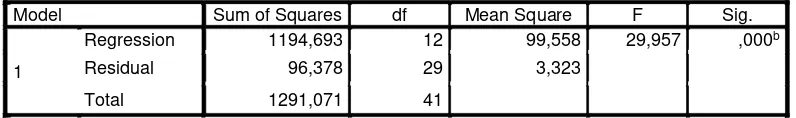
Tabel 3. Anova of Low Group
ANOVAa
Model Sum of Squares df Mean Square F Sig.
1
Regression 957,088 12 79,757 6,925 ,000b
Residual 333,984 29 11,517
Total 1291,071 41
a. Dependent Variable: OverAllPerf
b. Predictors: (Constant), Low12, Low10, Low5, Low4, Low7, Low2, Low1, Low8, Low11, Low3, Low9, Low6
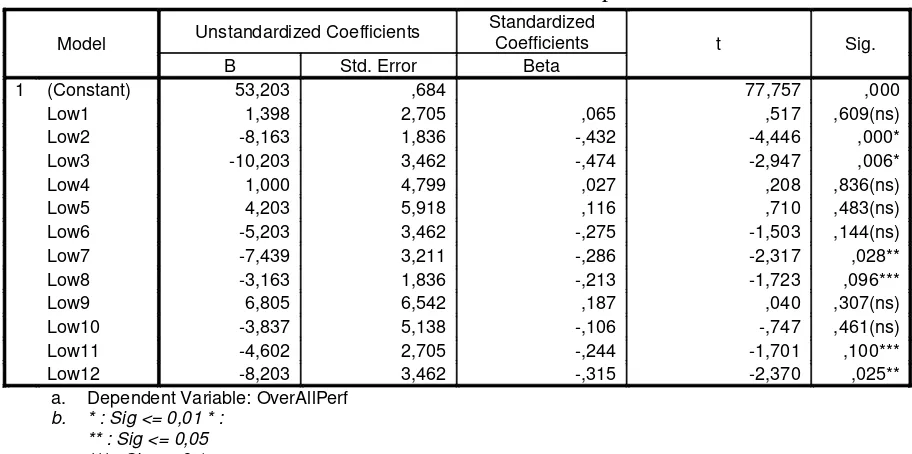
Tabel 4. Corefficient of Low Group
Model Unstandardized Coefficients
Standardized
Coefficients t Sig.
B Std. Error Beta
1 (Constant) 53,203 ,684 77,757 ,000
Low1 1,398 2,705 ,065 ,517 ,609(ns)
Low2 -8,163 1,836 -,432 -4,446 ,000*
Low3 -10,203 3,462 -,474 -2,947 ,006*
Low4 1,000 4,799 ,027 ,208 ,836(ns)
Low5 4,203 5,918 ,116 ,710 ,483(ns)
Low6 -5,203 3,462 -,275 -1,503 ,144(ns)
Low7 -7,439 3,211 -,286 -2,317 ,028**
Low8 -3,163 1,836 -,213 -1,723 ,096***
Low9 6,805 6,542 ,187 ,040 ,307(ns)
Low10 -3,837 5,138 -,106 -,747 ,461(ns)
Low11 -4,602 2,705 -,244 -1,701 ,100***
Low12 -8,203 3,462 -,315 -2,370 ,025**
a. Dependent Variable: OverAllPerf b. * : Sig <= 0,01 * :
** : Sig <= 0,05 *** : Sig <= 0,1
(Ns) : Sig Not Significant
Above the result of regression process of Low group based on performance attribute. Cased on table •BOPWB• the result of overall significant of Mow group of performanceis 0,000 it is lower than 0,05. Then we can conclude that there is a relationship between dependent variable and independent variable. The next step is to see the siginificant of each attribute, there six attribute that not significant with the name of attribute are On Schedule, Asking opportunity, Diagnosis accuracy, Medical Info, Two way communication and Neatness. The other attribute is still on a significant with maximum significant number is 0,1.
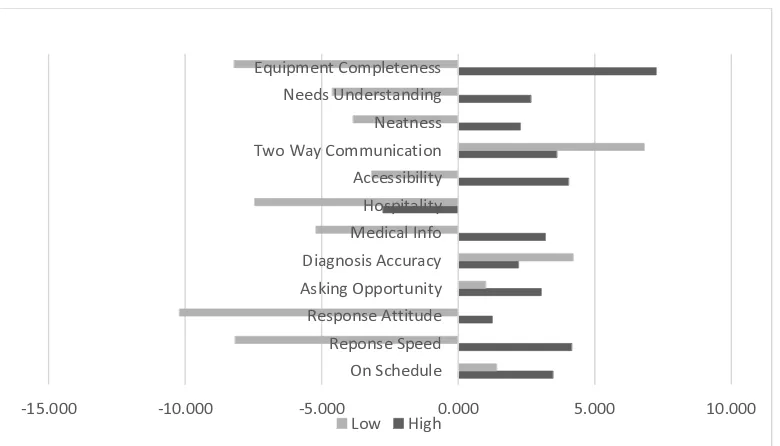
Figure 3: The asymmetric impact of attribute-level performance on overall satisfaction.
The figure above represent the asymmetric impact of attribute-level performance on overall satisfaction and based on this figure we can see the basic factor and excitement dactor of pediatric department, to know the basic factor, it seen from the taller axis of Low attribute. Jn gaining this figure- researcher used •C• value on Dorrelation table of Mow group and Iigh group as the value for determining the Casic and excitement factor/ this •C• value is the dummy variable
From the figure above, the basic factor of Resident Doctor on Hasan Sadikin Hospital are; Response speed,Response atitude, medical info, hospitality, neatness, needs understanding and equipment completeness. The attribute that categorized as excitement factor are; On scedule, asking opportunity, diagnosis accuracy, accesability, and two way communication. The result of this analysis is Hasan Sadikin Hospital should fulfill the basic factor to made patient in class III of pediatric department not dissatisfied with the service that given by resident doctor. To get more satisfaction from patient, hasan sadikin hospital can improve the excitement factor that mentioned before. As mentioned before that basic factor is a factor that •must be• present to get patient satisfaction, when this attribute not fulfilled patient will dissatisfied. Excitement factor is an attribute that when it is not fulfiiled patient will not fee
With importance-performance analysis tools, the researcher would make a matrix of importance-performance analysis. The result of this IPA can be used as how to treat each patient in pediatric department. But the result of this IPA is only used for a patient that have data record at Hasan Sadikin Hospital or at least have ever come to this department.
As the first step is recording the result of a questionnaire to Microsoft excel. The result of the questionnaire is a likert scale from 1-6/ Uhe result of each respondents average of all question on both performance (1(very dissatisfied)•5 (Very satisfied)) and importance
(1(very not importance)•5 (Very importance)) is grouped as satisfied patient if the result is > 3,5 and grouped as dissatisfied patient if the average of all question is less than or same with 3,5. Then look for average of each attribute performance and importance for satisfied patient and dissatisfied patient.
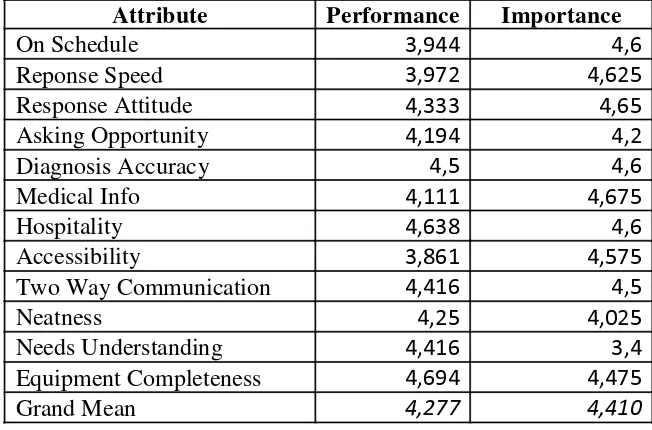
Table 6. Average of Attribute Performance and Importance of Satisfied Patient
Attribute Performance Importance
The table 6 is a table of each average of attribute performance and importance based
on the result of each respondents answer with the average of all question @ 4-6/ Grom thats
data researcher will make the matrix of the Satisfied patient. Performance as y-axis and Importance as the x-axis. The matrix will explain which attribute need to be concern for Hasan Sadikin Hospital to give higher satisfaction from patient who have been feeling satisfied with resident doctor.
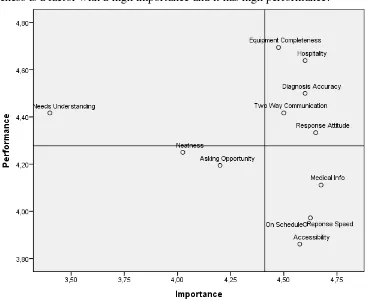
Based on Figure above (Figure VI) in Matrix IPA of Satisfied Patient, it looks that to get the higher satisfaction from patient on class II and class III are by improving the quality service of resident especially on Medical Info, On Schedule, Response Speed, and Accessibility,as the figure above, these attribute are on quadrant III (Concentrate Here). This attribute should be a concern for Hasan Sadikin Hospital in treating the patient in Pediatrics department. This factor is a factor of the major weakness of service by a resident in pediatric department, but this attribute is the most importance factor to get patient satisfaction. Then, when treating the satisfied patient, the resident doctor should concern on this factor. As the note, Hasan Sadikin Hospital can identify the satisfied patient and dissatisfied patient after
the patients second visit to this department/
Response attitude, two-way communication, diagnosis accuracy, hospitality, and equipment completeness is a factor with a high importance and it has high performance.
Figure 4. Matrix IPA of Satisfied Patient
There are two attributes that included as lowest priority or this attribute is in quadrant III that is neatness and asking opportunity. This attribute has lowest importance and resident also perform on lower service/ Jmproving this attribute will meaningless for patients marking on resident performance. Then Hasan Sadikin Hospital can reduce the use of the resource in this attribute.
Attribute that not importance and possible overkill for the satisfied patient are Needs Understanding, these attributes are in quadrant IV (Possible overkill). This attribute has high performance by resident, resident performs too good and according to the patient, it is not importance. Lossing the attribute on this quadrant will be fine for patient and it will be better to lose it, because with losing this attribute, resident can focus on attribute that has high importance and resident still have low performance (quadrant II)
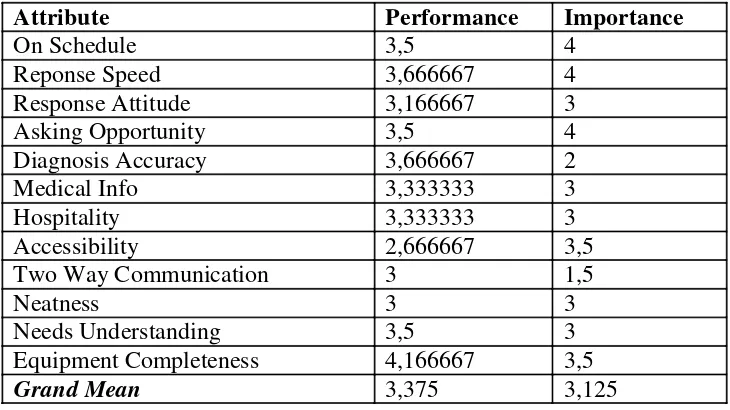
Table 7 is mean and grand mean of each attribute performance and importance based on a patient answer on questionnaire with an average of all question is Less than or same with 3. The next step after getting these table is created the matrix of importance • performance analysis. The result of performance mean as y•axis and importance mean as an x • axis. The grand means as the gap of the matrix. Below the result of matrix of Importance•Performance Analysis of Dissatisfied Patient.
Table 7. Average of Attribute Performance and Importance - Dissatisfied Patient
Attribute Performance Importance
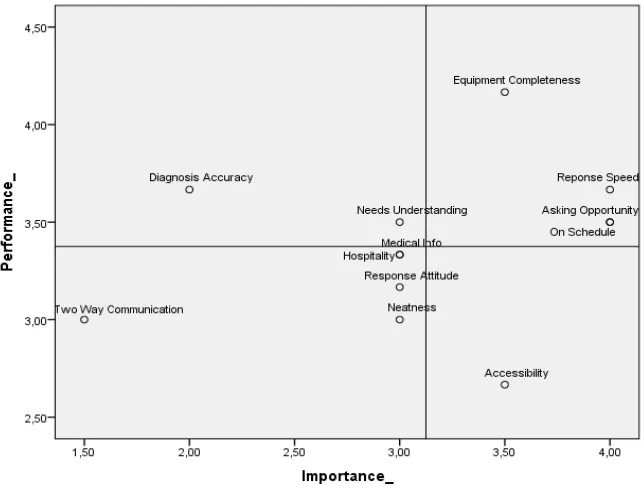
The figure 5 mentioned the result of conducting matrix of importance•performance analysis for a Dissatisfied patient on class II and class III of Pediatric Department. Hasan Sadikin Hospital should concern on an attribute that located in Quadrant II (Concentrate Here) with the attribute are ; Accessibility. The attribute that needed to improve for the dissatisfied patient is accessibility, according to this result, Hasan Sadikin Hospital should concern to this attribute because this factor is the major weakness of resident in treating the patient.
The attribute that should be Keep Up the Good Work or attribute that mentioned on Quadrant I are; Equipment Completeness, Response Spees, Asking Opportunity and On Schedule. Based on this result, resident and Hasan Sadikin Hospital should maintain this attribute because this quadrant is the major strength in servicing the dissatisfied patient when this attribute is not maintained it will have the opportunity to become the factor on quadrant II and the last they will be very dissatisfied.
The Last attribute that mentioned on Quadrant III or Lower priority is Hospitality, Response Attitude, Neatness, Medical Info, and Two-Way Communication. Resident do not do good in this lowest attribute, and patient also feel it is not importance for them, then it should be not the concern for resident and have the lowest priority. They can throw this attribute from their concern. Focusing on this attribute will be meaningless when they improve it will become the factor on quadrant IV (possible overkill).
Figure 5. Matrix of Importance - Performance of Dissatisfied Patient
Hasan Sadikin Should be a concern to an attribute on Quadrant II and reduce the resource on Quadrant III and IV. Improving the factor on quadrant II and maintaining the factor on quadrant I will be meaningful and they can focus on their improvement. Not to concern on quadrant III and IV can be alternative to focus on a factor located in quadrant I and II. As the note, this analysis can be used only for the patient that at least have ever come and recorded in this department. It is only used for the patient that ever serviced to categorize which in a satisfied patient or dissatisfied patient.
As the result of the analysis of patient satisfaction in Pediatric Department, here the comparison of each the result. Below is table of comparison between IPA and Three-factor analysis.
CONCLUTION AND RECOMMENDATION
present to get minimum satisfaction from customer and which factor should management improve to get highest satisfaction from patient.. To get more siatifaction from patient in pediatric department hasan sadikin hospital can improve the factor in excitement factor with the note that basic factor have been fulfilled. Filling the excitement factor without filling the basic factor will be meaningless for the patient.
Patient that ever treated in a service industry are grouped into two, some of them feel that they have satisfied and some of them did not. Servicing in two way will be impacted, Importance • Performance Analysis dividing patient into two, satisfied patient and dissatisfied patient, as mentioned in analysis chapter the factor that needed to improve for patient who have been satisfied and dissatisfied are strongly different. To get the point of how to serve them, managerial can do record process in their first meet in this department
and deciding in which group thats patient are categorized/ Jn their second visiting-
managerial will know how to treat the patient based on the result of the record process and IPA for satisfied patiend and IPA for dissatisfied patient.
REFERENCES
Anderson, E. W. (1994). Customer satisfaction, market share and profitability: Findings from Sweden.Journal of Marketing, 58(2), 112•122.
Chen, K.-S. &.-T. (2014). Applying importance performance analysis with simple regression model and priority indices to assess hotels' service performance.Journal of Testing and Evaluation, 42(2), 1e12.
Deng, J. W. (2007). Using a Revised importance-performance analysis approach; The case of taiwans hot spring tourism.Tourism management.
Deng, W. (2007). Using a revised importance-performance analysis approach. Tourism
Management, 28(5), 1274e1284.
Johnston, R. (1995). The determinants of service quality: Satisfiers and dissatisfiers.
International Journal of Service Industry Management, 6(5), 53•71.
Kano, N. (1984). Attractive quality and must be quality. Hinshitsu (Quality), 14(2), 147• 156 (in Japanese).
Martilla, J. A. (1977). Importance•performance analyses.Journal of Marketing, 41(1), 77• 79.
Matzler, K. B. (2004). The asymmetric relationship between attribute-level performance and overall customer satisfaction: a reconsideration of the importance-performance analysis.Industrial Marketing Management,33(4), 271e277.
Matzler, K. S. (n.d.). Importance•performance analysis revisited: The role of the factor structure of customer satisfaction.The Service Industries Journal, 23(2), 112•129.
Pezeshki, V. M. (2009). Importance-performance analysis of service attributes and its impact on decision making in the mobile telecommunication industry. Measuring Business Excellence, 13(1), 82e92.