ISSN: 1693-6930, e-ISSN: 2087-278X 115 accredited by Directorate General of Higher Education of Indonesia, SK No: 51/Dikti/Kep/2010
http://telkomnika.ee.uad.ac.id
KOHONEN NEURAL NETWORK CLUSTERING FOR
VOLTAGE CONTROL IN POWER SYSTEMS
Muhammad Nizam
Universitas Sebelas Maret Surakarta
Jl. Ir. Sutami 36A, Surakarta, Telp/Fax: +62 271 62163 e-mail: [email protected]
Abstract
Clustering a power system is very useful for the purpose of voltage stability control. However, the methods have developed usually have computational inefficiency. This paper presents a new cluster bus technique using Kohonen neural network for the purpose of forming bus clusters in power systems from the voltage stability viewpoint. This cluster formation will simplify voltage control in power system. With this proposed Kohonen algorithm, a large bus system will be partitioned into a small bus groups that have a coherence V, θ, P and Q. The
maximum number of area clusters will be formed need for voltage stability needed. The proposed technique was tested on IEEE 39 bus system by considering two contingency namely load increased and line outage by using voltage collapse analysis. This formation will be compared with the Learning Vector Quantization (LVQ) algorithm. The results showed the proposed technique produces four clusters on contingency load load increased and three clusters online outage contingency on IEEE 39 bus system as shown by the LVQ.
Keywords: clustering, Kohonen, learning vector quantization, voltage stability
1. INTRODUCTION
Voltage stability is concerned with the ability of the power systems to maintain acceptable voltages at all system buses under normal conditions as well as after being subjected to a disturbance. For the system to remain secure in real time situation, it is essential to monitor the system status with respect to load changes and contingencies and take preventive action every time a contingency drives the system towards insecure state [1]. Voltage instability phenomenon has been known to be caused by heavy loads where large amounts of real and reactive powers are transported over long transmission lines. It may occur at the operating loading condition when a system is subjected to a contingency. The probability for a system to experience a voltage collapse resulting from the voltage instability condition is higher for weak areas or non-secure buses [2], [3]. Voltage instability incidence and hence power blackout can be avoided if identification of weak areas in a power network and voltage control are taken into account [2]-[4]. The need for fast control action so as to improve voltage stability calls for the formation of bus clusters or groups of buses in a power network. This is important because the information can be used for voltage control scheme in order to maintain power delivery to utility. The coherent bus clusters are formed in which the buses in a cluster are said to be coherent when the voltage and angle changes for these buses are the same for a particular contingency. Each cluster can therefore represent a group of coherent PV or PQ buses so as to form one sub-network of a large network [5]-[7]. By forming several sub-networks representing the entire power system, the size of the system can be reduced and therefore the computational efficiency of application program such as voltage control can be considerably improved. In this paper, the method for forming bus clusters is presented using a new clustering technique based on Kohonen neural network.
this work, the weak areas are clustered by encircling the load and generator buses that are connected close to the critical bus. In [7], bus clusters are formed by utilizing the line stability factors for voltage stability analysis. A power network can be clustered into smaller networks containing buses that are closely connected [3], [8]. A group of load buses that have similar voltage and angle change are considered as electrically belonging to the same cluster. On the other hand, for load buses with voltages and angles not affected by load variations are considered as electrically distanced or weakly connected and therefore belong to different clusters [3], [8].
This paper presents the development of a new clustering technique using the Kohonen neural network for determining the bus clusters in power systems. The objective of the work is to form bus clusters in a power system based on the coherency of the buses. In the proposed technique, a disturbance is first created at a particular bus such as load increase or line outage. The coherent bus clusters are formed by considering values of voltage difference, angle difference, real and reactive power differences which are similar for buses within a cluster. In other words, the coherent buses that are grouped into a cluster are said to have similar voltage and angle changes as well as real and reactive power changes. Unsupervised learning method based on Kohonen neural network is also used to form the bus clusters by giving a good representation on the characteristic groups from the input data space [3]-[5], [9]. The proposed clustering technique was implemented on the IEEE 39-bus test system.
2. PROPOSED METHOD
The bus clusters are formed based on the coherent nature of buses in a smaller cluster by using the sensitivity information such as voltage magnitude and angle as well as real and reactive power differences. A bus that tolerates a higher increase in load is considered less sensitive as compared to a bus which tolerates a lower increase in load from its base load [10]. In order to create the cluster buses the Kohonen neural network will be proposed. The proposed method is described as follow.
2.1. Kohonen Neural Network
Kohenen network is an unsupervised neural network in which its input data with similar features are mapped to form clusters by competitive learning algorithm. The algorithm considers the Euclidean distance between two n-dimensional vectors which is measured by the similarity between input vectors. The distance of an input vector from each neuron i, Di is given by,
(
)
21
n
i ij j ij
j
D
W
X
x
w
=
=
−
=
∑
−
(1)where X = (x1, x2, … xn) T
denotes an input vector
wij = (w11, w12, … wim)T denotes the weight vector of the i-th neuron
The Kohonen with a minimum distance is called as the winner. In other words, the winner’s weight vector is closest to the input vector.
{ }
D
i
{
m
}
D
w=
min
i∈
1
,
2
,...,
(2)respond, namely the unit characterized by the maximum output, respectively minimum distance, for this input vector x. During the training, the winner adjusts its weights to be closer to the values of data and the neighbours of the winner also adjust their weights to be closer to the same input data vector according to the following relation [12],
(
W
X
)
i
{
m
}
W
W
i=
ij+
α
i−
=
1
,
2
,...,
(3)The units of the network are thus competing for selection. Only the weights of the winner will be adapted. The adjustment of the neighbouring neuron is instrumental in preserving the order of the input data. Thus, the winning neuron is the closest to the input value. After training, the weight vectors are self organizing and represent prototypes of classes of input vector [13]. The complete algorithm is described as follows:
(i) t :=1; initialize wij randomly for i= 1,…,m ; j = 1,.., n,
Initialize weight of bias
b
i=
e
1 ln 1 k− ( ),where bi is bias weight neuron-i and K is amount of class. Set learning rate and maximum epoch.
(ii) Choose input vector x∈ X randomly in the training set.
(iii) Determine the neuron i such that its weight vector w is closest to the input vector.
{ }
D
i
{
m
}
D
w=
min
i∈
1
,
2
,...,
for all i(iv) Update the weight vector wi, i=1, …, m;
(
W
X
)
i
{
m
}
W
W
i=
ij+
α
i−
=
1
,
2
,...,
(v) Update bias weight :
( ) (
)
(
1 ln( )( ))
( )
1
b ic i
= −
α
e
−+
α
y i
for the winner neuron( )
(
1 ln c i( )( ))
b i
=
e
− for else (vi) Increment the time t:=t+1(vii) Go to step (ii) until maximum epoch is reached.
2.2. Learning Vector Quantization
A supervised version of the Kohonen algorithm known as the learning vector quantization (LVQ) is also introduced by Kohonen [14]. In this algorithm, it is assumed that for each training vector x, the class is known. Using this knowledge, the weight vectors can be moved, that is, the class prototypes move towards a correctly classified training vector and away from a wrongly classified one. The LVQ algorithm is described as follows:
(i) t :=1; initialize weight input variable-j to cluster-i wij
randomly for i= 1,…,m ; j = 1, … , n,
Set maximum epoch, Learning rate (α), Decrease learning rate (decα) and minimum learning rate (minα)
(ii) Input vector x∈ X randomly in the training set, and target class. (iii) Initialize condition epoch=0
(iv) If (Epoch < MaxEpoch) and (α > Minα) a. epoch=epoch +1
b. for i = 1 to n
(
)
(
)
j i j
j i
W W X for x correctly classified W
W W X for x incorrectly classified α
α
+ −
=
− −
(4)
(3) Decrease α with α = α*decα
Since only the nearest weight vector is changed, this step can be interpreted as an additional supervised fine-tuning of the feature map once the neighborhood order is decreased to zero. This fine-tuning is useful if the decision surfaces of the classification are known and the classes covering its boundary classify inputs inside as well as outside of the boundary. In this case, it may be advisable to fine tune the position of the weight vectors with an LVQ algorithm such that safe and unsafe operating points are classified by different neurons.
3. RESEARCH METHOD
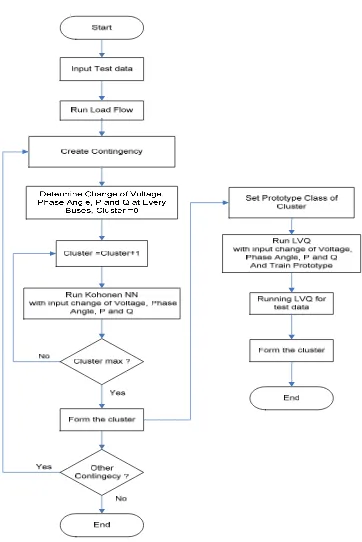
In the proposed clustering technique, the first step is to determine the coherent bus clusters. A contingency is considered such as load increase at all bus and outage of a line. To determine the coherency of buses, the sensitivity information such as voltage difference, angle difference, real and reactive load power differences are calculated. Using such sensitivity information as inputs to the Kohonen neural network, the coherent buses are grouped together to form several bus clusters. The buses in a cluster are coherent if the voltage, angle, real power and reactive power differences for each bus within a cluster are the same when subjected to a disturbance [7]. The results of bus clusters formed by using the Kohonen neural network are compared with the LVQ algorithm. Figure 1 shows the flowchart of the procedure for formation of bus clusters technique by using Kohonen NN.
As an input data a set of data namely Voltage (V), phase angle (θ), Real Power (P) and Reactive Power (Q) at each bus in every contingency are taken from simulation results. Firstly, simulation running with an increasing all load bus by 25% in a step as contingency. The maximum cluster number determined by using coherency data (V, θ, P and Q) before voltage at a bus consider collapsed. This maximum cluster is then compared by using LVQ result. The test will be repeated by using other contingency such as line outages. A line from bus 3 to 4 will consider outages in order to get the maximum cluster number. Then maximum cluster for this contingency will be compare with LVQ result.
4. RESULTS AND DISCUSSION
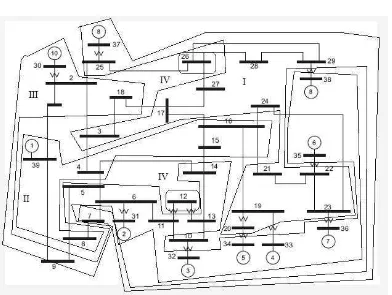
To illustrate the effectiveness of the proposed method in forming the bus clusters, the coherency based clustering algorithm was applied to the IEEE 39-bus test system which consists of 17 load buses and 12 generator buses. Two contingencies were considered in the simulation of voltage collapse, namely, load increase at the load bus and line outage at a particular line.
In this case, for the load increase scenario, the loads at all the load buses were increased in steps of 25% p.u. MVA. All the loads are considered as voltage dependent loads. The simulation results are described as follows:
4.1. Formation of Bus Clusters Due to Load Increase
Figure 1. Procedure for the Formation of Bus Clusters Using Kohonen NN
Table 1. Formation of bus clusters by using Kohonen-NN and LVQ in load increase case
Number of Cluster Number of Cluster
Bus No Kohonen-NN LVQ Type bus Bus No Kohonen-NN LVQ Type Bus
3 1 1 PQ 9 3 3 PQ
7 1 1 PQ 10 3 3 PQ
17 1 1 PQ 11 3 3 PQ
21 1 1 PQ 13 3 3 PQ
23 1 1 PQ 14 3 3 PQ
24 1 1 PQ 18 3 3 PQ
25 1 1 PQ 19 3 3 PQ
27 1 1 PQ 22 3 3 PQ
28 1 1 PQ 30 3 3 PV
29 1 1 PQ 31 3 3 PV
4 2 2 PQ 32 3 3 PV
8 2 2 PQ 33 3 3 PV
15 2 1 PQ 34 3 3 PV
16 2 1 PQ 35 3 3 PV
20 2 2 PQ 36 3 3 PV
39 2 4 PQ 37 3 3 PV
1 3 3 PQ 38 3 3 PV
2 3 3 PQ 12 4 3 PQ
5 3 3 PQ 26 4 1 PQ
6 3 3 PQ
Figure 2 Bus Clusters formed Due to Load Increase
4.2. Formation of Bus Clusters Due to Line Outage
[image:6.595.104.496.330.625.2]Table 2 Formation of bus clusters by using Kohonen-NN and LVQ line outage case
Number of Cluster Number of Cluster
Bus No Kohonen-NN LVQ Type bus Bus No Kohonen-NN LVQ Type Bus
6 1 1 PQ 37 2 2 PV
17 1 1 PQ 39 2 2 PV
23 1 1 PQ 10 3 3 PQ
24 1 1 PQ 11 3 3 PQ
26 1 1 PQ 13 3 3 PQ
27 1 1 PQ 14 3 3 PQ
28 1 1 PQ 15 3 3 PQ
29 1 2 PV 16 3 2 PQ
38 1 2 PQ 18 3 3 PQ
1 2 2 PQ 19 3 3 PQ
2 2 2 PQ 20 3 3 PQ
3 2 2 PQ 21 3 3 PQ
4 2 2 PQ 22 3 2 PQ
5 2 2 PQ 31 3 3 PV
7 2 2 PQ 32 3 3 PV
8 2 2 PQ 33 3 3 PV
9 2 2 PQ 34 3 3 PV
12 2 2 PQ 35 3 3 PV
25 2 2 PQ 36 3 3 PV
30 2 2 PV
[image:7.595.95.512.163.598.2]
Figure 3. Bus Clusters Formed Due to Line Outage
5. CONCLUSIONS
formed. The proposed technique results showed four clusters on contingency load increased and three clusters online outage contingency on IEEE 39 bus system as shown by the LVQ
REFERENCES
[1]. Pandit M, Srivastave L, Sharma JD. ANN Based Voltage Contingency Screening and Ranking using a Novel Feature Selection Technique, IE(I) Journal-EL, 2004:154-160 [2]. Musirin I, Rahman TKA. Voltage Stability Based Weak Area Clustering Technique in
Power System. Proceedings of Power & Energy Conference (PECon). Kuala Lumpur. 2004: 235-240.
[3]. Nizam M. Clustering Based Self-Organizing NN Algorithm for Identification The Weak Area in Power System. Jurnal Media Informatika. 2007; 5(1): 31-39.
[4]. Modi PK, Singh SP, Sharma JD. Fuzzy neural network based voltage stability evaluation of power systems with SVC Source. Applied Soft Computing. 2008; 8(1): 657-665.
[5]. Shamsuddin SM, Zainal A, Yusof NY. Multilevel kohonen network learning for clustering problems. Journal of Information and Communication Technology. 2010; 8(7): 1-25. [6]. Rahman TKA. A New Voltage Index and Its Application in Power System Control. Ph.D
dissertation. Kuala Lumpur: University of Malaya; 1996.
[7]. Mohamed A, Jasmon GB. A New Clustering Technique for Power System Voltage Stability Analysis. Journal of Electric Machines & Power Systems. 1995; 23(2): 389-403. [8]. De Souza ACZ, Quintana VH. New Technique of Network Partitioning for Voltage
Collapse Margin Calculations. IEE Proceeding-C. 1994; 141(6): 630–636.
[9]. Pandit SL, Vijay S. Identification and Ranking of Weak Buses using Modified Counterpropagation Neural Network. Proceedings of IEEE Power India Conference. 2006.
[10]. El-Sharkawi, Niebur D. Artificial Neural Networks with Applications to Power System. Piscataway-New Jersy: Power Engineering Society. 1996: 28-38.
[11]. Kohenen T. Kohonen Formation of Topologically Correct Feature Maps, Biologically Cybernetics. 1982; 1(43): 59-69.
[12]. Moghadam MM, Khaloozadeh H. Optimal Fuzzy Self-Organizing Structure For Voltage Security Margin Estimation. Proceeding of 15th PSCC. Liege. 2005: session 30 No.6. [13]. Niebur D, Germond AJ. Unsupervised Neural Net Classification of Power System Static
Security States. Int. Journal of Electrical Power and Energy System. 1992; 14(2-3): 233-242.