See discussions, stats, and author profiles for this publication at: https://www.researchgate.net/publication/272437053
Pacific saury fishing forecasting by using
random forest
Article
in
NIPPON SUISAN GAKKAISHI · February 2015
DOI: 10.2331/suisan.81.2CITATIONS
0
READS
46
2 authors
, including:
Takashi Matsuishi
Hokkaido University, Hakodate
82PUBLICATIONS580CITATIONS
SEE PROFILE
All content following this page was uploaded by
Takashi Matsuishi
on 31 August 2015.
Tel81138405505.Emailca1201@ˆsh.hokudai.ac.jp
ン ム
を用い サンマ来遊量 予測
馬 場 真 哉,
1松 石
隆
2
点2014年2月21日受付,2014年8月5日受理為
1北海道大学大学院水産科学院,2北海道大学大学院水産科学研究院
Paciˆc saury ˆshing forecasting by using random forest
SHINYABABA1 AND TAKASHIMATSUISHI2
1Graduate School of Fisheries Sciences, Hokkaido University, Hakodate, Hokkaido 0418611,2Faculty of
Fish-eries Sciences, Hokkaido University, Hakodate, Hokkaido 0418611, Japan
3 hro.or.jpもexpもcentralもkanriもSigenHyokaもindex.asp, 北海道立総合研究機構水産研究本部,2012年7月7日
kentropy arg max
k
サ
tion Centerhttp:ももwww.cpc.ncep.noaa.govも,NOAA,2012年7月12日 公開さ い ,広域 海洋,
木法(Classiˆcation and Regression Trees: CART法
を基礎 持 ンサン 学習器 一種 あ 。 ンサ
ン 学習器 ,多く 基本学習器 結果を統合し 予
測を出力す 。本論文 CART法を概説し うえ
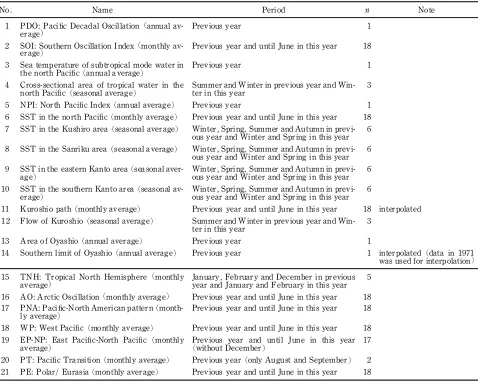
Table 1 List of data sets used for the random forest
No. Name Period n Note
1 PDO: Paciˆc Decadal Oscillation点annual
av-erage為 Previous year 1
2 SOI: Southern Oscillation Index点monthly
av-erage為 Previous year and until June in this year 18
3 Sea temperature of subtropical mode water in
the north Paciˆc点annual average為 Previous year 1
4 Cross-sectional area of tropical water in the
north Paciˆc点seasonal average為 Summer and Winter in previous year and Win-ter in this year 3 5 NPI: North Paciˆc Index点annual average為 Previous year 1 6 SST in the north Paciˆc点monthly average為 Previous year and until June in this year 18 7 SST in the Kushiro area点seasonal average為 Winter, Spring, Summer and Autumn in
previ-ous year and Winter and Spring in this year 6 8 SST in the Sanriku area点seasonal average為 Winter, Spring, Summer and Autumn in
previ-ous year and Winter and Spring in this year 6 9 SST in the eastern Kanto area点seasonal
aver-age為 Winter, Spring, Summer and Autumn in previ-ous year and Winter and Spring in this year 6 10 SST in the southern Kanto area点seasonal
av-erage為 Winter, Spring, Summer and Autumn in previ-ous year and Winter and Spring in this year 6
11 Kuroshio path点monthly average為 Previous year and until June in this year 18 interpolated 12 Flow of Kuroshio点seasonal average為 Summer and Winter in previous year and
Win-ter in this year 3 13 Area of Oyashio点annual average為 Previous year 1
14 Southern limit of Oyashio点annual average為 Previous year 1 interpolated点data in 1971 was used for interpolation為
15 TNH: Tropical North Hemisphere 点monthly
average為 January, February and December in previousyear and January and February in this year 5 16 AO: Arctic Oscillation点monthly average為 Previous year and until June in this year 18 17 PNA: Paciˆc-North American pattern点
month-ly average為 Previous year and until June in this year 18 18 WP: West Paciˆc点monthly average為 Previous year and until June in this year 18 19 EP-NP: East Paciˆc-North Paciˆc 点monthly
average為 Previous year and until June in this year点without December為 17
20 PT: Paciˆc Transition点monthly average為 Previous year点only August and September為 2 21 PE: PolarもEurasia点monthly average為 Previous year and until June in this year 18
Note: The data from lines 1 to 14 were from the Japan Meteorological Agency点http:ももwww.jma.go.jpもjmaも, 10 July 2012為. The data from lines 15 to 21
were from the Climate Prediction Centre点http:ももwww.cpc.ncep.noaa.govも, 26 July 2012為.nis the number of kinds of each data.
5
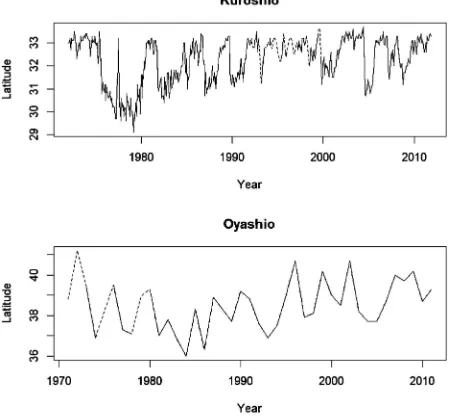
Fig. 1 Result of interpolation. The broken line is
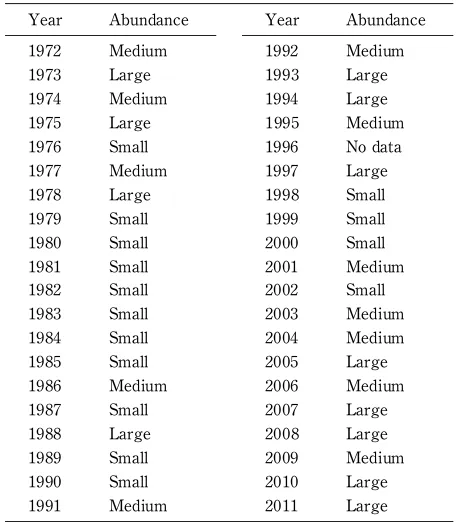
Table 2 Separated ˆsh abundance index Year Abundance Year Abundance 1972 Medium 1992 Medium 1973 Large 1993 Large 1974 Medium 1994 Large 1975 Large 1995 Medium 1976 Small 1996 No data 1977 Medium 1997 Large 1978 Large 1998 Small 1979 Small 1999 Small 1980 Small 2000 Small 1981 Small 2001 Medium 1982 Small 2002 Small 1983 Small 2003 Medium 1984 Small 2004 Medium 1985 Small 2005 Large 1986 Medium 2006 Medium 1987 Small 2007 Large 1988 Large 2008 Large 1989 Small 2009 Medium 1990 Small 2010 Large 1991 Medium 2011 Large
Table 3 Result of variable selection
Variable name Importance index PNA.Nov 34.5 Kuroshio.path.Nov 30.3 North.Paciˆc.Sep 21.6 SOI.Jan 14.9
Note: Importance index was calculated by random forest.PNA.Nov means PNA index in November of the previous year. Kuroshio.path. Nov means interpolated Kuroshio path in November of the previous year. North.Paciˆc.Sep means SST in the north Paciˆc in Septem-ber of the previous year. SOI.Jan means SOI in January of the previ-ous year. The deˆnition of each index follows those of the Japan
Meteorological Agency点http:ももwww.jma.go.jpもjmaも, 10 July 2012為
and Climate Prediction Centre点http:ももwww.cpc.ncep.noaa.govも, 26
July 2012為. Development Core Team, Wien, Austria を使用し 。
ン ム モ 作成 , ッ ー
7
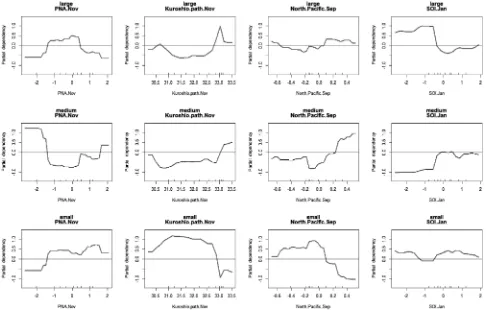
Fig. 2 Partial dependency plot. Partial dependency was calculated by Eq.点9為, and expresses the relative frequency of each ˆsh
abundance level. PNA. Nov means PNA index in November of the previous year. Kuroshio. path. Nov means interpolated Kuroshio path in November of the previous year. North. Paciˆc. Sep means SST in the north Paciˆc in September of the previ-ous year. SOI. Jan means SOI in January of the previprevi-ous year. The deˆnition of each index follows those of the Japan Meteoro-logical Agency点http:ももwww.jma.go.jpもjmaも, 10 July 2012為and Climate Prediction Centre点http:ももwww.cpc.ncep.noaa.govも, 26 July 2012為.
Table 4 Result of forecast evaluation by Monte Carlo
resampling
Actual ˆshing level
Sum Large Medium Small
Forecast
Large 436 98 143 677 Medium 55 251 115 421 Small 138 212 552 902 Sum 629 561 810 2000
9
2為 Watanabe K, Tanaka E, Yamada S, Kitakado T. Spatial and temporal migration modeling for stock of Paciˆc sau-ryCololabis saira点Brevoort為, incorporating eŠect of sea surface temperature.Fish. Sci. 2006;72: 11531165. 3為 Rupp DE, Wainwright TC, Lawson PW, Peterson WT.
Marine environment-based forecasting of coho salmon
点Oncorhynchus kisutch為adult recruitment.Fish. Oceanogr. 2012;21: 119.
11為 Dáƒaz-Uriarte R, De Andres SA. Gene selection and
clas-siˆcation of microarray data using random forest. BMC
Bioinformatics2006;7: 3.
12為 第60, 61回サンマ等 型浮魚資源研究会議報告.東北区
水産研究所資源海洋部.2012, 2013.
13為 Baba S, Matsuishi T. Evaluation of the predictability of ˆshing forecasts using information theory.Fish. Sci. 2014;
80: 427434.
14為 Shannon CE. A mathematical theory of communication.
Bell. Syst. Tech. J. 1984;27: 379423, 623656.
17為 Breiman L, Friedman JH, Olshen RA, Stone CJ. Classiˆ-cation and regression trees. Wadsworth & Brooks, Mon-terey. 1984.
18為 Breiman L. Bagging predictors. Mach. learn. 1996; 24: 123140.
19為 Lee YW, Megrey BA, Macklin SA. Evaluating the perfor-mance of Gulf of Alaska walleye pollock点Theragra chal-cogramma為recruitment forecasting models using a Monte Carlo resampling strategy.Can. J. Fish. Aquat. Sci. 2009;
66: 367381.
20為 Diaz-Uriarte R. GeneSrF and varSelRF: a web-based tool and R package for gene selection and classiˆcation using random forest.BMC Bioinformatics2007;8: 328. 21為 Hanawa K, Watanabe T, Iwasaka N, Suga T, Toba Y.