Voter Turnout Trends
Abdurashid Solijonov
Voter Turnout Trends
© 2016 International Institute for Democracy and Electoral Assistance
International IDEA Strömsborg SE-103 34 Stockholm Sweden
Tel: +46 8 698 37 00, fax: +46 8 20 24 22 Email: [email protected], website: www.idea.int
The electronic version of this publication is available under a Creative Commons Attribute-NonCommercial-ShareAlike 3.0 licence. You are free to copy, distribute and transmit the publication as well as to remix and adapt it provided it is only for non-commercial purposes, that you appropriately attribute the publication, and that you distribute it under an identical licence. For more information on this licence see: <http://creativecommons.org/licenses/by-nc-sa/3.0/>.
International IDEA publications are independent of speciic national or political interests. Views expressed in this publication do not necessarily represent the views of International IDEA, or those of its Boards or Council members.
Cover photograph: ‘Voting queue in Addis Ababa’ (© BBC World Service/Uduak Amimo) made available on Flickr under the terms of a Creative Commons licence (CC-BY-NC 2.0)
International IDEA 5
Contents
Acronyms and abbreviations ... 7Preface ... 8
Acknowledgements ... 10
1. Introduction ... 13
2. What is voter turnout? ... 17
3. Voter turnout across the globe ... 23
4. What factors afect voter turnout? ... 35
5. Conclusions ... 43
References ... 45
Annex 1. Voter turnout in the most recent parliamentary elections as of the end of 2015 ... 47
About the author ... 49
About International IDEA ... 50
6 International IDEA
List of igures
Figure 1. Diference between voter registration
and voting age population statistics ... 18
Figure 2. Voter turnout trends in parliamentary elections in Egypt ... 20
Figure 3. Voter population statistics for countries that hold direct national parliamentary elections (lower house) ... 24
Figure 4. Global voter turnout by region, 1945–2015 ... 26
Figure 5. Voter turnout in Europe, 1945–2015 ... 27
Figure 6. Diferences in turnout between the irst election ater the end of the Cold War and the most recent election ... 28
Figure 7. Freedom House indicators and Voter turnout ... 30
Figure 8. Range of turnouts in the most recent parliamentary elections as of the end of 2015 ... 31
Figure 9. Diference in voter turnout between men and women ... 32
Figure 10. Diference in voter turnout between men and women by country ... 33
Figure 11. Impact of compulsory voting ... 39
Figure 12. Voter turnout in Mexico ... 40
International IDEA 7
Acronyms and abbreviations
EMB electoral management bodies
VAP voting age population
8 International IDEA
Preface
Voter turnout has been declining across the globe since the beginning of 1990s. Such a trend in democratic participation has raised many concerns among election stakeholders. Since its establishment in 1995, International IDEA has keenly engaged in research on voter participation. One outcome of this efort is the Voter Turnout database. he database is a widely acknowledged and well-respected resource for researchers, media, practitioners and other stakeholders. International IDEA has also published several publications on the topic of voter participation, which have inspired further research and debates in the elections ield.
he Voter Turnout database was developed in 1999, and has been continually updated since then. It has served a growing number of users, from about 143,000 in 2006, the earliest year for which user statistics are available, to more than 410,000 in 2015. his shows that the democratic community is concerned about declining voter participation, and therefore uses the data to stay informed about voter turnout trends and inform others about this
crucial issue. Several renowned media outlets, such as CNN, he Economist,
he Guardian and he Washington Post, have used the database as a resource in a variety of articles on the subject. We are pleased that through the Voter Turnout database, we continue to provide a resource that not only creates awareness about the extent of people’s participation in elections, but also, and more importantly, helps electoral stakeholders to make informed policy decisions and programmatic choices to improve the legitimacy of the electoral process.
International IDEA 9
and also encourage election authorities, policymakers and other stakeholders to take serious action to increase voter participation, and at the same time to improve data collection methods in order to better understand voter behaviour.
Declining voter turnout signals the deep problems democracies are facing today. Lower turnout suggests that fewer citizens consider elections the main instrument for legitimizing political parties’ control over political decision-making. It may even show that citizens are less interested in political parties as the main bodies of democratic representation as such. However, lower citizen participation in elections does not necessarily mean that citizens are becoming less active in politics. On the contrary, we have seen a rise in other forms of citizen activism, such as mass protests, occupy movements and increased use of social media as a new platform of political engagement. Such a shift in the channels of political participation, from voting for traditional bodies of representation to new forms of democratic participation and representation, puts serious pressure on governments and the way traditional political parties function. his is therefore the right time for governments and political parties to adapt to recent developments and come up with sound responses. his can be done by embracing all the opportunities, such as repositioning themselves to meet the demands of active citizens, using technologies and social media platforms efectively, and using other innovative strategies to regain citizens’ trust in representative governance. he availability of data on voter turnout, particularly disaggregated by various groups of the population, such as gender, age, geographic location, level of income and other important characteristics, greatly contributes to the efectiveness of such responses.
In addition to engaging directly with national and regional stakeholders, International IDEA will continue to develop cutting-edge knowledge resources for policymakers, practitioners, civil society actors, citizens, media and other stakeholders to help them advance democratic processes. As a crucial part of its broader role in supporting democracy, International IDEA’s work on elections and particularly on voter participation will also continue beyond the work it has done so far.
10 International IDEA
Acknowledgements
International IDEA 13
1. Introduction
Voter turnout is one of the crucial indicators of how citizens participate in the governance of their country. Higher voter turnout is in most cases a sign of the vitality of democracy, while lower turnout is usually associated with voter apathy and mistrust of the political process. Because of its importance, media and civil society actors, as well as the democracy support community and many other stakeholders are concerned when citizens to do not turn out to vote. hey are also keen to understand the reasons behind low turnouts. Collecting comprehensive data on voter turnout from across the globe and trying to understand what afects people’s decisions to vote or not to vote is therefore important. In the late 1990s, International IDEA developed the online Voter Turnout database (VTD), which has become the most authoritative global dataset providing data on elections conducted since 1945. he VTD is regularly updated with the details of the presidential and (lower house) parliamentary elections that take place in every country of the world.1
It also collects data on elections to the European Parliament.
In addition to maintaining the VTD, International IDEA has produced several publications on voter turnout, which present global voter turnout
trends and relevant analyses.2 he VTD has undergone a major update since
publication of the last report in this series in 2006. In addition to the data that have been added on elections that have taken place since, some older data have been corrected and missing data added for some countries.
1 The VTD covers all countries and most territories (e.g. partly recognized states, such as Palestine and Kosovo, self-governing islands, like the Faroe Islands, and overseas territories, like Gibraltar) for which voter turnout data are available.
14 International IDEA
Voter Turnout Trends around the World
his report is a continuation of International IDEA’s earlier publications on voter turnout, but in a much shorter form. It presents a brief summary of recent global trends in voter turnout and addresses some of the most frequent questions and concerns raised on the topic. he report begins by exploring methods used to measure voter turnout and the challenges associated with these. he report then presents voter turnout trends across the globe as a regional comparison for the period 1945–2015, and a detailed exploration of more recent data. Finally, the report discusses some of the major factors that afect voter turnout.
Presidential elections are not held in all countries. herefore, in order to present and discuss global trends in voter participation, this report uses the data on lower house parliamentary elections. hose who are interested in the trends in presidential elections should explore the relevant data in the online
platform of the VTD.3
International IDEA 17
2. What is voter turnout?
Voter turnout is the extent to which eligible voters use their vote on election day. It is measured as the percentage of votes cast at an election, including invalid
votes.4 he term ‘eligible voters’ can be deined in many ways. International
IDEA has adopted two measures: irst, the number of registered voters as oicially reported by the national bodies responsible for compiling voters’ lists; and second, the voting age population (VAP), which is an estimate of the proportion of a country’s population that is of voting age.
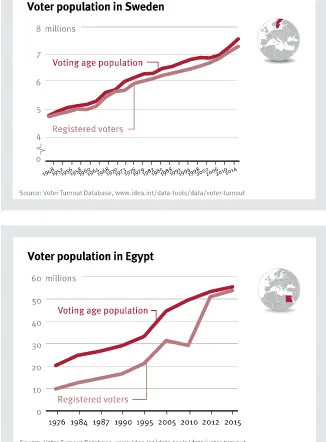
here are two main reasons for using both voter registration and VAP statistics to measure the number of eligible voters. First, in some countries registration data are either inaccurate or unavailable, and sometimes voter registers are not used. In such cases, VAP statistics can be used as an alternative to estimate voter turnout. Second, and most importantly, the VAP statistics can provide a clearer picture of participation in some countries as they signal a problem with the voters’ list or registration system. Figure 1 shows how voter registration numbers difer from the VAP in two countries.
18 International IDEA
Voter Turnout Trends around the World
International IDEA 19 2. What is voter turnout?
In Sweden, as in most established democracies, voter registration and the VAP statistics are very close to each other. his is the way it should be, because those who are eligible to vote should be registered on the voters’ list. In Egypt, by contrast, there was a signiicant divergence between voter registration and the VAP statistics in the period 1976–2012. his can be explained by the fact that many voters were denied a political voice during this period, which resulted
in much lower voter registration igures.5 More than 10 million people were
unable to register to vote between 1976 and 2005, and this number reached almost 20 million in 2010. After the Egyptian revolution in 2011, reforms were carried out based on the amended Constitution of 2011. he Egyptian electoral system adopted an automatic universal voter registration system, which is based on the National Identiication Database. he impact of the new system can be clearly seen in Figure 1—the voter registration and VAP statistics were very close to each other in the 2012 and 2015 elections.
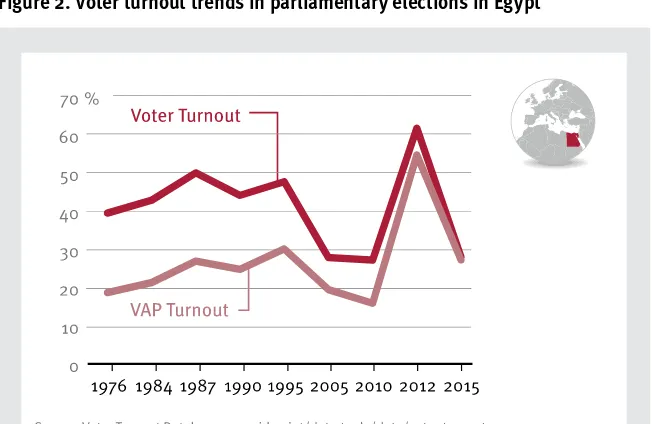
Interestingly, the voter registration reform, together with the overall political situation and the introduction of a proportional electoral system,6 had a huge
impact on voter turnout in Egypt’s 2012 elections (see Figure 2), which were the irst after the revolution. Voter turnout was more than double that of the previous elections held in 2010. However, voter enthusiasm had cooled by the time of the elections in 2015, when turnout declined to 28 per cent.
5 See ‘Learning a Lesson from Egypt’s Universal Voter Registration’, <http://www.fairvote.org/ learning-a-lesson-from-egypt-s-universal-voter-registration>, accessed 2 March 2016. 6 A system of proportional representation, which gives political parties a number of seats
20 International IDEA
Voter Turnout Trends around the World
Figure 2. Voter turnout trends in parliamentary elections in Egypt
he problems with voter registration in the period 1976–2010 make the use of VAP igures a more reliable method of assessing voter participation in Egypt. he use of VAP estimates in this case takes account of the fact that a huge portion of the population was unable to register to vote.
Data in the VTD show that similar problems with voter registration exist in South Africa, where almost 10 million people were not included on the voters’ list for the 2014 elections; and in Pakistan, where more than 28 million people were not registered for the 2013 general elections. However, registration igures can sometimes be higher than estimates of the VAP, which means that the voter register can contain more people than the number of eligible voters. In Afghanistan’s presidential elections in 2014, for example, the voters’ list contained roughly four million more people than the country’s VAP.
International IDEA 21
managed to register 25 million voters, and the national voter turnout was calculated based on this igure.
Another problem associated with the use of a VAP estimate is that it is not able to exclude those people in a population who may be ineligible to register or vote due to factors such as non-citizenship, mental illness or imprisonment. he factor of non-citizenship in particular can introduce signiicant error into the calculation of the VAP in some countries. For example, Singapore has a migrant, non-resident population of more than 1.5 million people, which
makes up 29 per cent of the population.7 he non-resident population of
Singapore is not eligible to vote, and there is therefore a big diference between
voter registration igures and the VAP.8
In order to apply a standard methodology for all countries, International IDEA does not treat cases such as Singapore diferently and does not adapt VAP igures. Instead, the VAP igures are always calculated based on overall population statistics. Such an approach can sometimes help to initiate discussions and political debate on the issue of why non-residents or other groups within a population are ineligible to vote.
Taking into account the limitations of both methods of calculating the number of eligible voters, this report gives preference to voter registration statistics. Only voter registration statistics are used in the calculations of voter turnout below.
7 The 2014 Population in Brief, <http://www.nptd.gov.sg/portals/0/news/population-in-brief-2014. pdf>, accessed 2 March 2016.
International IDEA 23
3. Voter turnout across the globe
Recent global trends
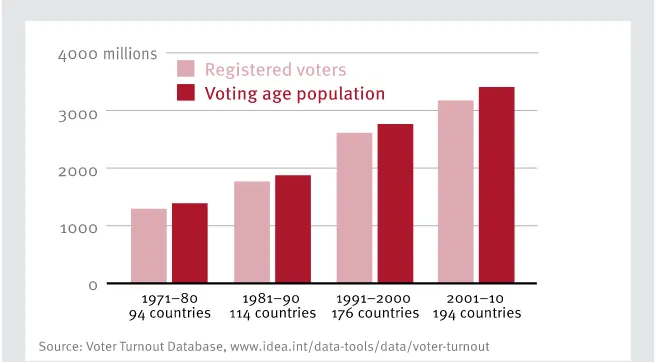
he number of countries that hold direct parliamentary elections has increased signiicantly since the 1990s (see Figure 3). he major reason for this growth is the end of the Cold War, which stimulated democratic processes in regions formerly under Soviet inluence and the emergence of multiparty elections across the African continent. Accordingly, the global population of people entitled to vote has more than doubled in the four decades to 2010. Needless to say, the general growth of the global population has also contributed to the growth of the global voting population. here are only a few countries left in the world, such as Brunei Darussalam, China, Eritrea, Saudi Arabia and Vatican City, that do not hold direct national elections.9
Figure 3. Voter population statistics for countries that hold direct national parliamentary elections (lower house)
24 International IDEA
Voter Turnout Trends around the World
he columns in Figure 3 show the diference between the number of registered voters and the VAP in each decade. hey show that the total number of registered voters has always been lower than the total estimate of the VAP. Roughly 230 million people were not included on voters’ lists across the globe in the decade 2001–10, which is nearly the equivalent of the population of Indonesia. It should be noted, however, that since the VAP of each country is an estimate, the igure of 230 million is also a very rough estimate.
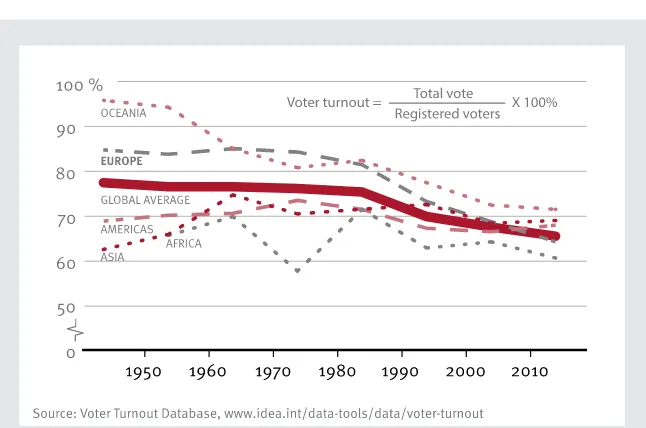
Despite the growth in the global voter population and the number of countries that hold elections, the global average voter turnout has decreased signiicantly since the early 1990s (see Figure 4). Global voter turnout was fairly stable between the 1940s and the 1980s, falling only slightly from 78 per cent to 76 per cent over the entire period. It then fell sharply in the 1990s to 70 per cent, and continued its decline to reach 66 per cent in the period of 2011–15.
In Europe, the region which experienced the highest level of voter turnout between the 1940s and the 1980s, voter turnout has decreased signiicantly since the 1990s. he decline in Europe is more signiicant than the decline in the other regions. In Asia and the Americas, the trends in voter turnout appear more stable over time. However, in both regions voter turnout has been much below the global average for most of the decades since the 1940s. Africa generally has the lowest turnout over the entire period since the 1950s. It should be noted, however, that for the decade of 1950s the VTD contains data only for the three African countries that held national legislative elections. In later decades the number of African countries holding legislative elections increased gradually to 10 in the 1960s, 11 in the 1970s and 16 in the 1980s. A dramatic increase can be observed in the 1990s, when 43 countries held national legislative elections. hus, voter turnout trends from the 1990s relect a more representative picture of participation on the continent.
International IDEA 25 3. Voter turnout across the globe
Figure 4. Global voter turnout by region, 1945–2015
Declining voter turnout in Europe
26 International IDEA
Voter Turnout Trends around the World
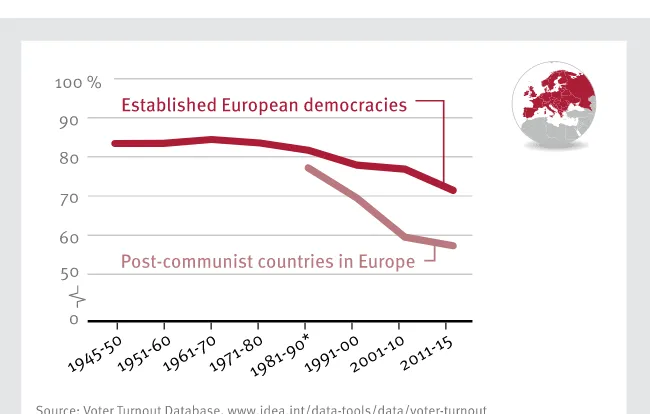
Figure 5. Voter turnout in Europe, 1945–2015
Established European democracies (countries and territories): Andorra, Austria, Belgium, Cyprus, Denmark, Faroe Islands, Finland, France, Germany, Gibraltar, Greece, Iceland, Ireland, Italy, Liechtenstein, Luxembourg, Malta, Monaco, the Netherlands, Norway, Portugal, San Marino, Spain, Sweden, Switzerland, United Kingdom.
Post-communist countries in Europe: Albania, Belarus, Bosnia and Herzegovina, Bulgaria, Croatia, Czechia, Estonia, Hungary, Kosovo, Latvia, Lithuania, Macedonia, Moldova, Montenegro, Poland, Romania, Russia, Serbia, Slovakia, Slovenia, Ukraine, Yugoslavia (the Union of Serbia and Montenegro).
* he irst post-Cold War elections in post-communist countries were held during 1989– 1990. Poland held its irst post-Cold War election in 1989, and 10 other countries followed in 1990. Data for the elections held in Poland and Yugoslavia before the end of Cold War are included in the VTD. here are no data in the VTD for elections held in the countries of the former Eastern bloc, the former Soviet Union or the former Yugoslavia before 1990.
International IDEA 27
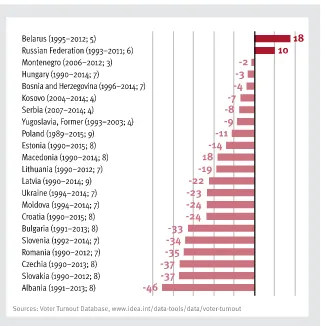
Figure 6. Diferences in turnout between the irst election after the end of the Cold War and the most recent election
A number of empirical studies have been conducted to investigate the causes of such a consistent decline in voter turnout in the post-communist countries of Europe. One of the most frequently cited causes draws on the ‘founding elections’ hypothesis, which suggests that the irst elections after the end of authoritarian rule attract greater voter engagement and that this enthusiasm declines in later elections. For example, Kostadinova (2003) and Kostadinova and Power (2007) provide evidence for this theory—they found that the second, third and fourth post-communist elections in Eastern Europe experienced signiicant declines. his is conirmed by the data in Figure 5, which show a signiicant fall in turnout in the post-communist countries throughout the 1990s.
28 International IDEA
Voter Turnout Trends around the World
However, Figure 5 shows even more signiicant declines in subsequent decades, which casts doubt on the founding elections hypothesis. he further declines in the 2000s and 2010s indicate that other factors are probably also in play. his makes alternative explanations for the decline in the region more appealing: that the decline in voter turnout is due to disenchantment with democracy and disappointment over the transitional hardships (Mason 2003/04). his explanation has been widely discussed among scholars, and there are many who support it. Karp and Milazzo (2015), however, argue that while attitudes to democracy signiicantly afect voter behaviour across Europe, they cannot explain the diferences in voter turnout between countries in the western and eastern parts of Europe. Investigating post-communist voter turnout, Pacek et al. (2009) also found weaker evidence for disenchantment-based approaches to explaining variations in voter turnout, arguing instead that what is at stake in elections has a greater impact on voter participation. heir analyses show, for example, that voter participation is higher in important elections, such as those that relate to the long-term political future of the country, and when the country faces fewer external constraints on policymaking.
he indings from the literature review generally show that declining voter turnout in post-communist Europe is yet to be properly understood. he continuing decline in recent years (2011–15) (see Figure 5), after most of the above-mentioned studies were conducted, calls for ever more serious engagement by researchers. Kostadinova and Power (2007: 373) argue that ‘somewhere ahead there is a natural “loor” for turnout—a point at which participation is unlikely to drop further’. However, the more recent data in Figure 5 show that there is no sign yet, of post-communist European countries reaching that loor.
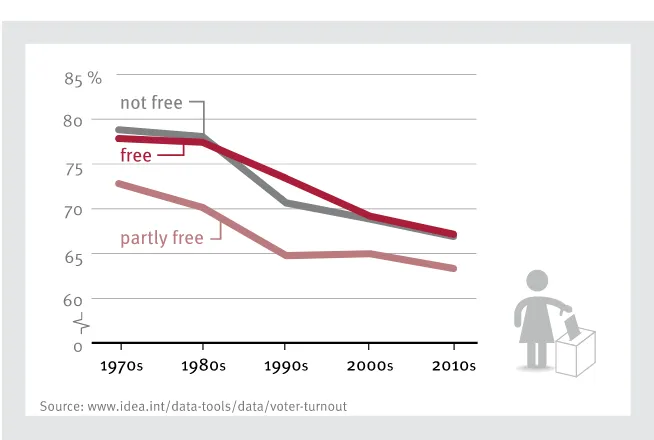
Following the discussion of diferences in turnout between consolidated and emerging democracies in Europe, it is useful to explore global diferences in voter turnout between democratic and non-democratic countries. Figure 7 shows the trends in voter turnout in all the countries that hold parliamentary elections grouped by Freedom House indicators. It is interesting to note that with the exception of the 1990s, both the level of voter turnout and its rate of decline have been fairly similar in free and not free countries. hese similarities between two distinct groups of countries require targeted study.
Voter turnout in partly free countries, on the other hand, has consistently
International IDEA 29
Figure 7. Voter Turnout trends based on level of democracy
Turnout in the most recent parliamentary elections
Annex 1 lists countries in descending order based on voter turnout in the most recent national parliamentary (lower house) elections as of the end of 2015. Among the 26 countries that have compulsory voting, 12 (46 per cent) are located at the top of the list, with turnout rates above 81 per cent. his provides good evidence of the impact of compulsory voting on voter turnout. However, two countries with compulsory voting (Egypt and Gabon) appear at the bottom of the list. his is because there are no sanctions for not voting in Gabon, while in Egypt, even though the law states that non-voters will be ined, this is not the practice in reality.
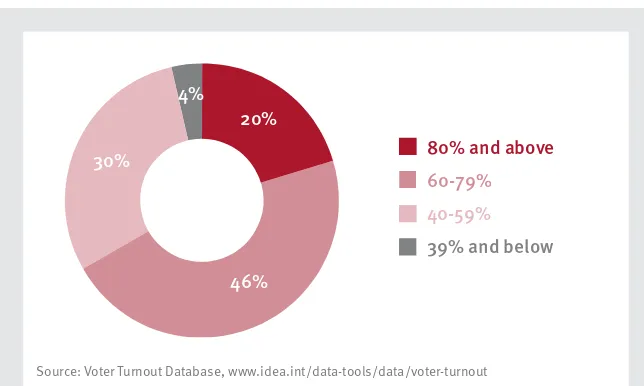
Figure 8 summarizes the data in Annex 1. Almost half the countries in the world have voter turnouts of 60–79 per cent, while turnouts above 80 per cent can be found in only 20 per cent of countries. Only 4 per cent of countries have turnout rates below 39 per cent, which provides some consolation in the face of declining turnouts globally.
30 International IDEA
Voter Turnout Trends around the World
Figure 8. Range of turnouts in the most recent parliamentary elections as of the end of 2015
Gender and voter turnout
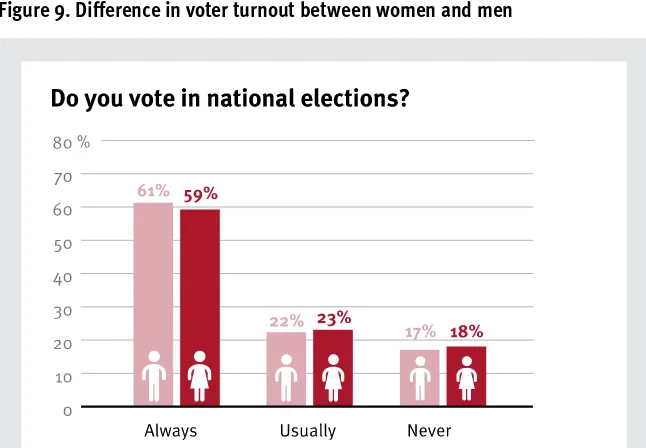
he gender gap in voter turnout is often the source of intense debate among practitioners, activists, electoral management bodies (EMBs), policymakers and researchers, who are keen to understand whether turnout difers between men and women, and identify the possible reasons for this. Studies conducted so far on gender diferences in voter participation have found mixed results. In the United States, for example, women’s turnout has been higher than men’s in every presidential election since 1980 (CAWP 2015). he aggregate indings of the most recent World Values Survey, however, reveal only minor diferences in voter turnout between men and women (Figure 9).
Notes: Data were collected from 196 countries.
Source: Voter Turnout Database, www.idea.int/data-tools/data/voter-turnout
60-79%
80% and above
20%
46% 30%
4%
39% and below
International IDEA 31
Figure 9. Diference in voter turnout between women and men
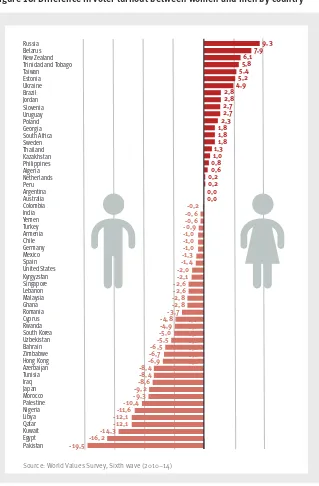
When the data are disaggregated by country, however, signiicant gender diferences in voter turnout emerge in nearly a quarter of the countries in which the survey was conducted (Figure 10). he lowest rates of female participation in elections are found mainly in countries in the Middle East, North Africa and Asia. Female participation is lowest in Pakistan. Countries from diverse regions can be found in the middle of the range. Equal rates of participation were found in Australia and Argentina. Some countries in the Middle East—Turkey and Yemen—have almost equal rates of participation between female and male voters. Women are more active in elections than men in 21 of the countries, most notably Belarus, New Zealand, Russia and Trinidad and Tobago.
32 International IDEA
Voter Turnout Trends around the World
Figure 10. Diference in voter turnout between women and men by country
Russia
Notes: The figure shows the differences between the percentage of female and male respondents who answered ‘always’ to the question: “Do you vote in national elections?” Data were collected from 58 countries.
9,3
International IDEA 33
here is great interest among the users of the VTD in gender disaggregated voter turnout statistics as oicially reported by election authorities. Unfortunately, such data are not available in most countries. Voting secrecy makes it diicult for election administrators to extract gender statistics from electoral results. While some countries, such as Australia, Costa Rica and India, do collect such data, most countries do not allocate the time and efort required to do so. Figures 9 and 10 therefore use data from the World Values Survey, which is based on the responses of a representative sample of people from each country covered by the survey. Since administrative data reported by election authorities provide a more accurate measure of voter turnout than survey-based studies (Elections Canada 2012), International IDEA encourages national EMBs to establish procedures to track gender diferences in voter participation. Such data would provide a better understanding of difering rates of voter turnout between men and women; and help to resolve the problem if the diference is found to be signiicant.
Voter participation data should be disaggregated not only by gender, but also preferably by other characteristics such as age, ethnicity, religion, geographic location, level of education, level of income, and so on. Such data would help to identify whether any groups in the population are voting less than others, and the possible reasons for abstention in those groups. he indings could then be used to develop targeted strategies to encourage voter participation among members of speciic groups of the population, such as voter education in minority languages, voter registration campaigns in remote areas or cultural events to attract youth.
International IDEA 35
4. What factors afect voter turnout?
Many factors afect a voter’s decision to cast his or her vote on election day and the interplay between these factors is diferent in every country. Journalists, civil society actors and other stakeholders concerned about low rates of voter participation are often eager for easy explanations for why people do not vote. Voter behaviour is highly complex, however, and social scientists have been studying it from diferent angles for many decades.
A great number of empirical studies have been conducted to try to understand how various factors afect voter turnout (see for example Blais and Dobrzynska 1998; Geys 2006). International IDEA’s publication on voter turnout discusses most of the factors that cause such variations in detail (International IDEA 2006). he factors most commonly cited in the literature are listed below.
1. Socio-economic factors
• Population size. In countries with smaller populations, the impact of each vote is greater and thus more people turn out to vote in an election.
• Population stability. People who reside in the same area for longer periods of time usually have better knowledge of local issues and candidates, and are also more concerned about the political decisions that afect their daily lives. hus, they will be more likely to vote in an election. Frequent movement from one place to another, on the other hand, may decrease people’s desire to engage in the political process.
36 International IDEA
Voter Turnout Trends around the World
afected by poverty do not have access to even a basic education that would enable them to understand how their vote is expected to afect the direction of government policies.
2. Political factors
• Closeness of elections. he decision to vote is inluenced by the probability that an individual vote will have an impact on the election result. herefore, the closer the election between parties or candidates is expected to be, the higher the likelihood that voters will cast their vote.
• Perception of the political issues at stake. he degree to which diferent election outcomes might lead to a diferent direction in the policies of the government on important issues will afect turnout. If, for example, the political parties contesting an election have diferent agendas on how to resolve a speciic economic problem that afects the majority of the population (e.g. lack of housing), this will have a signiicant impact on citizens’ desire to vote in order to elect the party that best represents their views on the issue.
• Campaign expenditures. More money spent on campaigning increases awareness of an election, which can afect the feeling of ‘civic duty’ among citizens. Greater resources can also enable wider distribution of political information, which helps citizens to obtain the necessary information about candidates and political party platforms. On the other hand, there is increasing concern globally about the role of money in politics (International IDEA 2015). he involvement of large amounts of money in election campaigns, mainly from private donors, is creating intense debate about the impact of the richest segments of the population on national policies.
International IDEA 37 4. What factors afect voter turnout?
3. Institutional factors
• Electoral system. Voter turnout is higher in elections that use systems of proportional representation than in those that use plurality/ majority systems.
• Compulsory voting. Naturally, when voters are legally obliged to vote, turnout increases dramatically, as in the case of Australia discussed above. Based on global data since 1945, Figure 11 shows how voter turnout rates difer between countries that have compulsory voting requirements and those that do not. However, as noted above, in some countries with compulsory voting the sanctions for not voting can be weak or the regulation is not well observed, which results in lower turnouts.
Figure 11. Impact of compulsory voting
38 International IDEA
Voter Turnout Trends around the World
elections. In the elections held in 1985, 2003 and 2009, however, Mexicans voted only for the lower house and in municipal elections.
Figure 12. Voter turnout in Mexico
• Registration requirements. he existence of individual registration requirements that must be fulilled by the voter creates an additional burden for voters, because registration requires time and energy. In some settings, registration may also entail direct inancial costs such as for travel to registration centres. hese burdens can afect registration rates and consequently voter turnout. Automatic registration (i.e. the use of civil registries to create voter lists) or election day registration are seen as eicient ways of removing registration-related barriers.
• Voting arrangements. he design of various types of voting arrangement can have an impact on voter turnout. hese include single or multiple voting days, elections taking place on rest or working days, the availability of voting technologies, the proximity of polling stations and alternative voting procedures, such as advance voting, postal voting or proxy voting. Although e-voting is attracting a lot of interest, its impact on voter turnout is unproven. Eight countries, six of which are in Europe, have recently abandoned the use of e-voting, mainly due to security concerns.10
International IDEA 39
4. Individual factors
• Age. Age is one of the most important factors to afect voter turnout.
Youth voter apathy is a primary source of concern in many countries. he indings of the World Value Survey research conducted between 2010 and 2014 show signiicant diferences in voter turnout between people aged 25 or under and those aged 26 or over (Figure 13). he research covered 59 countries representing all the regions of the world.
Figure 13. Diferences in voter turnout by age
• Education. Higher levels of education can generally be associated with higher rates of voter turnout. However, research has led to contradictory indings about this relationship (see International IDEA 2006: 13–14).
• Political interest. he level of interest in politics can be a factor that drives turnout at elections. Societies that encourage citizens’ interest in the political process through the introduction of citizenship education in schools, as well as a transparent environment that allows political discussion and debate, among other things, can boost voter participation.
40 International IDEA
Voter Turnout Trends around the World
• Civic duty. A perception of civic duty is one of the most crucial factors afecting attitudes to voting in elections. In many societies people perceive it to be their duty to contribute to political decision making.
he factors discussed above appear in most of the literature on voter turnout. However, other studies have identiied additional factors that do not belong in the above four groups but still play a major role in explaining voter behaviour. For example, using comparative data from 170 regions of 18 European countries, Sundström and Stockemer (2015) ind that regional variations in the perceived level of corruption have a substantial impact on voter turnout. Perceptions of corruption in government services suppress citizens’ desire to turn out on election day. Another example is the perception of electoral fairness. Using data from a large number of countries, Birch (2010) inds that perceptions of electoral integrity are positively associated with voter participation. he impact of decentralization on voter turnout has also been investigated. Drawing on data from Canada and Spain, Blais et al. (2011) ind that decentralization increases turnout in regional elections and reduces the diference in voter participation between regional and national elections in both countries.
It is also important to note some of the factors that afect only certain groups of the population, such as women, minority groups, youth and so on. For example, the lack of freedom of movement for women or other traditional practices that limit women’s agency and participation in public life may have a negative impact on women’s turnout in elections. In some settings, the issue of personal security also becomes a serious factor that hinders women’s ability to go out and vote. In some countries, certain minority groups may experience diiculties with voting due to conlict situations (e.g. Rohingya in Myanmar), or simply because they live in remote areas where access is limited. Young people may be motivated not to vote because their demands are not being addressed by the political parties or leaders competing in elections. In addition, political messages may not be properly communicated to youth, and they may therefore know less about the political process. Unfortunately, research that explores variations in voter turnout among diferent groups of the population is very limited, not least as mentioned above due to the lack of detailed, disaggregated data. National election authorities must therefore work to improve their data collection methods and procedures.
International IDEA 41
analysis of a country’s environment should be conducted that takes account of the factors discussed above, and perhaps some other factors that have not been considered so far. For example, in the case of Egypt discussed above, at least three factors were behind the sharp increase in voter turnout in the 2012 elections (see Figure 2): (a) improved voter registration procedures; (b) the introduction of a proportional electoral system; and (c) a more open and dynamic political environment following regime change.
International IDEA 43
5. Conclusions
he number of countries that hold direct national elections has increased substantially since the beginning of the 1990s. However, the global average voter turnout has decreased signiicantly over the same period. he decline in Europe is the most visible, and is a result mainly of the sharp decline in post-communist states. Since voter turnout is a crucial indicator of the level of citizens’ interest and participation in political processes, the causes of such a decline must be investigated and better understood. he existing literature suggests several explanations for the decline in Europe. he debate among scholars is continuing, however, and evidence of a further decline in recent years (2011–15) should provide new impetus for the research community to explore the topic.
he global decline in voter turnout has occurred in parallel with the emergence of many negative voices about the state of democracy around the world. Diamond (2015: 152) argues that: ‘low rates of voter participation are additional signs of democratic ill-health’. Given the importance of elections to democracy, the issue of voter participation should be taken more seriously by election stakeholders. he fact that this downward trend in voter turnout worldwide is not showing any signs of recovery demands not only enquiry into the causes of the decline, but also immediate action to improve voter participation. If voter turnout in Europe, for example, continues to decline at the current rate, there is a risk that elections might lose their appeal in the region as a fundamental tool of democratic governance.
44 International IDEA
Voter Turnout Trends around the World
can speciic policy decisions and efective action be taken to remove all the barriers identiied as obstructing voter participation.
International IDEA 45
References
Birch, S., ‘Perceptions of Electoral Fairness and Voter Turnout’, Comparative Political Studies, 43/12 (2010), pp. 1601–22
Blais, A., Anduiza, E. and Gallego, A., ‘Decentralization and voter turnout’,
Environment and Planning C: Government and Policy, 29 (2011), pp. 297–320
Blais, A. and Dobrzynska, A. ‘Turnout in electoral democracies’, European Journal of Political Research, 33 (1998), pp. 239–61
Center for American Women and Politics (CAWP), Gender Diferences in Voter Turnout, 2015, <http://www.cawp.rutgers.edu/sites/default/iles/resources/ genderdif.pdf>, accessed 16 March 2016
Diamond, L., ‘Facing up to the democratic recession’, Journal of Democracy, 26/1 (2015), pp. 141–55
Elections Canada, Estimation of Voter Turnout by Age Group and Gender at the 2011 Federal General Election (Elections Canada, Working Paper Series, April 2012), <http://www.elections.ca/res/rec/part/estim/estimation41_e.pdf>, accessed 15 July 2016
Geys, B. ‘Explaining voter turnout: A review of aggregate-level research’, Electoral Studies, 25 (2006) pp. 637-663
International IDEA, Voter Turnout Since 1945: A Global Report (Stockholm: International IDEA, 2002)
International IDEA, Voter Turnout in Western Europe since 1945: A Regional Report
(Stockholm: International IDEA, 2004)
International IDEA, Engaging the Electorate: Initiatives to Promote Voter Turnout from Around the World (Stockholm: International IDEA, 2006)
46 International IDEA
Voter Turnout Trends around the World
Karp, J.A. and Milazzo, C. ‘Democratic scepticism and political participation in Europe’, Journal of Elections, Public Opinion and Parties, 25/1 (2015), pp. 97–110
Kostadinova, T., ‘Voter turnout dynamics in Post-communist Europe’, European Journal of Political Research, 42 (2003), pp. 741–59
Kostadinova T. and Power, T.J., ‘Does democratization depress participation? Voter turnout in the Latin American and Eastern European transitional democracies’,
Political Research Quarterly, 60/3 (2007), pp. 363–77
Mason, D. S., ‘Fairness matters: Equity and the transition to democracy’, World Policy Journal, 20/4 (2003/04), pp. 48–56
Pacek, A.C., Pop-Eliches, G. and Tucker, J.A. ‘Disenchanted or discerning: Voter turnout in post-communist countries’, Journal of Politics, 71/2 (2009), pp. 473–91
Sundström, A. and Stockemer, D., ‘Regional variation in voter turnout in Europe: he impact of corruption perceptions’, Electoral Studies, 40 (2015), pp. 158–69
COUNTRY/TERRITORY
1Lao People’s Dem. Republic 2011 99.69 2Viet Nam 2011 99.51
3Rwanda 2013 98.80 4Nauru 2013 96.91 yes
5Equatorial Guinea 2004 96.45
6Singapore 2015 93.56 yes 7Australia 2013 93.23 yes
8Ethiopia 2015 93.22
9Malta 2013 92.95
10Turkmenistan 2013 91.33
11Luxembourg 2013 91.15 yes
12Cuba 2013 90.88
13Bahamas 2012 90.78 14Antigua and Barbuda 2014 90.27
15Solomon Islands 2014 89.93
16Uruguay 2014 89.62 yes 17Faroe Islands 2008 89.50
18Belgium 2014 89.37 yes
19Guinea-Bissau 2014 88.57 20Uzbekistan 2014 88.51
21Sao Tome and Principe 2010 88.45 22Grenada 2013 87.73
23Bolivia 2014 87.45 yes
24Kenya 2013 85.91 25Denmark 2015 85.89
26Sweden 2014 85.81 29Turkey 2015 85.18 yes
28Aruba 2013 84.86
29Malaysia 2013 84.84 30Botswana 2014 84.75
31Fiji 2014 84.60
32Peru 2011 83.72 yes
33Samoa 2001 82. 54
34Tajikistan 2015 82.00 35Iceland 2013 81.44
36Argentina 2015 81.07 yes 37Ecuador 2013 80.84 yes
38Brazil 2014 80.60 yes
39East Timor 2007 80.54 40Ghana 2012 80.01
41Tuvalu 2002 79.99
42Cayman Islands 2013 79.87 43Liechtenstein 2013 79.80 yes
44Sierra Leone 2012 79.28 45Nicaragua 2011 79.09
46Cyprus 2011 78.70 yes
47Norway 2013 78.23 48Maldives 2014 77.93
49Palestine 2006 77.70
50Sri Lanka 2015 77.66
COUNTRY/TERRITORY
52 New Zealand 2014 76.95
53Papua New Guinea 2012 76.89 54 Tonga 2014 76.80
55 Cameroon 2013 76.79 56 Cabo Verde 2011 76.01
57Cook Islands 2014 75.82
58 Kazakhstan 2012 75.44 59 Italy 2013 75.19
60 Panama 2014 75.19 yes 61 Indonesia 2014 75.11
62 Yemen 2003 74.98
63 Austria 2013 74.91 64 Taiwan 2012 74. 70
65Netherlands 2012 74.56
73 South Africa 2014 73.48 74Saint Vincent and The Grenadines 2015 73.39
75 Anguilla 2015 73.24
81 Saint Kitts and Nevis 2015 72.19 82 Namibia 2014 72.00
94Republic of The Congo (Brazzaville) 2002 69.36 95Djibouti 2013 69.16
96 Cambodia 2013 68.49 97 Canada 2015 68.49
98 Costa Rica 2014 68.38 yes
99 Paraguay 2013 68.24 yes 100Kiribati 2007 67.54
101Tunisia 2014 67.43 102Finland 2015 66.85
103Trinidad and Tobago 2015 66.84 104Virgin Islands, British 2015 66.58
105India 2014 66.40
106Bhutan 2013 66.13 107United Kingdom of Great Britain
and Northern Ireland
2015 66.12
108Togo 2013 66.06
109Benin 2015 65.91
110Andorra 2015 65.62 111Netherlands Antilles 2010 65.41
112Mongolia 2012 65.24 113Barbados 2013 65.05
114Estonia 2015 64.23
115Iran, Islamic Republic of 2012 64.20 116San Marino 2012 63.85
117Greece 2015 63.60 yes 118Guinea 2013 63.53
119Nepal 2008 63.29
120Vanuatu 2012 63. 22 121Macedonia 2014 62.98
122Armenia 2012 62.87
123Angola 2012 62.75 124Tanzania, United Republic of 2015 62.68
125Hungary 2014 61.84 126Central African Republic 2011 61.16
127Honduras 2013 61.16 yes
128Croatia 2015 60.82
129Iraq 2014 60.53
130Burkina Faso 2015 60.13 131Russian Federation 2011 60.10
132Georgia 2012 59.76
133Czechia 2013 59.48 134Uganda 2011 59. 29
135Slovakia 2012 59.11 136Congo, Democratic Republic of 2011 59.05 yes
137Latvia 2014 58.80
138Saint Lucia 2011 56.84
139Oman 2015 56.66
140Kyrgyzstan 2015 56.62
141Chad 2011 56.60
142Jordan 2013 56.45
143Dominican Republic 2010 56.43 yes 144Dominica 2014 56.31
145Portugal 2015 55.84
146Moldova, Republic of 2014 55.80 147Azerbaijan 2015 55.54
148France 2012 55.40
149 Bosnia and Herzegovina 2014 54.54 150 Korea, Republic of 2012 54.26
151Lebanon 2009 53.98 yes 152 Zambia 2011 53.65
164 Syrian Arab Republic 2012 51.26 165 Bulgaria 2014 51.05
172Mexico 2015 47.72 yes 173Thailand 2014 46.79 yes
174 Lesotho 2015 46.61 175 Sudan 2015 46.40
176 El Salvador 2015 45.91
177Marshall Islands 2015 45.85 178 Afghanistan 2010 45.83
179 Morocco 2011 45.40 180 Micronesia, Federated States of 2013 44.68
181Nigeria 2015 43.65
182 Colombia 2014 43.58 183 Algeria 2012 43.14
184Kosovo 2014 42.63 185 United States of America 2014 42.50
186 Romania 2012 41.76
192 Côte d’Ivoire 2011 36.56 193 Gabon 2011 34.28 yes
194 Egypt 2015 28.27 yes
195 Gambia 2012 19.44 196Haiti 2015 17.82
A n n e x 1 .
Voter turnout in the most recent national parliamentary election
International IDEA 49
About the author
Abdurashid Solijonov is a Programme Oicer in the Electoral Processes Programme. Solijonov is responsible for maintaining, updating, and developing International IDEA’s election-related datasets. He regularly conducts global comparative research of legal reforms related to elections and updates datasets accordingly. He also responds to frequent media enquiries related to elections, and develops targeted infographics for social media using data from datasets.
50 International IDEA
About International IDEA
he International Institute for Democracy and Electoral Assistance (International IDEA) is an intergovernmental organization that supports sustainable democracy worldwide. International IDEA’s mission is to support sustainable democratic change by providing comparative knowledge, assisting in democratic reform, and inluencing policies and politics.
What does International IDEA do?
In the ields of elections, constitution-building, political parties, gender in democracy and women’s political empowerment, democracy self-assessments, and democracy and development, the institute undertakes its work in three activity areas:
1. providing comparative knowledge derived from practical experience on democracy-building processes from diverse contexts around the world;
2. assisting political actors in reforming democratic institutions and processes, and engaging in political processes when invited to do so; and
3. inluencing democracy-building policies through the provision of comparative knowledge resources and assistance to political actors.
Where does International IDEA work?
International IDEA works worldwide. Based in Stockholm, it has oices in Africa, the Asia-Paciic, and Latin America and the Caribbean. International IDEA is a Permanent Observer to the United Nations.
International IDEA 51
More International IDEA resources
on electoral processes
Risk Management in Elections
2016, 68 pp
Electoral Justice Regulations Around the World: Key indings from International IDEA’s global research on electoral dispute-resolution systems
2016, 70 pp
Electoral Management Design: Revised Edition
2014, 480 pp
Engaging the Electorate: Initiatives to Promote Voter Turnout from Around the World
2006, 139 pp
Electoral System Design: he New International IDEA Handbook
2005, 224 pp
Voter Turnout in Western Europe since 1945: A Regional Report
2004, 92 pp
Voter Turnout Since 1945: A Global Report
2002, 182 pp
International Institute for Democracy and Electoral Assistance (International IDEA)
Strömsborg, SE-103 34 Stockholm, Sweden Tel: +46 8 698 37 00, fax: +46 8 20 24 22
Email: [email protected], website: www.idea.int ISBN 978-91-7671-083-8
Voter turnout is an important indicator of how citizens participate in the governance of their country. Higher voter turnout is often a sign of the vitality of democracy, while lower turnout is usually associated with voter apathy and mistrust of the political process..