Parallel Spatiotemporal Spectral Clustering With Massive Trajectory Data
Y. Z. Gua, K. Qina,b,*, Y. X. Chenc, M. X. Yuea, T. Guoa
a School of Remote Sensing and Information Engineering, Wuhan University, China - (gyz, qink , yuemx)@whu.edu.cn,
Collaborative Innovation Center of Geospatial Technology, Wuhan University, Wuhan, China – [email protected] c
Nanjing University of Posts and Telecommunications, China - [email protected]
Commission IV, WG IV/3
KEY WORDS: Spectral Clustering, Trajectory data, Spatiotemporal Clustering, DTW, Multi-Thread, Urban Computing
ABSTRACT:
Massive trajectory data contains wealth useful information and knowledge. Spectral clustering, which has been shown to be effective in finding clusters, becomes an important clustering approaches in the trajectory data mining. However, the traditional spectral clustering lacks the temporal expansion on the algorithm and limited in its applicability to large-scale problems due to its high computational complexity. This paper presents a parallel spatiotemporal spectral clustering based on multiple acceleration solutions to make the algorithm more effective and efficient, the performance is proved due to the experiment carried out on the massive taxi trajectory dataset in Wuhan city, China.
1. INTRODUCTION
Trajectory data provides an important data source for urban computing and behavior analysis. Massive taxi trajectory data contains much regular knowledge (Wang et al., 2012). The behavior patterns (Das et al., 2016) and travel hotspots can be explored from these data, they provide important supports for urban management and traffic management (Han et al., 2016).
Clustering is a common method in the trajectory data mining (Luxburg et al., 2007), including partitional clustering (Aidos et al., 2012), density-based clustering, hierarchical clustering, spectral clustering etc. There are deal of researches on the first three methods, and the spectral clustering is less yet (Xing et al., 2016).
Spectral clustering is an algorithm based on graph theory, it does not demand the shape of clusters and converges to the global optimum. It has been proved to have good effect for trajectory data (Yan et al., 2009; Cai et al., 2014) and used more frequently in the field of trajectory analysis. However, the researches have a few limitations: traditional spectral clustering method mainly takes into account the spatial relationship of clustering objects, and less in temporal relationship (Díaz et al., 2010). To overcome it, the expansion on time dimension is necessary (Povinelli, 2000).
Trajectory data is an essentially time series data which has different characteristics in structure and length, thus compared with the point data, the clustering of time series data has its complexity. A few methods have been proposed to solve it while the key is finding a way to calculate the spatiotemporal similarity among the time series data. One method is to use the features of time series data, for examples, ARMA model is widely used to extract features of time series data (Cadzow, 1982), Markov chain model is also used to describe time series data (Zheng et al., 2008). Another method is based on the morphological characteristics.
In this paper, we present a spatiotemporal spectral clustering to analyse the time series data in taxi trajectory and discover the spatiotemporal knowledge. We use dynamic time warping method (Silversides et al., 2016) to calculate the spatiotemporal distances among the time series data which have different structures and lengths, and then use Gaussian kernel function to calculate the similarity and put it in the spectral clustering to get the final result. The time series data reflects the change of taxi location in space-time, so the clustering results also includes both spatial and temporal information.
Spectral clustering has low efficiency when deals with massive trajectory data for its high computational complexity (Chen et al., 2007; Birant et al., 2006; Wang et al., 2007). Thus speeding up the spectral clustering is necessary.
In recent years, a series of parallel computing solutions have been developed, such as solutions based on CPU (Song et al., 2007) and GPU, or based on MapReduce and Spark (Xin et al., 2013). Also, some data structures such as R-tree (Mondal et al., 2004) and KD-tree are proposed to speed up the spatial algorithm.
In order to speed up the spatiotemporal spectral clustering, we present a parallel method based on multiple acceleration solutions in this paper. While constructing the similarity matrix and Laplacian matrix, we use a load balanced multi-threading method to parallelize the calculation procedures based on CPU.
We choose CPU to realize the parallelization because it has intuitive effect and doesn’t depends much on hardware environment. Then, in the process of eigenvalue decomposition, we use Lanczos method to accelerate the algorithm.
2. SPATIOTEMPROAL SPECTRAL CLUSTERING 2.1 Basic Spectral Clustering
Spectral clustering is an algorithm based on graph theory. It aims to maximize the similarity in the subgraphs as well as minimize the similarity among the subgraphs by dividing the undirected graph into several optimal subgraphs as shown in Figure 1. There are many variants of spectral clustering, in this paper, we choose a commonly used normalized spectral clustering (Ng et al., 2001).
Figure1. Dividing method for spectral clustering
The principle of spectral clustering is related to mathematical knowledge, it is a process of dimensionality reduction. Given n
data points
x
1,...,
x
n , the spectral clustering constructs a similarity matrixS
where Sij reflects the relationship betweeni
x
andxj.We use Gaussian kernel function to calculateSij:2
Where
σ
refers to the width of Gaussian kernel function which influences the effect of clustering, it is generally set as experimental data. Dij refers to the distance betweenx
iandj
x , it is the vital variable of the spatiotemporal spectral
clustering and we will explain the calculation method later. Laplacian matrix is also an important factor in the algorithm. We define the normalized Laplacian matrix as:
1/ 2 1/ 2
L
= −
I
D
−SD
− (2)Where S refers to the similarity matrix, D is a diagonal matrix, and the calculation method is:
1
The normalized Laplacian matrix is a positive semidefinite matrix, for any vector
f
, it has such mathematic quality:Where
w
i refers to the sum of the weights in the linei
.There are a few methods to cut the graph such as minimum-cut (Fiedler, 1973), ratio-cut (Hagen et al., 2002) and normalized-cut (Shi et al., 2002). In this paper, for co-operating with the chosen Laplacian matrix, we use normalized-cut method, the objective function
ncut A B
( , )
is:It can be deduced that solving the optimal objective function is equal to find the corresponding eigenvector of the second- minimum eigenvalue of the normalized Laplacian matrix L for binary classification.
We can go a step further and conclude that the spectral clustering converts the process of dividing the original data to dividing the eigenvectors-matrix which corresponds to the k -minimum eigenvalue of L. It is essentially a conversion of reducing the features, generally the algorithm uses k-means clustering to realize the final co-clustering (Ng et al., 2002)
2.2 Temporal expansion on spectral clustering
In the formula (1) we can deduce that the important step of the spatiotemporal spectral clustering is calculating the distance between time series data in taxi trajectory. However, different time series data have different spatial and temporal information, thus the distance is difficult to calculate.
In this paper, we use dynamic time warping (DTW) to calculate the spatiotemporal distance between time series data and realize the expansion on the algorithm. Compare with Euclidean distance, DTW is a much more robust distance measure for time series, allowing similar shapes to match even if they are out of phase in the time axis (Keogh et al., 2005)
Figure2. Sketch of Euclidean and DTW.
While the two time series (a, b) have different length, Euclidean distance, which only calculate the coincident part, will perform a bad effect. Dynamic time warping can stretch the series and allow a more robust measure.
In this paper. We use DTW to measure the different time series data in taxi trajectory and realize the spatiotemporal spectral clustering. Suppose we have two taxi track Q and C, of length n
and m, obviously they are time series data:
,
,..., ,...,
Where
q
i is the taxi trajectory point which contains spatial (longitude and latitude) and temporal information. The distance betweenq
iand cjcan be calculate by this information. Because the different length of Q and C, using Euclidean distance is difficult to measure to distance. To align the sequences by DTW, we construct an n-by-m matrix. Each matrix element (i j
,
) corresponding to the distance betweenq
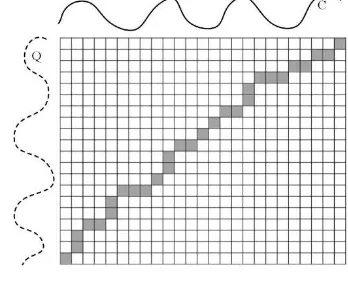
iandcj. A warping path W is contiguous set of matrix elements that defines a mapping between Q and C: finish in diagonally opposite corner cells of the matrix like figure 3.Figure 3: Calculate method of DTW.
The n-by-m warping matrix constructed to align the taxi track Q
and C, while the solid squares show the chosen warping path W. Obviously there are few paths meet the requirements. In the DTW, we choose the path which minimizes the warping cost. And the cost is defined as:
k 1
We use dynamic programming to find the optimal path, which defines
v i j
( , )
as the cost of the optimal path fromi
toj
, thusv
(1, )
k
is equal to the minimum cost of Q and C.( , ) ( ,i j) min( ( 1, ), ( , 1), ( 1, 1)) v i j =d q c + v i− j v i j− v i− j− (9) The distance between taxi track Q and C can finally be obtained after the dynamic programming. Thus we can evaluate Dij in
the formula (1) and realize the spatiotemporal spectral clustering of the time series data in taxi trajectory.
3. PARALLEL SPATIOTEMPORAL SPECTRAL CLUSTERING
In this paper, we propose a parallel method based on multiple acceleration solutions, while constructing the similarity matrix and Laplacian matrix, we use a load balanced multi-threading method to parallelize, and in the eigenvalue decomposition, we use the lanczos method to accelerate the algorithm.
3.1 Constructing Similarity Matrix
The similarity matrix is an n-by-n matrix, each matrix element (
,
i j
) refers to the similarity of time seriesi
andj
by calculating the DTW distance betweeni
andj
:2
( , )
exp( )
2
ij
DTW i j S
σ
= − (10)
Using DTW to measure the distance will cost much time and it is necessary to accelerate the process. From formula (10) we can deduce that the process of calculating each element of the whole similarity matrix is independent thus we can assign the task to different threads and realize the parallelization.
Figure 4. Multi-thread solution for constructing similarity matrix
The similarity matrix is a symmetric matrix, and we just need to calculate half of the matrix (white part in figure 4). The computation can be divided into n task with different volume, we can assign the tasks to few threads on average.
General multi-threading method splits the tasks continuously and put the task into a thread, however, the volume of each task is different and it leads to the load imbalances on threads. Multi-threading programming blocks until every thread finishes its task, thus the time cost of is equal to the slowest thread.
In this paper, we use a load balanced multi-threading method. The method splits the tasks in fixed intervals and put them into thread. Each thread costs roughly same time because of the balanced load on it. And the whole multi-threading programming will cost less time obviously.
Figure 5. The diagram of general multi-threading and load balanced multi-threading.
3.2 Constructing Laplacian Matrix
The Laplacian matrix is calculated by subtraction of two matrix (formula 2). Alike to the similarity matrix, the computation on each element is independent and we can directly assign them to the different thread.
Figure 6. Multi-thread solution for constructing Laplacian matrix
The method converts the subtraction of the matrix to the subtraction of each row on its thread to realize the parallelization of constructing the Laplacian matrix.
3.3 Laplacian Matrix Eigenvalue Decomposition By decomposing the Laplacian matrix and obtaining the eigenvectors which correspond to the top k-minimum eigenvalues, spectral clustering could get the clustering results after further processing.
When dealing with the massive taxi trajectory, the Laplacian matrix is usually a large-scale matrix, and it will take lots of time to decompose the matrix and obtain its eigenvalues and eigenvectors.
It is worth noting that the Laplacian matrix is a real symmetric matrix and another point is that we only need to obtain the top k-minimum eigenvalues not all eigenvalues. In this paper, we use Lanzcos method to accelerate decomposing the Laplacian matrix.
Symmetric matrix have special data structures, and its eigenvalue’s decomposition method is an important problem in numerical computation. Lanczos method is suitable for calculating the top k-maximum and top k-minimum eigenvalue problems of large-scale symmetric matrix (Sonneveld, 2006).
the maximum and minimum eigenvalue of
T
k will be closer to the maximum and minimum eigenvalue of the Laplacian matrix L.The matrix
T
k can be calculated as:T
k k k
T = V LV (11)
Where
V
k is an orthogonal matrix, andV
k=
[ ,
v v
1 2,...,
v
k]
.T
k is a tridiagonal matrix:1 1 1 2
1
1
k
k
k k
T
α β
β α
β
β
−α
−
=
(12)
Lanzocs method uses Lanzocs iteration (Duchon 1979) to determine the value of
T
k and uses its eigenvalues to approximate the eigenvalues of Laplaican matrix.4. EXPERIMENT 4.1 Experiment Data
In this paper, we use the taxi trajectory data of Wuhan city of Hubei Province in China in 2015 to carry out the experiment. The data consists of car ID, latitude, longitude, speed and time information, it is collected by hundreds of taxi and upload every 10 second.
The dataset contains abundant spatial and temporal information.
The original trajectory data contains a bit of error, thus we first carry out the data cleaning, the methods includes outlier elimination, road network matching and so on.
4.2 Experiment Environment
The experiment is carried out to validate the quality and the performance of the presented method, the main environment configuration is set as:
Processor: Inter(R) Xeon CPU E5-2630 v3 @ 2.4GHz Memory: 64GB
The whole programming (including data process and algorithm) is written by Java and runs in JVM heap. The jdk version chosen in the programming is jdk8. ArcMap software is used to display the result of clustering.
4.3 Clustering Results
The spatiotemporal spectral clustering presented in this paper uses the dynamic time warping method to correct the spatial distortions caused by time problems and obtain the spatiotemporal distance. The effect of clustering is checked by experiment.
In the experiment, we carried out spectral clustering on trajectories of the different taxis that have the same starting point and destination point on the same day, in order to mine the
different route pattern from the selected starting point to destination point.
We chose two different routes to operate the experiment, namely, from Wuchang Railway Station to WuHan Railway Station in Wuhan City, and from Wuchang Railway Station in Wuhan to Guanggu Square in Wuhan City.
Firstly, the DTW method is used to calculate the spatiotemporal similarity between different trajectories, and the spatiotemporal similarity matrix between them is plotted:
Figure7. The diagram of spatiotemporal similarity matrix
Where (a) represents the result matrix from Wuchang Railway Station to Wuhan Railway Station while (b) represents the matrix from Wuchang Railway Station to Guanggu Square, and the depth of color represents the value of distance.
Then, the spatiotemporal spectral clustering method is used to cluster the trajectories, and the clustering results are displayed on ArcMap.
Figure9: The clustering results of the trajectories from Wuchang Railway Station to Guanggu Square.
Figure8 and figure9 show that the spectral clustering method proposed in this paper considers both time and space factors, and the clustering result is basically based on the spatial similarity. From the clustering result, we can find the different patterns on the routes.
4.4 Runtime and Speedup
We use the dataset to calculate the runtime of original spectral algorithm and parallel spectral algorithm, according to that we calculate the speedup.
In the experiment, we split the whole algorithm and count the runtime and the speedup of the part of multi-thread acceleration and eigenvalues decomposition acceleration respectively.
Firstly we analysis the part of multi-thread acceleration, we adopt Java to implement it for its low encapsulation in multi-thread, thus we can dispatch the resource in CPU and memory flexibly. While implementing, we use the thread pool technology of Java to optimize the whole process, thread pool technology unified management of each thread, avoids the opening and destruction of each thread and saves a great deal of the time cost (Weij et al., 2009).
The part of multi-thread acceleration includes similarity matrix construction and Laplacian matrix construction. The two parts are unitedly calculated and counted in order to make the statistics more intuitive,
We count the runtime of original spectral algorithm and parallel spectral algorithm on same dataset (20000 lines) and compare the speedup with different number of threads.
Threads Time (Sec) Speedup
2 26.707 1.51
Tabel1: Speedup comparison for different number of threads in similarity and Laplacian matrix construction.
Figure10. Runtime and speedup for different number of threads in similarity and Laplacian matrix construction.
We choose the thread that has the best performance in figure 10 (100) to count the runtime and speedup on different size of dataset.
Data(line) O-Time(Sec) P-Time (Sec) Speedup
1000 0.132 0.078 1.69
Tabel2. Speedup comparison for different size of dataset in similarity and Laplacian matrix construction.
In table2, O-Time represents the runtime of original spectral method while P-Time represents the parallel method.
Figure11. Speedup for different size of dataset in similarity and Laplacian matrix construction.
Then we validate the performance of the part of eigenvalues decomposition in our algorithm.
We compare the Lanczos method with a classical fast eigen decomposition software which names LAPACK. LAPACK is a high performance linear algebra computing library written by Fortran. LAPACK is widely used in eigen problems and it is one of the underlying algorithms Library in MATLAB and Spark (Demmel et al., 2009).
0
1000 2000 5000 10000 20000 40000
S
In the experiment, we compare the runtime of Lanczos and LAPACK on the same datasets and calculate the speedup using Lanczos (k = 10).
Tabel3: Runtime and speedup comparison for Lanczos and LAPACK.
Figure12. Runtime and speedup comparison for Lanczos and LAPACK.
Tabel3 and figure12 show that in the normal size dataset, Lanczos performs is closed to LAPACK while in the large size dataset, Lanczos performs well.
Finally, we count the runtime and speedup on the whole parallel spatiotemporal clustering algorithm.
Data(line) 0-Time(Sec) P-Time (Sec) Speedup
1000 1.573 1.582 0.99
Tabel4: Runtime and speedup comparison on the whole parallel algorithm for different size of dataset.
Figure13. Speedup comparison on the whole parallel algorithm for different size of dataset.
5. CONCLISION AND FURTURE WORK This paper presents a parallel spatiotemporal spectral clustering to cluster the trajectory data effective and efficient. The important principles and procedures of the algorithm are introduced in the paper like DTW and Lanczos. The experiment is carried out in Wuhan city, China and it show that our parallel spatiotemporal spectral clustering performs well on the real dataset and actually accelerate the algorithm especially on the large dataset.
The presented method still has some limitations, though it considers time and space factors by DTW, it mainly correct the spatial distortions caused by time problems and the research on temporal expansion of spectral clustering is not enough yet. In the later research, we will continue to research the spatiotemporal expansion of spectral clustering methods, and explore more effective spatiotemporal spectral clustering methods. Meanwhile, the application of trajectory clustering results with the related problems should be further studied.
ACKNOWLEDGEMENTS
This research is partial funded by the National Key Research and Development Program of China (No. 2017YFB0503604), National Natural Science Foundation of China (No. 41471326).
REFERENCES
Wang, Z., Li, M., Wang, L., & Liu, X., 2013. Estimation trajectory of the low-frequency floating car considering the traffic control. Mathematical Problems in Engineering, (1), pp. 1-11.
Das, R. D., & Winter, S., 2016. Detecting urban transport modes using a hybrid knowledge driven framework from GPS trajectory. International Journal of Geo-Information, 5(207), pp. 1-25.
Han, B., Wang, Z., & Jin, B., 2016. An anomaly detection algorithm for taxis based on trajectory data mining and online real-time monitoring. Journal of University of Science &
Technology of China, 46(3), pp. 247-252.
Luxburg, U. V., 2007. A tutorial on spectral clustering.
Statistics and Computing, 17(4), 395-416.
Aidos, H., & Fred, A., 2012. Statistical modeling of dissimilarity increments for d-dimensional data: application in partitional clustering. Pattern Recognition, 45(9), 3061–3071.
Fu, C., Chen, H., & Xing, J., 2011. Spectral Clustering and its Research Progress. In: Seventh International Conference on
Computational Intelligence and Security, pp.1367-1369.
Yan, D., Huang, L., & Jordan, M. I., 2009. Fast approximate spectral clustering. In: ACM SIGKDD International Conference
on Knowledge Discovery and Data Mining, pp.907-916.
Cai, D., & Chen, X., 2015. Large scale spectral clustering via landmark-based sparse representation. IEEE Transactions on
Cybernetics, 45(8), 1669.
Díaz, S. P., & Vilar, J. A., 2010. Comparing several parametric and nonparametric approaches to time series clustering: a simulation study. Journal of Classification, 27(3), pp. 333-362. 0
1000 2000 5000 10000 20000 40000
Povinelli, R. J., 2000. Time series data mining: identifying temporal patterns for characterization and prediction of time series events. Marquette University. pp. 46-61.
Cadzow, J. A., 1982. Arma modeling of time series. IEEE
Transactions on Pattern Analysis & Machine Intelligence, 4(2),
pp. 124-8.
Zheng, Y., & Zhu, J., 2008. Markov chain monte carlo for a spatial-temporal autologistic regression model. Journal of
Computational & Graphical Statistics, 17(1), pp. 123-137.
Chen, Y., Nascimento, M. A., Ooi, B. C., & Tung, A. K. H., 2007. SpADe: On Shape-based Pattern Detection in Streaming Time Series. In: IEEE International Conference on Data
Engineering, pp.786-795.
Birant, D., & Kut, A., 2006. Spatio-temporal outlier detection in large databases. In: International Conference on Information
Technology Interfaces, Vol.14, pp.179-184.
Xin, R. S., Gonzalez, J. E., Franklin, M. J., & Stoica, I., 2013. GraphX: a resilient distributed graph system on Spark.
International Workshop on Graph Data Management
Experiences and Systems, p. 2.
Mondal, A., Yi, L., & Kitsuregawa, M., 2004. P2PR-Tree: An R-Tree-Based Spatial Index for Peer-to-Peer Environments. In:
International Conference on Current Trends in Database
Technology, Vol.3268, pp. 516-525.
Silversides, K. L., Melkumyan, A., & Wyman, D., 2016. Fusing gaussian processes and dynamic time warping for improved natural gamma signal classification. Mathematical Geosciences, 48(2), pp. 187-210.
Fiedler, M., 1973. Algebraic connectivity of graphs.
Czechoslovak Mathematical Journal, 23(23), pp. 298-305.
Hagen, L., & Kahng, A. B., 2002. New spectral methods for ratio cut partitioning and clustering. IEEE Transactions on
Computer-Aided Design of Integrated Circuits and Systems,
11(9), pp. 1074-1085.
Shi, J., & Malik, J., 2002. Normalized cuts and image segmentation. IEEE Transactions on Pattern Analysis &
Machine Intelligence, 22(8), pp. 888-905.
Ng, A. Y., Jordan, M. I., & Weiss, Y., 2002. On spectral clustering: analysis and an algorithm. Proceedings of Advances
in Neural Information Processing Systems, 14, pp. 849--856.
Keogh, E., & Ratanamahatana, C. A., 2005., Exact indexing of dynamic time warping. Knowledge and Information Systems, 7(3), pp. 358-386.
Sonneveld, P., 2006., Cgs, a fast lanczos-type solver for nonsymmetric linear systems. Siam Journal on Scientific &
Statistical Computing, 10(1), pp. 36-52.
Duchon, C. E., 1979. Lanczos filtering in one and two dimensions. Journal of Applied Meteorology, 18(8), pp. 1016-1022.
Weij, W. V. D., Bhulai, S., & Mei, R. V. D. 2009. Dynamic thread assignment in web server performance optimization.
Performance Evaluation, 66(6), pp. 301-310.