Built-up area and land cover extraction
using high resolution Pleiades Satellite Imagery for Midrand, in Gauteng Province, South Africa E Fundisia and W Musakwab
a
Department of Geography, Environmental Management and Energy Studies, University of Johannesburg, South [email protected]
b
Department of Town and Regional Planning, University of Johannesburg, Doornfontein, Doornfontein, Johannesburg, South Africa [email protected]
Commission IV, WG IV/3
Key Words land cover, built-up, urban, Pleiades, earth observation, South Africa
Abstract:
Urban areas, particularly in developing countries face immense challenges such as climate change, poverty, lack of resources poor land use management systems, and week environmental management practices. Mitigating against these challenges is often hampered by lack of data on urban expansion, urban footprint and land cover. To support the recently adopted new urban agenda 2030 there is need for the provision of information to support decision making in the urban areas. Earth observation has been identified as a tool to foster sustainable urban planning and smarter cities as recognized by the new urban agenda, because it is a solution to unavailability of data. Accordingly, this study uses high resolution EO data Pleiades satellite imagery to map and document land cover for the rapidly expanding area of Midrand in Johannesburg, South Africa. An unsupervised land cover classification of the Pleiades satellite imagery was carried out using ENVI software, whereas NDVI was derived using ArcGIS software. The land cover had an accuracy of 85% that is highly adequate to document the land cover in Midrand. The results are useful because it provides a highly accurate land cover and NDVI datasets at localised spatial scale that can be used to support land use management strategies within Midrand and the City of Johannesburg South Africa.
1 INTRODUCTION
Urban areas are places that provide their residents with a relatively high quality of life in terms of housing, services, employment and consumption (Pfeffer et al, 2010). Land use modification taking place urban areas transforms the natural landscape significantly, and forms new habitats and ecosystems that are different from the natural set up (Robinson, 2006). Expansion of the economic base such as, higher per capita income and an increase in number of working persons creates demand for new buildings, infrastructure and housing (Paek, 2006). Such expansion in response to the continued increase need of land utilisation triggered by population agglomeration and societal needs encourages many developers to rapidly construct new houses and infrastructure (Bhatta, 2010). Urban growth in African cities is often coupled with rising poverty, whose nature is not adequately captured by a simple urban-rural dichotomy (Coulter et al, 2016). In the face of rapid urbanisation African cities often lack the data and capacity to document the rapid urban change. Use is often made of field-based monitoring or urban change, which is considered accurate, it is generally inefficient, expensive and time consuming for assessment of areas with a large spatial extent.
Earth observation (EO) techniques in contrast, provide information in a short period of time and allow for analysis of data over complex landscapes at a relatively low cost (Coulter et al, 2016). Urban mapping increasingly relies on the use of EO through the development of objective, automated and replicable methodologies for the identification of human-induced
land covers(Musakwa and Van Niekerk, 2013). The physical characteristics of urban places generate spatial and spectral signatures that are readily captured through
EO data. EO and Geographic Information Systems (GIS) have the potential to provide accurate information regarding land use and land cover changes (Musakwa and Van Niekerk, 2015). Urban land cover mapping and analysis can be facilitated through the use and interpretation of multispectral EO data (Lilles and and Kiefer, 1994). There is therefore the need to utilize a better resolution remote sensing to represent localised variabilities. The study aimed to investigate the contribution of high spatial resolution multispectral Pleiades images in land cover mapping. The objective of this paper was to investigate the effect of spatial resolution of EO data on discrimination of built up area and other land cover. This study therefore provides an important indication on the performance of high spatial resolution Pleiades data for the separation of built up area and different land cover.
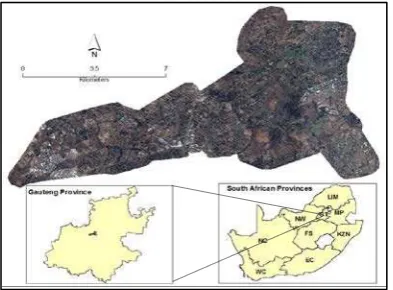
2 STUDY AREA
temperatures for Midrand range from 17.2°C in June to 26.8°C in January. The region is the coldest during July when the temperature drops to 1.1°C on average during the night.
Figure 1: Location of Midrand, Gauteng province, South Africa
3 METHODOLOGY
3.1 Data description
Pleiades data for May 2015 that covers a section of Midrand and stretches to Fourways was utilised for conducting land cover classification. The Pleiades satellite imagery provides orthorectified colour data at very high spatial resolution. The satellite is capable of acquiring high spatial resolution stereo imagery in just one pass. The Pleiades satellite features four spectral bands (blue, green, red, and infrared (IR)), as well as image location accuracy of 3 meters without ground control points (Table 1). Image location accuracy can be improved even further up to an exceptional 1 meter by the use of ground control points (GCPs).
Bands* Spatial
Table 1: Pleiades bands and specifications
Two hundred samples where distributed in the study area (Figure 2). The sample design was established using the random point creation tool in ArcGIS. This allowed for sufficient representation of land cover classes used in the localised study area. Each member of the determined land cover classes had an equal chance of being selected as part of the sample. It should be noted that this design removes any bias from the selection procedure and resulted in equal representative of samples.
3.2 Land cover classification
ENVI software was used to conduct the pixel-based classification of the Pleiades imagery. The overall goal of image classification procedure is to automatically categorise all pixels in an image into discrete land cover classes or themes (Lillesand et al, 2008; Newman et al, 2011). A number of classification techniques are available to the remote sensing community; these include, among others, supervised (Winston, 1975), unsupervised (Tou and Gonzalez, 1974), artificial neural networks (McClellan et al, 1989), support vector machines (Cortes and Vapnik, 1995) and random forest (Breiman, 2001). Specifically, a combination of Iterative Self Organizing Data Analysis Technique (ISODATA) and unsupervised classification approach were used to classify the multispectral images. The algorithm separates all cells into distinct user-specified groups in the multidimensional space of the input bands (Im and Jensen, 2005). This classification approach was adopted for this study, because it allows spectral clusters to be identified with a high degree of objectivity. In addition, the method does not require in-depth, prior knowledge about the land cover types present in the area. This allows setting a fairly large number of classes that can subsequently be reduced to fewer classes depending on the variability present in the area of interest (Lillesand et al, 2008).
The land cover type that each point falls on was recorded from the Google earth imagery. These land cover types were approximated according to Thompson (1996) that standardised land cover types for the purpose of interpreting remotely sensed data. The standard classification system was modified by merging structurally similar land cover types so as to suit the land cover types of the study area (Table 2). Twenty-four classes were created initially and subsequently reduced to four classes (woodland, grassland, impervious surface and water) by merging structurally similar land cover types through interpretations. The land cover types used by Thompson (1996) and merged in this study are presented in (Table 2).
Land cover class Class definition
Woodland Forest plantations,
Woodland, Thicket
Bush land, Scrub forest, Shrub land
Grassland Unimproved grassland
Improved grassland
Impervious Surface Bare rock/ Soil, Built up land
Bare land Degraded land, Soil
Water Water
Table 2: Land cover classes defined for the study area
grassland either indigenous or exotic species growing under man-managed conditions. Bare rock/soil includes natural areas of exposed soil with little vegetation whereas degraded soil includes permanent or seasonal man-induced areas of low vegetation cover. Built up land cover areas include settlement areas and man-made structures therein. Note that this was not included in the bare land class of Thompson (1996); it was however included for this study since it has spectral properties similar to impervious surfaces. Water bodies refer to areas of generally open water; either natural or man-made water bodies or this was classified under water.
Different band combinations such as false colour combination (infrared, red and green) and natural colour combination (red, green and blue) were used as references in the interpretation process of the classified data. This is a standard remote sensing method used in interpretation of land cover classes, and was used in different studies (e.g. Adia, 2008; Campbell and Wynne, 2011; Mirik and Ansley, 2012; and Nguyen et al, 2015). This approach was adopted to visualise point features and its surrounding features, for a more convincing interpretation of land cover classes.
3.3 Deriving Normalized Difference Vegetation Index (NDVI
ArcGIS software was used to derive the NDVI from the bands in the Pleiades imagery. The raster calculator tool in ArcGIS was used to derive the NDVI. After calculation the index was reclassified so that it acquired values of between 1 to 10. The index uses the principle that healthy vegetation absorbs most of the visible light that strikes it, and reflects a large portion of the near-infrared light (Rouse et al, 1973). In contrast, unhealthy or sparse vegetation reflects more visible light and less near-infrared light.
Impervious surfaces on the other hand reflect fairly equally in both the red and infrared portion of the electromagnetic spectrum (Holme et al, 1987). Hence impervious surfaces had values closer to one while grassland and woodland hand values closer to 10.
3.4 Accuracy assessment
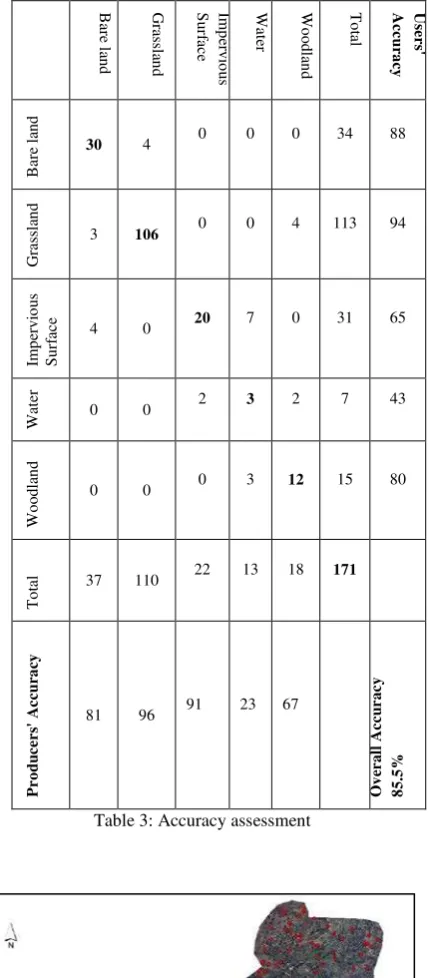
The study made use of Google earth high spatial resolution imagery in order to validate the accuracy of the classification. This is a standard procedure, which is used for land cover mapping (Benza et al, 2016; Qi et al, 2016; Hu et al, 2013; Gong et al, 2013). The imagery used was for the same year with Pleiades satellite imagery (May 2015) in order to relate reference data and the classification. All accuracies were assessed using the total number of points, which were established (Figure 2). An error matrix, which is a standard classification assessment method, was used to evaluate each classified product (Congalton and Green, 2009). The method uses statistics such as overall accuracy, producer’s accuracy, user’s accuracy and kappa coefficients to determine the quality of classified data (Table 3) (Story and Congalton, 1986).
Table 3 shows that the overall accuracy assessment is 85 %, which shows that the results are reliable. Such high accuracies are necessary if the results are to be used to make decisions in urban planning
Table 3: Accuracy assessment
Figure 2: Illustration of sample distribution of accuracy assessment points in the study area
4 RESULTS AND DISCUSSION 4.1 Accuracy of land cover classification
Accuracies of classification derived from Pleiades image are presented in (Table 3). The overall classification accuracy was 85.5% and the Kappa Co-efficient was 0.77. Grassland had the highest user’s accuracy followed by bare land, woodland, impervious surface and then water with the lowest user’s accuracy. Producer’s accuracy showed that grassland was highest followed by impervious surface, bare land, woodland and then water class with the lowest producer’s accuracy. The classification results presented show that the majority of the study area was covered in grassland with 54% of the study area (Figure 3. This was followed by bare land with the coverage of 18% of the study area. Impervious surface had a total coverage of 12 % of the study area, followed by woodland with 10%. Water had the lowest coverage with 4% of the study area. Impervious area spatial distribution shows that it is formed in clusters around the study area. Moreover it is mostly found in the middle of the study area and South East part of the study area. The woodland class is mostly distributed on the middle part of the study area.Impervious surface had a total coverage of 12 % of the study area, followed by woodland with 10%. Water had the lowest coverage with 4% of the study area. In addition, grassland is spatially distributed across the entire study area.
Figure 3: Land cover classes
Figure 4 shows sketches of areas extracted from the high spatial resolution Pleiades data and the corresponding area from the classified image (Figure 5. A closer look at the classified image (Figure 4a) shows an area where there was water class. This was correctly captured as water from the corresponding image (Figure 5a). Figure 5b shows that building shadows where incorrectly classified as water class, relating to Figure 4b. Figure 4c shows high-resolution extract representing building roofs. It should be noted that this area was incorrectly classified as grassland (Figure 5c). In addition there are some areas where woodland classification has been underestimated and the classification being confused as grassland. Most importantly water class is largely confused with both woodland as well as the shadows of the buildings (Figures 4 and 5).
Figure 4: Selected extracts from high spatial resolution Pleiades data: (a) area showing water; (b) area showing shadows of buildings; (c) area showing roof of a building
Figure 5: Corresponding classifications derived from figure 3 of the high spatial resolution Pleiades image (a) area showing water; (b) area showing shadows of buildings; (c) area showing roof of a building
4.2 Discussion
The study intended to investigate the effect of spatial resolution of remotely sensed data on discrimination of built up area and other land cover classes. The overall classification accuracy was 85%, which is acceptable. Both producer’s and user’s accuracy for grassland class presented higher individual classification accuracies of 96% and 94% accordingly (Table 3). These higher accuracies can be due to the performance of high spatial resolution of the dataset used in the study. High spatial resolution imagery enables clear representation of features resulting in more accurate image classification (Johnson et al, 2013). This is consistent with various studies, which used other high spatial-resolution imagery to map land cover classes in an urban environment (Li and Sha, 2014; Johnson, 2013; Hussain and Shan, 2016). Mancino et al (2013) assessed land cover change using Landsat imagery and NDVI. 200 random sample points were established in the study area. Although the study achieved a relatively high accuracy (92%), course spatial resolution of the imagery used might have affected classification accuracy due to mixed pixel problem. There is room for improvement on land cover assessments utilising high spatial resolution data in combination with large (dense) sample sizes to avoid generic classification of land cover which contributes to inaccuracies. However water class achieved the lowest individual accuracies (producer’s 23% and user’s 43%). The classification product showed both high error of omission and error of commission (Table 3). A closer look at the classification product shows that shadows of the buildings are misrepresented as water class, which could have affected the overall classification accuracy.
(a)
(b)
(c)
(a)
(b)
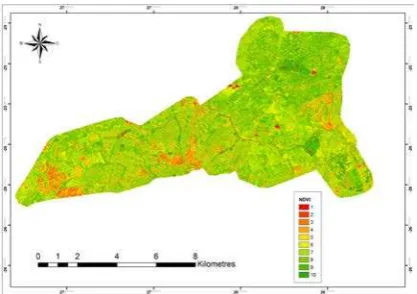
Reflectance characteristics of individual land cover classes show significant variation, and spectral properties are less suitable for land cover identification (Chen et al, 2009). Shadows reduce the spectral values of the objects or even total loss of spectral information (Lu et al, 2010), thus influencing the land-cover classification as water. This high spectral variation makes classification much more difficult than might otherwise be anticipated. In addition to that water class is also confused with woodland class, where woodland classes were misrepresented as water. Accordingly, the NDVI utility was utilised in order to discriminate between vegetation and other classes. The extract from the study area shows that NDVI performed better where there was confusion between woodland and water (Figure 6).
Figure 6: Illustration of NDVI derived classification for the study area
The classification provides a mechanisms where land cover and land uses can be described in urban areas in urban areas, particularly in developing countries where such data is often unavailable (Musakwa & Niekerk, 2013) The classification is therefore a means of providing up-up-to-date information on land cover and land use that municipalities often do not posses. Pleiades with its high resolution is therefore a good source to derive land cover classification in urban areas, which often require high accuracies.
5 CONCLUSION
The study investigated the use of Pleiades imagery in land cover imagery. The resultant classification revealed a high overall accuracy of 85%. However due to spectral reflectance water and woodland classes had the lowest accuracies. The NDVI was derived as a solution to remedy the remedy the low accuracies. Pleiades land cover classification demonstrated that it is a useful source of land cover classification to derive the urban landscape in South Africa. However the low accuracies obtained from water and woodland classes need to be resolved if the data is to be more usable.
REFERENCES
Alqurashi, A. and Kumar, L. (2013). Investigating the use of remote sensing and GIS techniques to detect land use and land cover change: a review. Advances in Remote Sensing. 2: 193-204.
Benza, M., Weeks, J. R., Stow, D. A., López-Carr, D. and Clarke, K. C. (2016). A pattern-based definition of urban context using remote sensing and GIS. Remote Sensing of Environment. 183: 250-264.
Bhatta, B. (2010). Analysis of urban growth and sprawl from remote sensing data. Advances in Geographic Information Science. 6: 340‒356.
Chen, Y., Su, W., Li, J., and Sun, Z.(2009) Hierarchical object oriented classification using very high resolution imagery and LiDAR data over urban areas. Advances in Space Research. 43: 1101 - 1110.
Congalton, R. G. and Green, K. (2009). Assessing the accuracy of remotely sensed data: Principles and practices. 2nd Ed. Boca Raton. Florida. CRC Press. p. 210.
Coulter, L. L., Stow, D. A., Tsai, Y. H., Ibanez, N., Shih, H. C., Kerr, A. and Mensah, F. (2016). Classification and assessment of land cover and land use change in southern Ghana using dense stacks of Landsat 7 ETM+ imagery. Remote Sensing of Environment, 184, 396-409.
Duque de Pinho, C. M., Fonseca, L, M. G., Korting, T. S., Maria de Almeida, M. and Kux, H, J, H. (2012) Landcover classification of an intra-urban environment using high-resolution images and object based image analysis. International Journal of Remote Sensing. 33: 5973-5995.
Gong, P., Wang, J., Yu, L., Zhao, Y., Zhao, Y., Liang, L. and Li, C. (2013). Finer resolution observation and monitoring of global land cover: First mapping results with Landsat TM and ETM+ data. International Journal of Remote Sensing. 34: 2607-2654.
Holme, A., Burnside, D. G. and Mitchell, A. A. (1987). The development of a system for monitoring trend in range condition in the arid shrubland of Western Australia. Australian Rangeland Journal. 9: 14‒20.
Hu, Q., Wu, W., Xia, T., Yu, Q., Yang, P., Li, Z., and Song, Q. (2013). Exploring the use of Google Earth imagery and object-based methods in land use/cover mapping. Remote Sensing. 5: 6026-6042.
Hussain, E. and Shan, J. (2016). Object-based urban land cover classification using rule inheritance over very high-resolution multisensor and multitemporal data. GIScience and Remote Sensing. 2: 164-182.
Johnson, B. A. (2013). High-resolution urban land-cover classification using a competitive multi-scale object-based approach. Remote Sensing Letters. 4: 131-140.
County Scale in Midwestern USA. Remote Sensing. 6: 11372-11390.
Lillesand, T. M., Kiefer, R. W. and Chipman, J. (2008). Remote sensing and image interpretation. 6th Ed. New York. John Wiley and Sons.
Lu, D., Hetrick, S., and Moran, E. (2010). Land cover classification in a complex urban-rural landscape with QuickBird imagery. Photogrammetric Engineering and Remote Sensing. 10: 1159-1168.
Mancino, G., Nole, A., Ripullone, F. and Ferrara, A. (2013). Landsat TM imagery and NDVI differencing to detect vegetation change: assessing natural forest expansion in Basilicata, Southern Italy. IForest. 7: 75-84.
Musakwa, W., & Niekerk, A. V. (2013). Implications of land use change for the sustainability of urban areas: A case study of Stellenbosch, South Africa. Cities, 32, 143-156. doi:10.1016/j.cities.2013.01.004
Musakwa, W., & Van Niekerk, A. (2015). Monitoring sustainable urban development using built-up area indicators: a case study of Stellenbosch, South Africa. Environment, Development and Sustainability, 17(3), 547-566. doi:10.1007/s10668-014-9560-7
Paek, S. (2006). Urban growth pattern and sustainable development: a comparative study of municipalities in the Seoul metropolitan region. PhD Dissertation. Texas University. 230 pp.
Pfeffer, K., Baud, I., Denis, E., Scott, D. and Sydenstricker, J. (2010). Assessing and exploring the state of urban knowledge - its production, use and dissemination in cities of the South. 45 pp.
Robinson, J. (2006). Ordinary cities: between modernity and development. Rout Ledge. New York. 200 pp.
Qi, F., Zhai, J. Z., and Dang, G. (2016). Building height estimation using Google Earth. Energy and Buildings. 118: 123-132.
Rouse, J. W., Haas R. H., Schell, J. A. and Deering, D. W. (1973). Monitoring vegetation systems in the Great Plains with ERTS, Third ERTS Symposium. NASA. 309‒317.
Thompson, M. (1996). A standard land-cover classification scheme for remote-sensing applications in South Africa. South African Journal of Science, 92(1), 34-42.