Data Sources: Ministries of Health in SEAR Countries.
Published by
Immunization & Vaccine Development
, World Health Organization, Regional Office for South-East Asia, New Delhi
–
110002, India
Tel: 91-11-2337-0804 / 91-11-4304-0000 Fax: 91-11-2337-0251 / 0106 E-mail: [email protected], URL:
http://www.searo.who.int/topics/immunization/
Vol. 22, Week 02, 2018
Published 15 January 2018
Meetings/ Important events:
Regional Working Group Meeting on Immunization, New Delhi, India, 28-30 January 2018
Lessons from the Big Six- Closing the Immunity Gap for Measles Elimination and Rubella/ CRS control, New Delhi, India, 31 January-02
February 2018
Table 1: Measles & Rubella Laboratory Supported Case-based Surveillance Performance Indicators by Country, 2017* (data as of 15 January 2018)
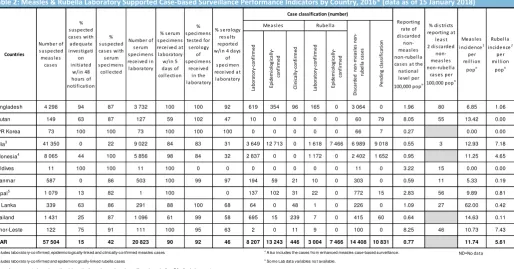
Table 2: Measles & Rubella Laboratory Supported Case-based Surveillance Performance Indicators by Country, 2016* (data as of 15 January 2018)
La
b
o
ra
to
ry
-c
o
n
fi
rm
e
d
E
p
id
e
m
io
lo
g
ic
a
ll
y-co
n
fi
rm
e
d
C
li
n
ic
a
ll
y-co
n
fi
rm
e
d
La
b
o
ra
to
ry
-c
o
n
fi
rm
e
d
E
p
id
e
m
io
lo
g
ic
a
ll
y-co
n
fi
rm
e
d
Bangladesh 4 298 94 87 3 732 100 100 92 619 354 96 165 0 3 064 0 1.96 80 6.85 1.06
Bhutan 149 63 87 127 59 102 47 10 0 0 0 0 60 79 8.05 55 13.42 0.00
DPR Korea 73 100 100 73 100 100 100 0 0 0 0 0 66 7 0.27 0.00 0.00
India3 41 350 0 22 9 022 84 83 31 3 649 12 713 0 1 618 7 466 6 989 9 018 0.55 3 12.93 7.18
Indonesia4
8 065 44 100 5 856 98 84 32 2 837 0 0 1 172 0 2 402 1 652 0.95 11.25 4.65
Maldives 11 100 100 11 100 0 0 0 0 0 0 0 11 0 3.22 15 0.00 0.00
Myanmar 587 0 86 503 100 99 97 194 59 21 10 0 303 0 0.59 11 5.33 0.19
Nepal5 1 079 13 82 1 100 0 137 102 31 22 0 772 15 2.83 56 9.89 0.81
Sri Lanka 339 63 86 291 88 100 68 64 0 48 1 0 226 0 1.09 27 62.00 0.42
Thailand 1 431 25 87 1 096 61 99 58 695 15 239 7 0 415 60 0.64 14.63 0.11
Timor-Leste 122 75 91 111 100 95 63 2 0 11 9 0 100 0 8.25 46 10.73 7.43
SEAR 57 504 15 42 20 823 90 92 46 8 207 13 243 446 3 004 7 466 14 408 10 831 0.77 11.74 5.61
1
Includes labo rato ry-co nfirmed, epidemio lo gically-linked and clinically-co nfirmed measles cases 4
A lso includes the cases fro m enhanced measles case-based surveillance. ND=No data
2
Includes labo rato ry-co nfirmed and epidemio lo gically-linked rubella cases 5
So me Lab data variables no t available.
3 Cases fro m suspected measles o utbreak investigatio n o nly, case based surveillance is gradually exCA nding in the co untry
* Figures in the table 2 are restricted to availability of various dates required for calculation. Thus they may not adequately reflect cases with missing dates for various timelines.
Countries
Number of s us pected mea s l es
ca s es % s us pected ca s es wi th a dequa te i nves ti ga ti
on i ni ti a ted
w/i n 48 hours of noti fi ca ti on
% s us pected ca s es wi th s erum s peci mens
col l ected Number of
s erum s peci mens recei ved i n l a bora tory
% s peci mens
tes ted for s erol ogy
of s peci mens
recei ved i n the l a bora tory
% s erol ogy res ul ts reported w/i n 4 da ys
of s peci men recei ved a t l a bora tory
Case classification (number)
Reporti ng ra te of di s ca rded
non-mea s l es non-rubel l a ca s es a t the na ti ona l l evel per 100,000 popn
% di s tri cts reporti ng a t
l ea s t 2 di s ca rded
non-mea s l es non-rubel l a
ca s es per 100,000 popn
Mea s l es i nci dence1
per mi l l i on
popn
% s erum s peci mens recei ved a t l a bora tory w/i n 5 da ys of col l ecti on
Rubel l a i nci dence2
per mi l l i on
popn
Mea s l es Rubel l a
D
is
ca
rd
e
d
n
o
n
-m
e
a
sl
e
s
n
o
n
-ru
b
e
ll
a
c
a
se
s
P
e
n
d
in
g
c
la
ss
if
ic
a
ti
o
n
La
b
o
ra
to
ry
-c
o
n
fi
rm
e
d
E
p
id
e
m
io
lo
g
ic
a
ll
y-co
n
fi
rm
e
d
C
li
n
ic
a
ll
y-co
n
fi
rm
e
d
La
b
o
ra
to
ry
-c
o
n
fi
rm
e
d
E
p
id
e
m
io
lo
g
ic
a
ll
y-co
n
fi
rm
e
d
Bangladesh 8,148 92 80 6,421 100 100 63 2,688 961 511 230 58 3,700 0 2.37 75 26.66 1.85
Bhutan 221 84 79 166 59 105 46 14 0 0 2 0 160 45 21.47 65 18.79 2.68
DPR Korea 105 100 100 105 100 100 99 0 0 0 0 0 105 0 0.42 0.00 0.00
India3
19,433 0 31 5,974 81 87 60 3,078 5,833 0 743 1,998 2,691 5,090 0.21 5 7.04 2.17
Indonesia4 4,946 47 100 2,468 93 73 27 662 0 0 343 0 342 3,599 0.14 2.63 1.36
Maldives 63 97 100 63 100 100 70 1 0 0 1 0 59 2 17.26 60 2.93 2.93
Myanmar 1,682 41 89 1,459 99 100 94 1,045 189 63 3 0 349 33 0.68 14 25.22 0.06
Nepal 898 23 89 386 64 190 68 57 25 11 16 0 711 78 2.60 55 3.41 0.59
Sri Lanka 203 98 89 177 90 100 62 1 0 18 1 0 183 0 0.89 23 62.00 0.42
Thailand 2,974 29 86 2,390 58 95 59 1,440 14 549 24 0 854 93 1.32 30.87 0.37
Timor-Leste 131 100 99 119 100 72 52 0 0 0 5 0 122 4 10.07 38 0.00 4.13
SEAR 38,804 32 59 19,728 87 94 59 8,986 7,022 1,152 1,368 2,056 9,276 8,944 0.50 9.20 1.84
1 Includes labo rato ry-co nfirmed, epidemio lo gically-linked and clinically-co nfirmed measles cases 4 A lso includes the cases fro m enhanced measles case-based surveillance.
ND=No data
2
Includes labo rato ry-co nfirmed and epidemio lo gically-linked rubella cases
3 Cases fro m suspected measles o utbreak investigatio n o nly, case based surveillance is gradually exCA nding in the co untry
* Figures in the table 1 are restricted to availability of various dates required for calculation. Thus they may not adequately reflect cases with missing dates for various timelines.
Countries
Number of s us pected mea s l es ca s es
% s us pected ca s es wi th a dequa te i nves ti ga ti
on i ni ti a ted
w/i n 48 hours of noti fi ca ti on
% s us pected ca s es wi th s erum s peci mens
col l ected Number of
s erum s peci mens recei ved i n l a bora tory
% s peci mens
tes ted for s erol ogy
of s peci mens
recei ved i n the l a bora tory
% s erol ogy res ul ts reported w/i n 4 da ys
of s peci men recei ved a t l a bora tory
Case classification (number)
Reporti ng ra te of di s ca rded
non-mea s l es non-rubel l a ca s es a t the na ti ona l l evel per 100,000 popn
% di s tri cts reporti ng a t
l ea s t 2 di s ca rded
non-mea s l es non-rubel l a
ca s es per 100,000 popn
Mea s l es i nci dence1
per mi l l i on
popn
% s erum s peci mens recei ved a t l a bora tory w/i n 5 da ys of col l ecti on
Rubel l a i nci dence2
per mi l l i on
popn
Mea s l es Rubel l a
D
is
ca
rd
e
d
n
o
n
-m
e
a
sl
e
s
n
o
n
-ru
b
e
ll
a
c
a
se
s
P
e
n
d
in
g
c
la
ss
if
ic
a
ti
o
Vol. 22,
Week 02, 2018
Vaccine Preventable Disease Surveillance Bulletin
Page 2
Table 3: Classification of AFP Cases and Key Surveillance Indicators, 2017-2018 (data as of 15 January 2018)
Table 4: Intratypic Differentiation (ITD) of Isolates from AFP Cases, 2016-2017 (data as of 15 January 2018)
T
o
ta
l
>
9
0
D
a
y
s
3
T
o
ta
l
>
9
0
D
a
y
s
3
Bangladesh
1,364
0
0
0
1,338
26
14
2.74
2.69
98
99
7
0
0
0
0
7
0
0.37
0.00
100
100
Bhutan
8
0
0
0
7
1
0
3.24
2.83
88
100
0
0
0
0
0
0
0
0.00
0.00
0
0
DPR Korea
103
0
0
0
65
38
17
1.80
1.14
96
99
0
0
0
0
0
0
0
0.00
0.00
0
0
India
38,870
0
0
12
35,795
3,063
1,286
8.87
8.17
86
98
139
0
0
0
0
139
0
0.82
0.00
71
83
Indonesia
1,535
0
0
1
1,322
212
128
2.18
1.88
83
97
0
0
0
0
0
0
0
0.00
0.00
0
0
Maldives
6
0
0
0
4
2
0
6.34
4.23
67
100
0
0
0
0
0
0
0
0.00
0.00
0
0
Myanm ar
378
0
0
0
310
68
3
2.80
2.30
96
100
0
0
0
0
0
0
0
0.00
0.00
0
0
Nepal
341
0
0
0
326
15
2
3.93
3.76
99
100
0
0
0
0
0
0
0
0.00
0.00
0
0
Sri Lanka
70
0
0
0
68
2
2
1.29
1.25
84
100
0
0
0
0
0
0
0
0.00
0.00
0
0
Thailand
183
0
0
0
132
51
28
1.58
1.14
66
92
0
0
0
0
0
0
0
0.00
0.00
0
0
Tim or-Leste
3
0
0
0
1
2
1
0.65
0.22
33
100
0
0
0
0
0
0
0
0.00
0.00
0
0
SEAR
42,861
0
0
13
39,368
3,480
1,481
7.09
6.52
86
98
146
0
0
0
0
146
0
0.63
0.00
73
84
3
90 days calculation based on date of paralysis onset subtracted from date of last report received from member countries by SEARO.
2017 (Onset)
2018 (Onset)
AFP
Surveillance Indicators
AFP
Surveillance Indicators
Case Classification
1Annualized
AFP Rates
2Specim en
A
F
P
C
a
s
e
s
W
il
d
P
o
li
o
v
ir
u
s
C
a
s
e
s
V
a
c
c
in
e
D
e
ri
v
e
d
P
o
li
o
v
ir
u
s
C
a
s
e
s
4
C
o
m
p
a
ti
b
le
D
is
c
a
rd
e
d
(
N
o
n
-p
o
li
o
A
F
P
)
Pending
A
F
P
R
a
te
Case Classification
1AFP Rates
2Specim en
1
All countries are using the virologic classification scheme.
C
o
m
p
a
ti
b
le
D
is
c
a
rd
e
d
(
N
o
n
-p
o
li
o
A
F
P
)
Pending
A
F
P
R
a
te
N
o
n
-P
o
li
o
A
F
P
R
a
te
%
w
it
h
2
s
p
e
c
.,
a
t
le
a
s
t
2
4
h
rs
a
p
a
rt
,
w
/i
n
1
4
d
a
y
s
N
o
n
-P
o
li
o
A
F
P
R
a
te
%
w
it
h
2
s
p
e
c
.,
a
t
le
a
s
t
2
4
h
rs
a
p
a
rt
,
w
/i
n
1
4
d
a
y
s
%
w
it
h
a
n
y
s
p
e
c
im
e
n
A
F
P
C
a
s
e
s
W
il
d
P
o
li
o
v
ir
u
s
C
a
s
e
s
V
a
c
c
in
e
D
e
ri
v
e
d
P
o
li
o
v
ir
u
s
C
a
s
e
s
4
Country
2
AFP rates per 100,000 children aged <15 years using population figures provided by member countries (AFP cases > 15 years of age or missing age information are excluded).
%
w
it
h
a
n
y
s
p
e
c
im
e
n
W
il
d
V
a
c
c
in
e
W
il
d
V
a
c
c
in
e
V
D
P
V
W
il
d
V
a
c
c
in
e
<7 Days
>7
days Wil
d
V
a
c
c
in
e
W
il
d
V
a
c
c
in
e
V
D
P
V
W
il
d
V
a
c
c
in
e
<7 Days
>7 days
Bangladesh IPH, Dhaka 8 0 3 0 0 0 0 1 3 0 0 1 0 0 20 0 8 0 0 0 0 7 5 0 0 0 0 0
Bhutan NIH, Bangkok 1 0 0 0 1 0 0 0 0 0 0 0 0 0 0 0 0 0 0 0 0 0 0 0 0 0 0 0
DPR Korea NPL, Pyongyong 0 0 0 0 0 0 0 0 0 0 0 0 0 0 0
BJMC, Ahmedabad 258 0 78 0 25 0 0 74 80 1 0 0 0 0 231 0 78 0 0 0 0 67 76 7 0 0 3 0
NIV, Bengaluru 225 0 56 0 24 0 0 67 70 6 2 0 0 0 151 0 57 0 0 0 0 35 45 14 0 0 0 0
ERC, Mumbai 172 0 53 0 13 0 0 52 43 11 0 0 0 0 154 0 52 0 0 0 0 45 36 21 0 0 0 0
SGPGI, Lucknow 311 0 56 0 53 0 0 86 66 16 34 0 0 0 290 0 60 0 0 0 0 100 64 25 41 0 0 0
KIPM, Chennai 98 0 26 0 17 1 0 26 28 0 0 0 0 0 50 0 10 0 0 0 0 27 12 0 0 0 1 0
NCDC, Delhi 231 0 47 0 38 0 0 91 52 3 0 0 0 0 206 0 59 0 0 0 0 88 51 8 0 0 0 0
IoS, Kolkatta 113 0 26 0 18 0 0 35 33 0 1 0 0 0 173 0 54 0 0 0 0 39 58 18 3 0 0 1
CRI, Kasauli 35 0 5 0 7 0 0 11 12 0 0 0 0 0 22 0 11 0 0 0 0 6 5 0 0 0 0 0
1,443 0 347 0 195 1 0 442 384 37 37 0 0 0 1,277 0 381 0 0 0 0 407 347 93 44 0 4 1
Bio Farma, Bandung 18 0 9 0 3 0 0 1 5 0 0 0 0 0 2 0 0 0 0 0 0 2 0 0 0 0 0 0
NIHRD, Jakarta 12 0 4 0 0 0 0 5 3 0 0 0 0 0 2 0 0 0 0 0 0 0 2 0 0 0 0 0
PHL, Surabaya 13 0 2 0 4 0 0 4 3 0 0 0 0 0 1 0 0 0 0 0 0 1 0 0 0 0 0 0
43 0 15 0 7 0 0 10 11 0 0 0 0 0 5 0 0 0 0 0 0 3 2 0 0 0 0 0
Myanm ar NHL, Yangon 7 0 1 0 1 0 0 2 3 0 0 0 0 0 6 0 1 0 0 0 0 4 1 0 0 0 0 0
Nepal NIH, Bangkok 6 0 2 0 2 0 0 1 1 0 0 0 0 0 5 0 0 0 0 0 0 3 2 0 0 0 0 0
Sri Lanka MRI, Colombo 1 0 0 0 0 0 0 1 0 0 0 0 0 0 0 0 0 0 0 0 0 0 0 0 0 0 0 0
Thailand NIH, Bangkok 4 0 0 0 0 0 0 2 2 0 0 0 0 0 5 0 2 0 0 0 0 3 0 0 0 0 0 0
1,513 0 368 0 206 1 0 459 404 37 37 1 0 0 1,318 0 392 0 0 0 0 427 357 93 44 0 4 1
Polio 3
V
a
c
c
in
e
m
ix
tu
re
N
P
E
V
b
y
P
C
R
N
E
V
Country of
Case ITD Labs
2016 2017
Intratypic Differentiation results Results
pending
Intratypic Differentiation results Results
pending
A
F
P
c
a
s
e
s
re
fe
rr
e
d
fo
r
IT
D
Indonesia Total
TOTAL
N
P
E
V
b
y
P
C
R
N
E
V
N
e
g
a
ti
v
e
India
India Total
Indonesia
N
e
g
a
ti
v
e
A
F
P
c
a
s
e
s
re
fe
rr
e
d
fo
r
IT
D Polio 1 Polio 2 Polio 3
V
a
c
c
in
e
m
ix
tu
re