Patricia Cortes is an assistant professor of markets, public policy, and law at Boston University Questrom School of Business. Jessica Pan is an assistant professor of economics at the National University of Singa-pore. The authors thank Jim Rebitzer and Kevin Lang and seminar participants at MIT Sloan, University of Connecticut, Northeastern University, Queens College, Boston University, Sogang University, Academia Sinica, National Taiwan University, Universidad de los Andes, the ASSA meetings in San Diego, and the 5th International Conference on Migration and Development for numerous helpful comments and suggestions. They also thank Afi qah Suhaiemi for providing excellent research assistance and Joanne Spetz for kindly shar-ing the NPS and California Survey data. The data used in this article can be obtained beginnshar-ing March 2016 through April 2019 from Patricia Cortes, Boston University Questrom School of Business, pcortes@bu.edu. [Submitted September 2013; accepted June 2014]
ISSN 0022- 166X E- ISSN 1548- 8004 © 2015 by the Board of Regents of the University of Wisconsin System T H E J O U R N A L O F H U M A N R E S O U R C E S • 50 • 4
The Relative Quality of Foreign-
Educated Nurses in the United States
Patricia Cortés
Jessica Pan
Cortés and PanABSTRACT
We examine the relative quality of foreign- educated nurses using wages as a measure of skill. Philippine- educated nurses enjoy a wage premium that is not explained by observed differences in worker or job characteristics. We reconcile the results with a Roy model featuring endogenous skill acquisition and provide some empirical evidence of double- selection into nursing and migration. Our results suggest that the wage premium is likely driven by strong positive selection into nursing among Filipinos resulting from high and heterogeneous returns to the occupation due to active government support for nurse migration in the Philippines.
I. Introduction
The Journal of Human Resources 1010
Future increases in the demand for healthcare due to aging of the population, the pass-ing of the Affordable Care Act, and a potential shortage of primary care physicians makes it almost inevitable that the United States will have to rely more heavily on foreign nurses, even if the supply of native nurses continues its recent upward trend (Auerbach, Buerhaus, and Staiger 2011).
Nevertheless, the importation of registered nurses (RNs)1 to satisfy the demand for
nurses raises a number of important concerns. These include whether differences in training, language, and culture result in lower- quality care, and whether the importa-tion of foreign nurses exerts a negative impact on the wages and working condiimporta-tions of native nurses, thereby resulting in native nurse displacement.2,3 Furthermore, there are
also ethical concerns arising from potential brain drain that might negatively impact the health systems of source countries.
This paper examines how foreign- educated nurses differ from native nurses in terms of observable characteristics and quality measures—wages in particular—and interprets these quality differentials within the framework of the Roy model of oc-cupational choice.
Using data from the U.S. Census and the National Sample of Registered Nurses (NSSRN), we fi nd that foreign nurses, in particular Filipinos, tend to work in more demanding settings and maintain less desirable schedules—they are more likely to work in hospitals, work full- time, and do shift- work, relative to their native counter-parts. In terms of educational background, the majority of foreign nurses have at least a bachelor’s degree, whereas a larger fraction of natives have an associate’s degree. A more educated nurse workforce has been associated with better patient outcomes and higher nurse productivity (Aiken et al. 2003, Bartel et al. 2014). Hospitals have also been shown to attract nurses of higher unobserved ability (Hirsch and Schumacher 2007). Therefore, at least in terms of their education levels and place of work, foreign nurses appear to have higher levels of skill compared to native nurses.4
Next, we focus on quality differences between foreign and native nurses beyond those suggested by their observed characteristics. Absent direct productivity measures, we use wages as a proxy for skill. Using census data from 1980 to 2010, we fi nd striking evidence of a positive wage premium for Filipino nurses relative to U.S.- born nurses. The premium is less than 2 percent in 1990, reaches a maximum of 8.5 percent in 2000, and decreases to 6 percent in 2007 and 2010. This wage premium cannot be explained by differences in demographics, education, location, or detailed job characteristics (such as setting, part- time status, shift work, and hospital unit).
1. In this study, we focus on Registered Nurses (RNs) as a category distinct from Licensed Practice Nurses (LPNs). RNs have to go through more training (two years in nursing school to obtain an associate’s degree in the United States) than LPNs (one year in vocational training). RNs typically have more medical and supervisory responsibilities compared to LPNs. We use the terms RN and nurse interchangeably in the text. 2. A representative of the American Nurse Association (ANA) giving testimony in 2008 in Capitol Hill stated that “The ANA opposes the use of immigration as a means to address the growing nursing shortage” and that “[i]n the end, ANA is concerned that the infl ux of foreign- educated nurses only serves to further delay debate and action on the serious workplace issues that continue to drive American nurses away from the profession” (American Nurse Association 2008).
3. In a companion paper (Cortes and Pan 2014), we study the effects of the importation of foreign nurses on the labor supply of native nurses.
Cortés and Pan 1011
Interestingly, the observed wage premium for Filipino nurses does not extend to other foreign nurses, who appear more comparable to native nurses.5 Moreover, we present
several pieces of evidence suggesting that the observed wage premium for Filipino nurses refl ects actual quality differences and not just unobserved characteristics of the job that carry a higher wage but are unrelated to skills, such as working nonstandard schedules.
To explain why Filipino nurses enjoy a wage premium relative to their native coun-terparts, we turn to the Roy (1951) model of occupational choice. Active support of the Philippine government for the migration of nurses makes nursing one of the most profi table occupations. Filipino nurses who migrate to work in other countries earn between 2.5 (if they migrate to Taiwan) and 13 times more (if they migrate to the United States) than nurses who remain in the Philippines. Nurses who migrate to Eu-rope or to the United States earn about fi ve times more than what the average lawyer or chief executive offi cer (CEO) makes in the Philippines. In contrast, nursing in the United States exhibits one of the lowest wage dispersion levels among major skilled occupations, and although it pays relatively well, other professions such as medicine, law, and business are associated with higher salaries and prestige. With the possibility of international migration, the Roy model predicts that the higher and more heteroge-neous returns to nursing compared to any other occupation in the Philippines (a result of the Philippines’ policy of nurse exportation) are likely to generate strong positive selection into nursing. Moreover, given that the United States offers the highest wages, it is likely that Filipino nurses working in the United States are drawn from the upper tail of the skill distribution of nurses in the Philippines.
We fi nd that Filipino nurses are positively selected along a number of observable characteristics. Nurses in the Philippines are more likely to come from higher- educated families compared to other women with a bachelor’s degree. The opposite is observed for native nurses in the United States. Furthermore, among Filipino nurses, those who migrated to the United States are more likely to come from higher- educated families relative to those who migrated to other destinations. They are also more likely to come from the upper end of the nurse wage distribution in the Philippines. Overall, these fi ndings support the Roy model, which predicts positive selection into the nursing sec-tor in the Philippines and positive sorting of nurse migrants to destinations that offer the highest wages. These effects are likely to result in the observed wage premium for Filipino nurses in the United States.
Understanding the nature of the large scale infl ow of foreign- educated nurses is particularly important given the widespread reliance on foreign- educated nurses in the United States and other developed countries and the importance of nurses for health-care productivity (Propper and Van Reenen 2010, Bartel et al. 2014). Our fi ndings have important implications for the use of foreign RNs to address current and future nurse shortages. First, we fi nd no evidence that foreign- educated nurses, in particular Filipinos, are of lower quality than native nurses. It is diffi cult to imagine a situation in which Filipino nurses provide a lower quality of care and yet are paid signifi cantly
The Journal of Human Resources 1012
more than native nurses. Second, our results mitigate concerns raised by native nurse organizations that hospitals prefer to hire foreign nurses because they can pay them lower wages, plausibly driving down wages for natives.6 Finally, our analysis suggests
that international demand for nurses is likely to affect, at least in the medium to long run, both the quantity and quality of individuals choosing nursing as a career in send-ing countries. Therefore, hirsend-ing foreign nurses does not necessarily imply that nurse migration depletes them of their healthcare workforce, especially for countries with the capacity to expand the supply of healthcare professionals such as the Philippines, India, and Korea.7
Beyond the immediate policy relevance of this phenomenon, our paper also con-tributes to the growing theoretical and empirical literature on high- skill migration, self- selection, and endogenous skill acquisition by providing an in- depth empirical case study on a single profession and sending country. Our paper is close in spirit to a growing literature based on the Roy (1951) model that examines patterns of self- selection among migrants (Chiquiar and Hanson 2005; McKenzie and Rapoport 2010; Grogger and Hanson 2011; Abramitzky, Boustan, and Ericksson 2012). Our analysis also lends support to the idea that the possibility of emigration could increase the expected returns to skill acquisition, possibly resulting in a higher quantity and qual-ity of skilled individuals in the source country (Clemens 2007, Gibson and McKenzie 2011, Docquier and Rapoport 2012). Our paper is one of the fi rst to explore, both theoretically and empirically, how variation in the probability of emigration by pro-fession (in this case driven by sending government policies) affects the occupational choice and distribution in the country of origin. Our empirical evidence shows that the most skilled migrants settle in the United States, the destination country that offers the highest wages for nurses. That it is the most popular destination is consistent not only with positive selection but also positive sorting (Grogger and Hanson 2011) of foreign nurses.
The rest of the paper proceeds as follows. The next section describes the back-ground of foreign- educated nurses in the United States. Section III outlines the data used and the descriptive statistics. The empirical specifi cations and results are pre-sented in Section IV. Section V provides an interpretation of the empirical fi ndings within the context of the Roy model. Section VI concludes.
II. Background
Foreign- educated nurses have been a part of the U.S. workforce since the 1940s (CGFNS International, Davis, and Nichols 2009). However, their recruit-ment has varied signifi cantly through time, shaped by changes in the domestic supply and demand for nurses and by immigration laws. The share of foreign RNs in the
nurs-6. In testimony to Congress in 2008, a representative from ANA stated that: “In addition, ANA is concerned that immigrant nurses are too often exploited because employers know that fears of retaliation will keep them from speaking up” and that “their complaints are very similar to those that I have heard made by literally hundreds of other immigrants. They were promised that they would be employed as RNs, but were made to work as lesser- paid staff; they were made to work unreasonable hours; they were not paid overtime” (American Nurse Association 2008).
Cortés and Pan 1013
ing labor force increased from 4 percent in 1970 to 8 percent in 2010; their share grew every decade, except in the 1980s when it stayed relatively constant. The observed growth in the share of foreign RNs is similar to that of foreign- educated workers with a bachelor’s degree or a graduate degree.
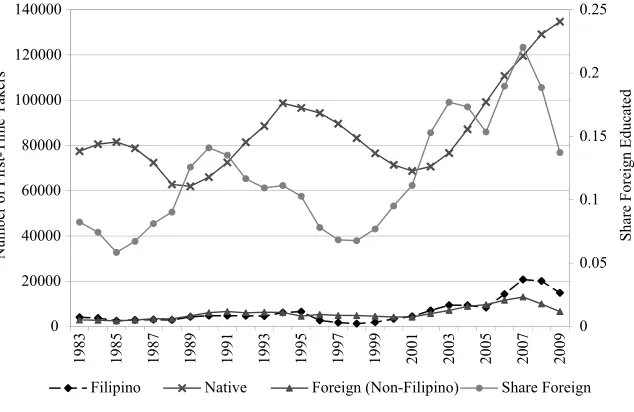
Examining the fl ows allows for a better characterization of the fl uctuations in the recruitment of foreign RNs. Figure 1 presents data on the number of fi rst- time takers of the board exam for RNs in the United States by foreigner status. As observed, since 1983 there have been two periods of signifi cant increase in the number and share of foreigners taking the exam. The fi rst coincides with a decline in the number of native nurses entering the labor force in the second half of the 1980s and the subsequent approval of the Nursing Relief Act of 1989, legislation that created the H- 1A visa category for RNs for a period of fi ve years. Under the Act, there were no limits placed on the number of nurses who could enter the United States under this visa category. The Nursing Relief Act expired in 1995, which left nurses without a special category of their own.8 As most nursing positions do not require a bachelor’s degree, they
can-not be fi lled by foreigners on an H1- B visa. Since 1995, most foreign nurses have to obtain a permanent visa or green card, which typically involves a lengthy process, as the requests from some countries such as India, the Philippines, and China always exceed the yearly quota.
8. The exception is the H- 1C Non- Immigrant Visa, which is limited to a total of 500 nurses per year and then only to 25 nurses for each state that qualifi es. Only hospitals that have been determined by the U.S. Depart-ment of Health and Human Services to have a critical shortage of healthcare workers can apply.
0 0.05 0.1 0.15 0.2 0.25
0 20000 40000 60000 80000 100000 120000 140000
1983 1985 1987 1989 1991 1993 1995 1997 1999 2001 2003 2005 2007 2009
Share
Forei
g
n
Educ
at
ed
Num
b
er of
First-Tim
e
Takers
Filipino Native Foreign (Non-Filipino) Share Foreign
Figure 1
Flow of Nurses by Foreign Status—NCLEX First- Time Takers
The Journal of Human Resources 1014
The second spike in the share of foreign nurses taking the exam once again followed a period of continuous decline in the number of native nurses taking the exam. Starting in 2000, the share of foreign nurses increased to unprecedented levels, reaching an all- time high of 22 percent in 2006 when Congress passed legislation that allocated 50,000 immigrant visas exclusively for nurses, physical therapists, and their families. The increase since 2000 also refl ects important changes that have greatly facilitated the hiring of foreign nurses beyond changes in immigration laws. First, the number of U.S.- based international nurse recruitment fi rms experienced a tenfold increase since the late 1990s (Pittman et al. 2007). Second, the NCLEX started being offered over-seas beginning in 2005—prior to that, candidates had to apply for a temporary visa to take the exams in the United States.
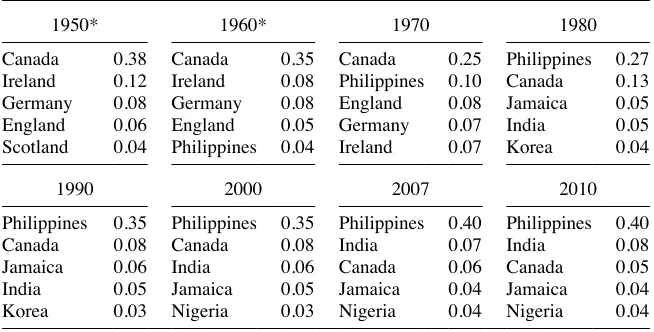
Immigration laws have also shaped the country of origin composition of foreign nurses. Table 1 presents the country distribution of foreign nurses by census / ACS year, before the Hart- Celler Act of 1965, which replaced the country quota system with preference categories based on family and job skills. The table shows that most foreign nurses came from Canada and Western Europe. The new legislation shifted the country composition of migrants to the United States, with many more people coming from Asia and Latin America. In the particular case of nurses, the law led to thousands of nurses from the Philippines migrating to the United States. For the last several decades, the Philippines has been the primary source of foreign- educated nurses to the United States. Today, four out of ten foreign nurses are from the Philip-pines and even larger shares are observed when focusing on fl ows. In particular, since the early 2000s the share of foreigners taking the NCLEX who were educated in the
Table 1
Top Countries of Origin of Foreign Nurses Educated Abroad by Census Year (Share of Total Foreign Nurses)
1950* 1960* 1970 1980
Canada 0.38 Canada 0.35 Canada 0.25 Philippines 0.27 Ireland 0.12 Ireland 0.08 Philippines 0.10 Canada 0.13
Germany 0.08 Germany 0.08 England 0.08 Jamaica 0.05
England 0.06 England 0.05 Germany 0.07 India 0.05
Scotland 0.04 Philippines 0.04 Ireland 0.07 Korea 0.04
1990 2000 2007 2010
Philippines 0.35 Philippines 0.35 Philippines 0.40 Philippines 0.40
Canada 0.08 Canada 0.08 India 0.07 India 0.08
Jamaica 0.06 India 0.06 Canada 0.06 Canada 0.05
India 0.05 Jamaica 0.05 Jamaica 0.04 Jamaica 0.04
Korea 0.03 Nigeria 0.03 Nigeria 0.04 Nigeria 0.04
Cortés and Pan 1015
Philippines has hovered around 55 to 60 percent (see Figure 1). Table 1 also shows that, in the last few years, nurses from India had started to enter the United States in larger numbers; nevertheless, they still represent less than 10 percent of foreign nurses.
Why the predominance from the Philippines?
Medicine and nursing constituted integral components of the American colonial project in the Philippines.9 As a result, the Philippines ended up with an
American-ized hospital training system that was able to produce nurse professionals with the required training, language, and work culture comparable to that of nurses in the United States. With the passage of the Hart- Celler Act of 1965 in the United States and the establishment of international migration as a development policy by President Marcos in the Philippines, nurse migration became a large phenomenon in the Philip-pines. Entrepreneurs in the Philippines set up more nursing schools as the interna-tional demand grew, and the number of nursing graduates soared. In the 1940s, there were only 17 nursing schools in the Philippines compared to 170 in 1990 and more than 300 today. Currently, the Philippines exports nurses to several dozen countries worldwide.10
III. Data and Descriptive Statistics
We use the 1980–2000 censuses and the American Community Survey three- year aggregates for 2007 (2005–2007) and for 2010 (2008–2010) as our main data sources.11 The average sample size per year is about 100,000 nurses. Table 2
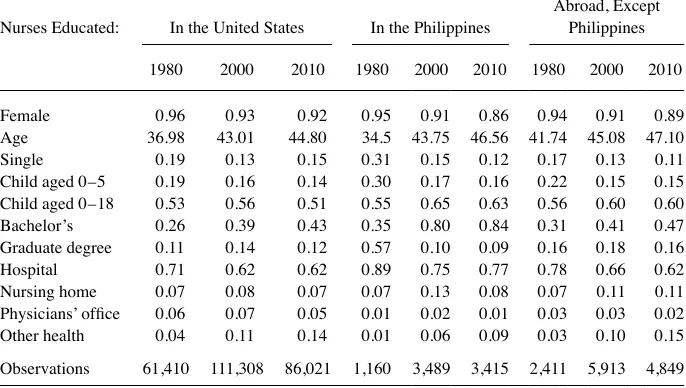
presents the descriptive statistics of RNs by country of education and by census / ACS year.12 Important differences stand out between native and foreign nurses, especially
Filipinos. Foreign nurses born elsewhere tend to be in between the other two groups on most dimensions.13 Although Filipino nurses were on average signifi cantly younger
9. The islands were an American colony from 1898–1946.
10. Confi dential data from the Philippines Overseas Employment Administration (POEA) on all contracts of temporary migrant workers leaving the Philippines from 1992–2009 suggest that the country exports nurses to more than 50 countries around the world.
11. Unlike the decennial U.S. census that is conducted once every ten years in the United States, the ACS is an ongoing survey that samples a small percentage of the population every year on a range of demographic, housing, social, and economic information. Both surveys are conducted by the U.S. Census Bureau. 12. The census does not ask about country of education. We assume that a nurse was educated abroad if she were 21 or older when she fi rst arrived in the United States. To calculate the age of arrival, we use the variable year of immigration. The variable year of immigration is aggregated in fi ve year periods in the 1980 and 1990 census (for example, people arriving between 1960 and 1964 are all assigned the same code). We assume all migrants arrived in the middle year of the relevant period (1962 in the example above).
We estimate that about 80 percent of nurses born in the Philippines were educated abroad, 6–7 percent came to the United States for their post- secondary education, and the rest arrived as children. We include foreign- born nurses educated in the United States in the group of native nurses.
The results are robust to changing the allocation rule for country of education.
The Journal of Human Resources 1016
than natives in 1980, the slowdown of nurse importation during the 1980s closed the gap. Today, the average age of nurses working in the United States is more than 45 years, signifi cantly higher than the average for workers with two years of college or a bachelor’s degree (45.1 versus 40.8). The greying of the nursing labor force in the United States is a cause for concern given its implications for future projected nurse shortages.
Females continue to strongly dominate the profession in all cases, but foreign nurses are relatively more likely to be male. More than 80 percent of Filipino nurses have at least a bachelor’s degree. This is in contrast to most native nurses and other foreign nurses who typically have only an associate’s degree or diploma. This fact is not sur-prising given that in the Philippines a four- year college degree is required to become a nurse. In terms of work setting, Filipino nurses are signifi cantly more likely to work in hospitals and much less likely to work in physicians’ offi ces. Given that higher educa-tional attainment and working in hospitals have been linked to better patient outcomes and higher unobserved ability of nurses (Aiken 2007, Hirsch and Schumacher 2007), at least in terms of observables, the average Filipino nurse appears more skilled than the average native nurse.
Foreign nurses are heavily concentrated in some areas of the country. Whereas in places like Washington D.C., California, and Nevada about one out of fi ve nurses was educated abroad, in other places like Wyoming and North Dakota there are almost no foreign nurses. Filipinos represent a signifi cant share of nurses (greater than 10 per-cent) in Nevada, California, New Jersey, and Hawaii.
Table 2
Characteristics of the Stock of Nurses by Country of Education and Decade
Nurses Educated: In the United States In the Philippines
Abroad, Except Philippines
1980 2000 2010 1980 2000 2010 1980 2000 2010
Female 0.96 0.93 0.92 0.95 0.91 0.86 0.94 0.91 0.89 Age 36.98 43.01 44.80 34.5 43.75 46.56 41.74 45.08 47.10 Single 0.19 0.13 0.15 0.31 0.15 0.12 0.17 0.13 0.11 Child aged 0–5 0.19 0.16 0.14 0.30 0.17 0.16 0.22 0.15 0.15 Child aged 0–18 0.53 0.56 0.51 0.55 0.65 0.63 0.56 0.60 0.60 Bachelor’s 0.26 0.39 0.43 0.35 0.80 0.84 0.31 0.41 0.47 Graduate degree 0.11 0.14 0.12 0.57 0.10 0.09 0.16 0.18 0.16 Hospital 0.71 0.62 0.62 0.89 0.75 0.77 0.78 0.66 0.62 Nursing home 0.07 0.08 0.07 0.07 0.13 0.08 0.07 0.11 0.11 Physicians’ offi ce 0.06 0.07 0.05 0.01 0.02 0.01 0.03 0.03 0.02 Other health 0.04 0.11 0.14 0.01 0.06 0.09 0.03 0.10 0.15
Observations 61,410 111,308 86,021 1,160 3,489 3,415 2,411 5,913 4,849
Cortés and Pan 1017
IV. Empirical Speci
fi
cation
To investigate differences in labor supply outcomes between native and foreign nurses and to estimate wage premiums for nurses educated abroad, we use the following linear model:
(1) Yicst =␣+Filipinoicst+␦OtherForeignicst+␥Xicst+c+s+t+εicst where i is the individual, c is the city, s is the setting (hospital, nursing home, physi-cian’s offi ce, and other health services), and t is the time period.14Y is either a labor
supply outcome or the log hourly wage of nurses. Filipino and OtherForeign are dummy variables that take a value of 1 if the nurse was educated in the Philippines or in another foreign country, respectively. Vector Xicst are individual- level controls, including demographic characteristics (age fi xed effects, marital status, race, and chil-dren), highest level of education dummies (two or three years of college, a bachelor’s degree, or a graduate degree), and depending on the outcome, dummies for part- time work and shift work. In all specifi cations, we include city and setting fi xed effects. We estimate Equation 1 using OLS.15
A. Labor Supply
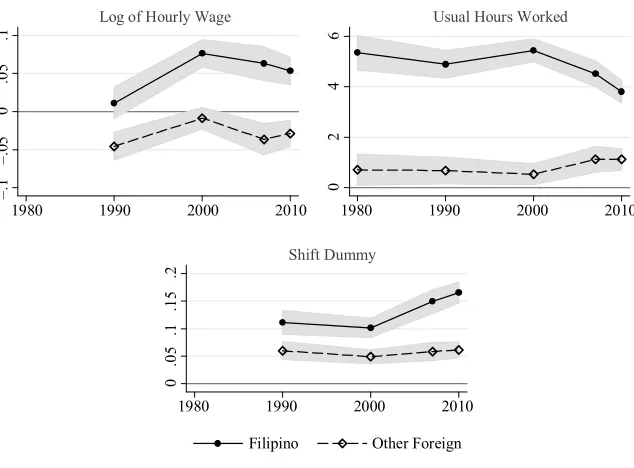
Table 3 presents the estimation of Equation 1 for labor supply outcomes. We fi rst look at usual hours of work per week (including zeros). We fi nd that Filipino nurses work about four hours more per week than natives and that the difference is not explained by observable characteristics, in particular by being more likely to work in hospitals. Looking at how the coeffi cient changes by year (Figure 2) suggests that in recent years the gap narrowed somewhat, but it is still large in magnitude and highly statistically signifi cant.
We explore if the longer hours worked per week on average by Filipino nurses are due to differences in participation rates, the likelihood of working extra time, or the probability of working part- time. Filipinos are more likely to participate in the labor force than natives but only by about one percentage point. Interestingly, they are slightly less likely to work more than 40 hours per week. Therefore, what drives the average difference in usual hours worked per week between natives and Filipino nurses is that the former are signifi cantly more likely, by between 15–18 percentage points, to work part- time. Note that the model controls for type of setting dummies so the difference cannot be explained by the higher propensity of Filipino nurses to work in hospitals. Finally, Filipino nurses are signifi cantly more likely to do shift work,16
with the difference increasing by 50 percent in the last decade (Figure 2). The magni-tude of the Filipino dummy coeffi cient (14 percentage points) is large, and is about the same magnitude as the average likelihood that a native nurse works odd hours.
Outcomes for nurses from other foreign countries are generally in between: they also work longer than natives but only between half an hour to an hour more. As
14. We use the 1980, 1990, 2000 census data and ACS three- year aggregate for 2007 and 2010.
15. Probit estimates for labor force participation, shift work, part- time, and overtime models are very similar to OLS. Results are available from the authors upon request.
The Journal of Human Resources 1018
Filipinos, this difference comes from being less likely to work part- time. Other foreign nurses are six percentage points more likely to do shift work relative to native nurses.
To the extent that healthcare providers value full- time availability of RNs and their willingness to work night and evening shifts, the ability to hire Filipino and other foreign nurses has clear benefi ts for healthcare providers. For example, a recent survey conducted by the Texas Department of State Health Services on 274 hospitals in the state found that vacancies in evening and night shifts were reported by employers to be the most severe and diffi cult to fi ll (Texas Center for Nursing Workforce Studies 2008).
B. Wage Regressions
In the last row of Table 3, we present the estimation of Equation 1 when the dependent variable is the log of the hourly wage of an RN.17,18 The unconditional wage
differ-ential between foreign and native nurses is very large—on average, Filipino nurses (other foreign nurses) make about 25 (10) percent more than natives. Controlling for city fi xed effects and job characteristics such as setting, part- time, and shift dum-mies reduces the Filipino premium by half. Filipino and other foreign nurses are more likely to live in larger and richer areas. Including education- level fi xed effects and demographic characteristics as controls reduces the premium further by six percent-age points. Nevertheless, even after controlling for all observable characteristics, we continue to fi nd a large and highly statistically signifi cant wage premium for Filipino nurses of 5.5 percent. As shown in Figure 2, the premium starts at below 2 percent in 1990, reaches a maximum of close to 8.5 percent in 2000, and declines to about 6 percent in 2007 and 2010.
An important question is whether the wage premium for Filipino nurses refl ects quality differences or just unobserved characteristics of the job that carry a higher wage but are unrelated to skills, such as working nonstandard schedules. As discussed above, a premium is estimated even after controlling for a proxy for shift work and for part- time status.19
Examining the assimilation profi les of Filipino nurses and other foreign nurses pro-vides additional suggestive evidence that the wage premium for Filipino nurses is likely to refl ect skill differences. These results are presented in Table 4. If we believe that the longer a Filipino nurse has been in the United States, the more likely she is to
17. The hourly wage was calculated dividing salary annual income by the product of usual hours worked per week and number of weeks worked last year. The salary annual income was defl ated using the consumer price index (CPI), using 1990 as the base year. We dropped hourly wages smaller than 3.5 dollars or greater than 150 dollars. The income variable used to construct the hourly wage includes cash bonuses, which are common in the occupation.
18. Wage regressions exclude 1980 because the shift work variable cannot be constructed for that census year.
Cortés and Pan
1019
Table 3
Differences in Labor Market Outcomes Between Foreign- Educated Nurses and Native Nurses
1 2 3 4
Mean Observations Filipino
Other
Foreign Filipino
Other
Foreign Filipino
Other
Foreign Filipino
Other Foreign
Dependent variable Usual hours worked per week (including zeros)
34.14 465,029 4.505*** 1.049*** 4.239*** 0.743*** 4.092*** 0.682*** 4.600*** 0.890***
[0.120] [0.116] [0.125] [0.120] [0.126] [0.120] [0.127] [0.117]
R2 0.009 0.017 0.019 0.122
LFP 0.89 465,560 0.017*** –0.021*** 0.018*** –0.023*** 0.012*** –0.024*** 0.013*** –0.014***
[0.003] [0.003] [0.003] [0.003] [0.003] [0.003] [0.003] [0.003]
R2 0.006 0.006 0.013 0.115
Part- time | hours > 0 0.27 433,321 –0.165*** –0.090*** –0.152*** –0.071*** –0.150*** –0.069*** –0.182*** –0.069***
[0.003] [0.003] [0.003] [0.003] [0.003] [0.003] [0.004] [0.003]
R2 0.009 0.032 0.034 0.092
Overtime | hours > 0 0.16 433,321 –0.011*** –0.005 –0.011*** –0.004 –0.009** –0.005 –0.018*** –0.007**
[0.004] [0.003] [0.004] [0.003] [0.004] [0.003] [0.004] [0.003]
R2 0.004 0.010 0.011 0.030
Dummy shift worka 0.15 340,972 0.139*** 0.051*** 0.146*** 0.058*** 0.125*** 0.052*** 0.139*** 0.057***
[0.005] [0.004] [0.005] [0.004] [0.005] [0.004] [0.005] [0.004]
R2 0.006 0.009 0.044 0.058
The Journal of Human Resources
1020
1 2 3 4
Mean Observations Filipino
Other
Foreign Filipino
Other
Foreign Filipino
Other
Foreign Filipino
Other Foreign
Log(hourly wage)b 2.71 332,775 0.253*** 0.097*** 0.132*** –0.001 0.121*** 0.000 0.055*** –0.029***
[0.005] [0.005] [0.005] [0.005] [0.005] [0.005] [0.005] [0.005]
R2 0.038 0.108 0.142 0.213
Controls
Year fi xed Effects X X X X
City fi xed Effects X X X
Sector fi xed Effects, job
Characteristicsc
X X
Education fi xed effects X
Demographic characteristics X
Notes: Data come from the 1980, 1990, and 2000 censuses and three- year aggregate ACS for 2007 and 2010. The sample includes all workers aged 20–70 who reported registered nurse as their occupation and have at least one year of college education. The coeffi cient estimates for Filipino nurses and Other Foreign nurses for each numbered column and census year correspond to a separate regression of the dependent variable on a dummy for Filipino nurses and Other Foreign nurses (the omitted category is native nurses) controlling for various sets of fi xed effects and worker’s characteristics. Demographic controls include age dummies, a black dummy, a male dummy, a single dummy, a dummy for children younger than 18, and a dummy for children younger than six. Education controls include dummies for two to three years of college, bachelor’s degree, and graduate degree. The sector fi xed effects include dummies for working in a hospital, a nursing home, in a physician’s offi ce, and other health establishments. Job characteristics include a dummy for shift work, a dummy for part- time (less than 35 hours a week), and a dummy for overtime (41+ hours a week). Robust standard errors in brackets. ***signifi cant at 1 percent, **5 percent, *10 percent.
a. Shift work models have fewer observations because the sample excludes 1980. The variable needed to construct the shift work dummy was not included in the 1980 census. b. Wage regressions exclude 1980 because the shift work variable cannot be constructed for that census year.
Cortés and Pan 1021
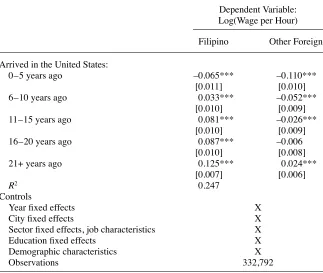
prefer the type of job settings and work schedule characteristic of U.S. nurses, then if the premium is mostly driven by job characteristics, it should go down the more years the foreign nurse has been in the United States. We fi nd, however, the exact opposite. For the fi rst fi ve years after their arrival to the United States, Filipino nurses earn less than natives. This result is fairly typical of all immigrants, not only nurses. It takes time for a worker to fi nd the best match for her skills and to develop host countries’ specifi c skills, such as language and knowledge of the culture. The premium becomes positive if the nurse arrived six to ten years before and increases to 8–12 percent after. Note that the increase in the premium is unlikely to be explained by selective return migration—Table A1 shows that the size of arriving cohorts of Filipinos hardly decreases across census years, at least while the cohorts are of working age. Further-more, as the United States is the destination of choice for migrant nurses, foreign nurses who migrate to the United States typically settle as permanent migrants (Aiken 2007).
For foreign nurses educated outside the Philippines, the wage premium is negative and statistically signifi cant when they fi rst arrive. Although the wage premium be-comes less negative with time in the United States, in contrast to Filipino nurses, there is little evidence of a signifi cant positive wage premium even for nurses that have been in the country for two decades. We estimate a positive and signifi cant premium after
–.
1
–.
0
5
0
.0
5
.1
1980 1990 2000 2010 1980 1990 2000 2010
Log of Hourly Wage
0
2
4
6
Usual Hours Worked
0
.0
5
.1
.1
5
.2
1980 1990 2000 2010
Filipino Other Foreign
Shift Dummy
Figure 2
Time Variation in Coeffi cient of Filipino and Other Foreign Dummies
The Journal of Human Resources 1022
nurses had been in the United States for more than 20 years, albeit much smaller than for Filipinos.
Finally, we explore if English skills are likely to explain the observed wage pre-mium as English is one of two offi cial languages in the Philippines. We divide foreign nurses into Filipinos, those from other English- speaking countries (Canada, India, and Jamaica), and the rest. We fi nd that, after including all sets of controls, Filipinos earn 5.5 percent more, nurses from other English- speaking countries earn 1.6 percent more,
Table 4
Assimilation Profi le of Foreign- Educated Nurses by Country of Education
Dependent Variable: Log(Wage per Hour)
Filipino Other Foreign
Arrived in the United States:
0–5 years ago –0.065*** –0.110***
[0.011] [0.010]
6–10 years ago 0.033*** –0.052***
[0.010] [0.009]
11–15 years ago 0.081*** –0.026***
[0.010] [0.009]
16–20 years ago 0.087*** –0.006
[0.010] [0.008]
21+ years ago 0.125*** 0.024***
[0.007] [0.006]
R2 0.247
Controls
Year fi xed effects X
City fi xed effects X
Sector fi xed effects, job characteristics X
Education fi xed effects X
Demographic characteristics X
Observations 332,792
Cortés and Pan 1023
and the rest earn 4.7 percent less than comparable natives. All coeffi cients are statisti-cally signifi cant. This implies that roughly a quarter of the wage premium associated with Filipino nurses might be due to their English skills.
1. Wage Regressions using the National Sample Survey of Registered Nurses and the 2008 California Survey of Registered Nurses
In this section, we discuss wage regressions using two alternative data sets, the NSSRN20,21 and a survey of RNs conducted by the California Board of Nursing. These
data sets allow us to explore the role of additional job and individual characteristics that are not available in the census in explaining the wage premium. In particular, the NSSRN allows us to control for more detailed job- setting categories,22 for the
hospital unit in which the nurse works, and for whether she works for a temporary agency. The main advantage of the California Survey of Registered Nurses is that it has information on years of experience as a registered nurse,23 tenure in most recent
position, whether her position offers health insurance or a retirement plan, and indica-tor variables for nurses working for temporary agencies or as travel nurses. Informa-tion on years of experience is particularly valuable, as it allows us to test whether Filipino nurses have more experience, conditional on age, than natives (either because they graduate younger or because they are less likely to temporarily drop out of the labor force) and the extent to which differences in experience might explain the wage premium.
In Table 5, we present results of the estimation of Equation 1 using the NSSRN.24
The estimated wage premium for Filipino nurses is very similar to the one estimated using census data—5.3 percent when demographic, education, geographic,25 and job
characteristics controls are added—suggesting that more detailed job setting catego-ries and working for a temporary agency do not explain the premium. Restricting the sample to nurses working in hospitals increases the coeffi cient to 8 percent. Adding hospital unit fi xed effects to the model only slightly changes the coeffi cients, implying that wage differences are observed within unit and are not driven by Filipinos working
20. The NSSRN has been conducted approximately every four years since 1977. However, we restrict our analysis to 1988–2004, years for which the variable hospital unit was included in the data. The earlier years and 2008 do not include this variable.
21. We follow the suggestion of Aiken and Cheung (2008) to use the census as the main source to study foreign nurses. In their own words: “We believe that Census data is the most reliable source for estimating foreign- educated nurses in the stock of current nurses . . . The NSSRN provides a richer array of data on foreign- educated nurses. However compared to Census data, the NSSRN appears to signifi cantly underes-timate the number of foreign- educated nurses in the U.S.” Our own calculations also suggest high under-reporting. Additionally, the federal government discontinued the NSSRN (the last year was 2008, no survey was conducted in 2012).
22. We use fi ve categories with census data and 11 with the NSSRNs.
23. When using the census, we approximate (potential) experience with age. The California survey asks explicitly for how long has the nurse practiced as an RN, excluding years since graduation during which she did not work as an RN.
24. Descriptive statistics of the NSSRN are presented in Table A2.
The Journal of Human Resources
1024
Table 5
Wage Differences Between Foreign- Educated Nurses and Native Nurses: 1988–2004 NSSRN Data
1 2 3 4 5
Filipino Other
Foreign Filipino Other
Foreign Filipino Other
Foreign Filipino Other
Foreign Filipino Other Foreign
Dependent variable
Log(hourly wage) 0.081*** 0.036*** 0.086*** 0.034*** 0.053*** 0.015* 0.079*** 0.014 0.083*** 0.019*
[0.011] [0.009] [0.010] [0.009] [0.010] [0.009] [0.012] [0.010] [0.011] [0.010]
Sample All All All Hospital Hospital
Controls
Year fi xed effects X X X X X
State fi xed effects, MSA dummy, State*MSA
X X X X X
Sector fi xed effects X X X X X
Job characteristics, includes temporary agency
X X X X
Education fi xed effects X X X
Demographic characteristics X X X
Hospital unit FE X
R2 0.152 0.172 0.201 0.220 0.232
Observations 121,689 121,689 121,689 68,675 68,675
Notes: Data come from the 1988, 1992, 1996, 2000, and 2004 NSSRN. We omit the 2008 NSSRN because it doesn’t include data on hospital unit. The sample is restricted
to RNs aged 20–70. The coeffi cient estimates for Filipino nurses and other foreign nurses for each numbered column correspond to a separate regression of the dependent
variable on a dummy for Filipino nurses and other foreign nurses (the omitted category is native nurses) controlling for various sets of demographics, education, and job characteristics. Demographic controls include age dummies, a female dummy, a dummy for children 0–17, a dummy for children younger than six years old, and a black dummy. Education controls include dummies for having an associate’s degree, a diploma, or a bachelor’s degree. Job characteristics include dummies for working part- time
and for working for a temporary agency. Sectors include hospital, nursing home, physician’s offi ce, schools, nursing education, public health, and other. Hospital units include
intensive care, general bed unit, emergency room, operating room, outpatient, labor and delivery, and other. Columns 5 and 6 include only nurses who reported working in
Cortés and Pan 1025
in better paid units.26 The estimated wage premium for other foreign nurses in the full
specifi cation is small, positive, and only marginally signifi cant.
Using the California Survey of Registered Nurses, our estimate of the premium is similar to the one using the census even though we are focusing on just one state. Interestingly, we fi nd that Filipino and other foreign- educated nurses have about 1.5 more years of experience than comparable natives but have a shorter tenure (by close to a year) at their current position.27 As expected, controlling for experience and its
square reduces the premium but only by about 15 percent. Adding tenure and its square has the opposite effect, such that controlling for experience and tenure leaves the premium basically unchanged. Differences between natives and foreign nurses in the probability of working for a temporary agency, as a travel nurse, or in a job that offers health insurance or a retirement plan are small and have no sizable effect on the premium when they are included as controls in the wage regressions.
C. Which Hospitals Hire Foreign Nurses?
In this section, we turn to hospital- level data to provide additional evidence in support of the idea that the wage premium is likely to refl ect real quality differences between native and foreign nurses. Using data from the 1990 American Hospital Association (AHA) Nursing Personnel Survey (NPS), we show that foreign nurses are hired dis-proportionately by hospitals with better characteristics.28 The 1990 NPS surveyed all
hospitals in the United States and collected detailed information about RN employ-ment and wages (including foreign nurse hiring), education, unions, work schedules, and basic characteristics about the hospital. Close to 20 percent of hospitals reported sponsoring RN recruitment from foreign countries, with the average hospital hiring close to ten foreign nurses in 1989, most of them from the Philippines. Table 6 com-pares the characteristics of hospitals that hired foreign nurses to those that did not. As observed, hospitals that hire foreign nurses are more likely to be private, are much larger as measured by the number of beds and RNs, hire more educated nurses, and have higher educational requirements for the nurse staff. They also pay higher wages. Given that it is likely that part of the differences is explained by the geographic distri-bution of hospitals and foreign nurses (for example, regions that attract more migrant nurses could be areas with a denser and richer population and have larger and higher
26. In a separate analysis, we also examine whether foreign nurses tend to be assigned to skill- intensive units within hospitals. We proxy for skill intensity using the average education level of native nurses in the hospital unit as measured by the share of native nurses with at least a bachelor’s degree working in that unit. Using the 1988–2004 NSSRN, we create a ranking of hospital unit skill intensity by regressing a dummy for whether a native nurse has a bachelor’s degree of more on indicator variables for hospital unit, controlling for year fi xed effects and state*MSA fi xed effects. We fi nd that the intensive care unit (ICU) is by far the most skill- intensive unit followed by labor and delivery. Using this ranking, we examine whether Filipino nurses and other foreign nurses are more likely to report working in the ICU (the most skill- intensive unit) and labor and delivery unit. The results are reported in Table A3. We fi nd that Filipinos are about fi ve percentage points (or about 30 percent) more likely to report working in the ICU while other foreign nurses are about two percentage points more likely to work in the ICU, even after adding all controls. However, they are less likely to work in the labor and delivery unit.
27. See Table A4.
The Journal of Human Resources
1026
Table 6
Which Hospitals Hire Foreign RNs, Controlling for Hospital Location and Type of Hospital
Private 1
Beds 2
Number of RNs
3
Fraction of RNs
with Bachelor’s
4
Minimum BA Required for Nurse Supervisor
5
Minimum Masters Required for Chief
6
Hourly Wages of RNs in:
ICU 7
Maternal- Child
8
Medical- Surgical
Unit 9
Outpatient 10
I. Foreign RN 0.143*** 117.571*** 115.833*** 8.211*** 0.174*** 0.225*** 0.113*** 0.111*** 0.113*** 0.118***
[0.022] [9.256] [10.160] [1.069] [0.023] [0.024] [0.008] [0.009] [0.007] [0.009]
Controls no no no no no no no no no no
Observations 3,246 3,246 2,590 2,688 3,025 3,126 2,311 1,808 2,624 1,984
R2 0.013 0.047 0.048 0.021 0.019 0.028 0.086 0.087 0.081 0.081
II. Foreign RN 0.075*** 68.767*** 63.557*** 4.384*** 0.058** 0.085*** 0.01* 0.010 0.011** 0.02***
[0.023] [8.396] [9.963] [0.976] [0.023] [0.023] [0.006] [0.006] [0.005] [0.007]
Controls:
Hospital type no yes yes yes yes yes yes yes yes yes
State x MSA size FE yes yes yes yes yes yes yes yes yes yes
Hospital service code yes yes yes yes yes yes yes yes yes yes
Observations 3,246 3,246 2,590 2,688 3,025 3,126 2,311 1,808 2,624 1,984
R2 0.240 0.457 0.396 0.447 0.305 0.378 0.679 0.707 0.688 0.664
Notes: “State x MSA size FE” refers to dummies for state interacted with MSA size (six categories), resulting in a total of 209 groups. Other controls include 17 dummies for hospital type and 13 dummies for the type of service the hospital provides. Robust standard errors in brackets.
Cortés and Pan 1027
quality hospitals), the bottom part of the table presents regressions of hospitals’ char-acteristics on a dummy for hiring foreign nurses that control for hospital location (in particular, we include state fi xed effects interacted with six city size dummies). We fi nd that the coeffi cients do go down once we control for location, but for most char-acteristics the differences remain statistically signifi cant and the magnitudes are size-able. For example, ceteris paribus, hospitals that hire foreign nurses have on average 33 percent more beds, hire 42 percent more RNs, are 34 percent more likely to require a BA for nurse supervisors, and 20 percent more likely to require a master’s degree for the chief of nurses. They also pay about 1 to 2 percent more.29
V. Interpretation
What can explain that Filipino nurses earn signifi cantly more than natives even after controlling for detailed job characteristics? Why is the premium observed only for Filipino nurses and not for nurses from other foreign countries? In this section, we explore plausible explanations to these questions.
A. Roy Model of Occupational Choice
In this section, we present a very simple model of occupational choice to help explain why we might observe the positive wage premium for Filipinos. It is a simplifi ed ver-sion of Borjas (1987).
Assume people can choose between two occupations—nursing denoted by n and nonnursing denoted by 0—and for simplicity assume both require the same level of investment (for example, a four- year bachelor’s degree). People are endowed with skill level ε, which is distributed in the population as a standard normal (ε ~ N(0,1)).30
Average wages as well as the return to skill (r) differ by occupation so that the ex-pected wage for individual i in each occupation is given by:
(2) Nursing: w
i,n= wn+rni and (3) Nonnursing: w
i,0 = w0+r0i.
Assuming individuals choose their occupation to maximize earnings, individual i would choose nursing as long as:
(4) w
n−w0>(r0−rn)i.
Case 1: Suppose r0 > rn, the probability that a randomly chosen worker chooses to join nursing is equal to:
29. We obtain coeffi cients of similar magnitude and sign (although these are estimated with less precision) when the explanatory variable of interest is a dummy for hiring Filipino nurses.
The Journal of Human Resources
The selection of nurses in the nursing sector is given by:
(6) E(|nurse=1)= E |i<
Case 2: Suppose r0 > rn, the probability that a randomly chosen worker chooses to join nursing is equal to:
(7) P= Pr[wn−w
The selection of nurses in the nursing sector is given by:
(8) E(|nurse=1) = E |i >
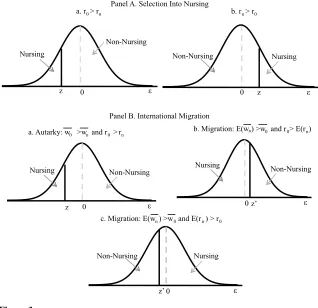
These equations show that the popularity of nursing depends mostly on the relative average wage but that selection depends only on the relative returns to skill: positive selection into nursing occurs if and only if the returns to skill in nursing are higher than in alternative occupations (rn > r0).
Assuming that the average wage in the nursing sector is lower than the average wage in the nonnursing sector (w
n <w0), Panel A in Figure 3 depicts the distribution
of the population between the two occupations for the cases above, assuming wn−w0
and r0−r
n are constant.
Allowing for Migration
Now, suppose that nurses are allowed to migrate but there are no migration possibili-ties for workers choosing nonnursing occupations (a good approximation of the Phil-ippines’ case). We assume that migration increases the average wages for nurses (as would be the case if the source country is a developing country and the host country is a developed country). We further assume that migration also increases the returns to skill. Let w
i,n
m be the wages that individual
i is expected to earn if she works as a nurse abroad (superscript m is for migrant, h is for home), where
(9) w
p be the probability of migra-tion. A risk- neutral worker would choose to become a nurse if:
Cortés and Pan 1029
equal to Φ(z′) and the expected ability of individuals who choose nursing is given by –(ϕ(z′)) / (Φ(z′)). And in the case where E(rn) > r0, the corresponding probability is 1 – Φ(z′) and the expected ability of individuals is (ϕ(z′)) / (1 – Φ(z′)).
Hence, the assumption of higher average wages and higher returns to skill for mi-grant nurses implies that the possibility of migration increases the share of the popula-tion choosing nursing and increases the average skill level of workers who select into nursing. If r
n m
and p are large enough such that prnm+(1− p)r
nh> r0, then we should
observe a shift from negative to positive selection into nursing. Panel B in Figure 3 illustrates the three cases (a) autarky with w
0> wn and r0 > rn, (b) migration with E(wn)>w
0 and r0 > E(rn), and (c) migration with E(wn)> w0 and r0 < E(rn).
In this analysis, we have abstracted from migration costs. Previous work has shown that if migration costs depend on the skill level (negative relationship), in-cluding them in the model might change the nature of selection into migration (Chiquiar and Hanson 2005, McKenzie and Rapoport 2010). In our case, we can
a. r0> rn
z 0
Non-Nursing
Nursing
b. rn> r0
0 z
Non-Nursing Nursing
0 z
Non-Nursing Nursing
0 z’
Non-Nursing Nursing 0 z’
Non-Nursing Nursing
Panel A. Selection Into Nursing
Panel B. International Migration
a. Autarky: w0 >wn and r0> rn b. Migration: E(wn) >w0 and r0> E(rn)
c. Migration: E(wn) >w0 and E(rn) > r0
Figure 3
The Journal of Human Resources 1030
model migration costs as the probability of migration depending on the skill level of the nurse (and continue with the assumption of no migration if in a nonnursing occupation). If so, under the assumption that rnh
<r0, we would fi nd that people with very low skill levels will choose nursing despite having a close to zero probability of migrating as nurses. What share of the population is in this category depends on how much smaller wnh is compared with w
0. On the other end, highly skilled people
will choose nursing because their high probability of migration guarantees that the returns to skill are higher for nursing than for nonnursing. A share of them, how-ever, will not migrate and will drive up the average skill of those who stay. Note that even though there is both positive and negative selection observed for nurses who stay in the Philippines, there is only positive selection for those that end up migrating.
Note also that if the average wage of nurses who end up migrating is much larger than the average wage of nonnurses (w
n m
w
0), a probability of migration that
de-pends on skill will guarantee positive selection of Filipino nurses working abroad even if the returns to skill are not higher abroad. The same applies for the selection of nurses entering the United States; all we need to get positive selection is that the United States pays signifi cantly more and that the probability of fi nding a job here depends on skill. Note that the two other main destinations, the United Kingdom and Saudi Arabia, do not require passing a board examination to get a nursing license.
B. Implications of the Model for the United States and the Philippines
In this section, we consider what this simple model implies for selection into nursing in the United States and in the Philippines, with and without international migration.
1. The nursing sector in the United States and the Philippines
Nursing is a relatively well- paid occupation in the United States (the ratio of the aver-age hourly waver-age of nurses to the averaver-age hourly waver-age of workers with a bachelor’s degree has hovered at around 1.2 for about three decades). Nevertheless, nursing is by no means one of the most profi table occupations, especially as women started entering more prestigious occupations such as medicine, law, and business in large numbers. Additionally, nursing is characterized by having one of the most compressed wage distributions, suggesting relatively low returns to skill. In fact, out of 41 occupations in the 2000 census with more than 80 percent workers with two or more years of college, RNs have the fourth lowest 90 / 10 percentile ratio in hourly wages. As a com-parison, RNs earn on average close to 10 percent more per hour than primary school teachers yet the 75 / 25 percentile ratio for nurses is lower at 1.6 as compared to 1.92 for teachers.31 Therefore, the model implies that nursing will be a reasonably popular
occupation in the United States but nurses will be negatively selected.
Cortés and Pan 1031
A somewhat similar situation would be observed in the Philippines in the absence of international migration. Panel A of Table 7 shows the average wages for the most common skilled occupations in the Philippines, as well as the 75 / 25 percentile ratio. As observed, and in contrast to the United States, nurses’ pay is relatively low.32 On
the other hand, as in the United States, wage dispersion is below average. Therefore, nurses will also be negatively selected but a lower share of the population would choose a nursing career.
2. Philippines’ migration policy and model implications
To analyze the predictions of the model given the Philippines’ migration policy, we start by establishing key important facts.
1. The probability of migrating as a nurse is very high in the Philippines. We have no direct estimate of the share of Filipino nurses that eventually mi-grates, but the comparison of the number of Filipino nurses working in the Philippines and the number working in the United States and other countries suggests that it is very large. Using census data collected in 2000, we count approximately 135,000 Filipino nurses working in their country of origin and close to 80,000 working in the United States. Data from the Philippine Over-seas Employment Administration (2010) suggests that close to 40,000 nurses migrated as contract workers to other countries besides the United States be-tween 2000 and 2002. These numbers taken together imply at the very least as many Filipino nurses working abroad as working in the Philippines, given that we are missing Filipino nurses who moved to countries other than the United States before 2000.
2. The probability of migration for workers in any other skilled occupation is much lower, especially for women. In Panel A of Table 7, we present the share of overseas Filipino workers (OFWs) by skilled occupation and gender. Because the shares are constructed using census data, they provide a lower bound as the census excludes permanent migrants and those who left with their whole family (even if temporarily). As observed, for both women and men nursing has the largest share of OFWs (23 percent for men and 19 percent for women). For women, more than half (53 percent) of all migrant skilled workers are nurses. The census estimates are in line with more recent data provided by the POEA—in 2010, six out of ten females who left the country to work abroad in a professional occupation were nurses (POEA 2010). 3. The average wage for nurses who migrate is very high. Panel B of Table 7
shows the average wage for Filipino nurses by major destination. Even if a nurse ends up migrating to the country with the lowest pay for Filipino nurses, she would still earn about 2.5 times that of the average nurse in the Philip-pines. Wages in the West are much higher, about ten times the average wage for nurses and four to fi ve times the average wage for lawyers and CEOs in the Philippines. Even the average wage for Filipino nurses in the United States is more than double the 99th percentile wage for CEOs in the Philippines.
The Journal of Human Resources 1032
Table 7
Share of Overseas Filipino Workers (OFWs) and Wages by Skilled Occupation in the Philippines and Top Destinations
2000 Philippines Census 2002 Philippines LFS
Males Females (Both Sexes)
Panel A. Share of OFWs by Skilled Occupation and Average Wages Nursing and midwifery
professionals
0.23 0.10 0.19 0.53 10.34 1.67
Directors and chief execu-tives of corporations
0.02 0.00 0.04 0.00 26.34 2.29
Legal professionals 0.02 0.01 0.01 0.00 23.07 1.81 Specialized managers 0.04 0.03 0.02 0.02 17.23 2.08 Production and operations
managers
0.04 0.02 0.01 0.01 16.61 2.08
Government administrators 0.02 0.01 0.02 0.00 16.51 2.03 School supervisors and
principals
0.01 0.00 0.01 0.00 15.40 1.38
Architects and related professionals
0.12 0.04 0.03 0.00 15.06 1.84
Business professionals 0.04 0.05 0.02 0.04 14.46 1.91 Engineers and related
profes-sionals
0.13 0.53 0.04 0.03 13.91 1.80
Life science professionals 0.04 0.01 0.02 0.00 13.82 1.67 Health professionals (except
nursing)
0.06 0.06 0.04 0.09 13.66 1.98
Physicists, chemists, and related professions
0.11 0.01 0.02 0.00 13.36 2.14
Mathematicians, statisticians 0.04 0.00 0.02 0.00 13.09 1.48 College, university teaching
professors
0.01 0.01 0.02 0.02 12.90 1.58
Social and related science professionals
0.04 0.01 0.01 0.01 12.55 2.00
Other supervisors 0.12 0.01 0.03 0.00 11.73 2.05 Elementary education
teach-ing professors
0.01 0.02 0.01 0.13 11.60 1.23
Computer professionals 0.13 0.05 0.07 0.03 11.54 1.69 Customs, taxation, licensing,
welfare professors
0.02 0.00 0.01 0.00 11.35 1.81
Librarians, archivists, and curators
0.09 0.00 0.00 0.00 11.30 1.78
Secondary education teach-ing professors
Cortés and Pan 1033
4. The large cross- country variation in the wages for nurses implies that the re-turns to migration are very heterogeneous. To the extent that highly skilled nurses are more likely to migrate to countries that offer the highest wages, this would result in higher returns to skill for migrant nurses (r
n m
> r n
h).
Our simple model combined with these four facts strongly suggest that the possibil-ity of migration should have the effect of signifi cantly increasing the popularity of nursing in the Philippines and generating positive selection into the occupation. The latter prediction requires that the probability of migration is suffi ciently high and that
2000 Philippines Census 2002 Philippines LFS
Males Females (Both Sexes)
0.02 0.00 0.02 0.01 10.81 1.53
Administrative associate professionals
0.02 0.01 0.01 0.02 10.33 2.09
Technical, vocational instructors
0.03 0.00 0.01 0.00 10.22 1.79
Life science technicians associated professionals
0.04 0.01 0.01 0.00 10.05 1.65
Panel B. Wages for Filipino Nurses in Top Destinations
Destination
Notes: The included occupations in Panel A were chosen based on the share of workers with a college degree and a minimum number of workers. All numbers are computed using workers with a college degree. Data come from the Philippines’ 2000 census and 2002 Labor Force Survey. Numbers reported in Panel B are constructed using confi dential POEA data.
The Journal of Human Resources 1034
there is large variation in nursing wages across destinations to ensure that the returns to skill among migrant nurses is high enough such that the expected returns to skill for nurses (E(rn)= prnm+(1− p)r
nh) is larger than the returns to skill in the nonnursing
sector in the Philippines (r0).
Note that this model also helps to explain why we observe the premium for Fili-pinos but not for nurses migrating from other countries. Unlike the Philippines that specializes in the exportation of nurses, in the two other main source countries, India and Canada, the likelihood of migration and thus the return to becoming a nurse rela-tive to other occupations is not as high. Based on census data, nurses are by far the most common occupation for college- educated Filipinos in the United States (18 per-cent), whereas the top occupations for Canadians are managers (8 percent) and col-lege instructors (6 percent), and for Indians are software developers (17 percent) and computer scientists (8 percent). Only 4 percent of skilled Canadians work as RNs (the same percentage work as physicians) and even fewer Indians (2 percent versus 5 per-cent as physicians). Note also that, even if the likelihood of migration was relatively higher than for other occupations, the overall emigration rate of skilled workers is not as high as in the Philippines. Estimates of the emigration rate to Organisation for Economic Co- operation and Development (OECD) countries by skill from Brücker, Capuano, and Marfouk (2013) show that relative to the Philippines, workers with at least some college in India and Canada are much less likely to migrate (14 percent versus 5 percent).
C. Evidence Supporting the Model
We can test directly if nursing is indeed a more popular occupation in the Philippines than in the United States. In 2010, the number of nurses that passed the Philippines Board Examinations was 70,000; in the United States, among natives, the same number was 120,000. However, the population of the United States is 4.4 times that of the Phil-ippines and its GDP per capita is 12 times higher (there is a very strong cross- country positive correlation between level of development and nurse- to- population ratios).
Providing direct evidence of a greater degree of positive selection of nurses in the Philippines than in the United States to complement the estimation of a positive wage premium for Filipino nurses is a more diffi cult task. Unfortunately, we lack data on direct measures of worker quality in different occupations in the Philippines (for ex-ample, test scores on college admission exams such as the SAT in the United States). We attempt to approach this issue by using the educational attainment of her parents (if she is single) and of her husband (if she is married) as proxy for worker quality. The fi rst is based on heritable ability (Behrman and Rosenzweig 2002, Bacolod 2007) and the intergenerational transmission of human capital (Currie and Moretti 2003), and the second is based on positive assortative mating.33
Our data come from the 1990 and 2000 Filipino censuses. We focus on women ages 20–64 with a bachelor’s degree. Unlike in the United States or other Western developed countries, most adult single women in the Philippines (about 60 percent)