1. Introduction
A new mathematical model (Ibrehem and Al-Salim, 2009) was derived to describe production processes by the most active input variables inside batch reactor as shown in Figure (1). The model was applied to a process of production of bio-diesel from vegetable oils. Production of bio diesel from
New Dynamic Analysis and System Identification of
Biodiesel Production Process from Palm Oil
Ahmmed S. Ibrehem
*and Hikmat S. Al-Salim
Chemical & Petroleum Engineering Department, University of Sedaya, Kuala Lumpur,50603, Malaysia
* Corresponding Author.
E-mail address: [email protected] (Ibrehem) Tel: +061-0149360913, Fax: +061-98-9985241
Bulletin of Chemical Reaction Engineering & Catalysis, 4(2), 2009, 61-68
Received: 12nd November 2009; Revised: 20th Decmber 2009; Accepted: 27th December 2009
Abstract
In this study we present advanced mathematical model was used to capture the batch reactor characteris-tics of reacting compounds new parameters and new a prerequisite average slope analysis (PASA) method for the system dynamic behaviour under different operational conditions is a prerequisite to the good selec-tion for these parameters. The model was applied to batch reactor for the producselec-tion of bio-diesel from palm and kapok oils. Results of the model were compared with experimental data in terms of conversion of transesterification reaction for the production of bio-diesel under unsteady state. A good agreement was obtained between our model predictions and the experimental data. Both experimental and modeling re-sults showed that the conversion of triglycerides to methyl ester was affected by the process conditions and by using PASA that could be achieved by making some deterministic tests either in real data plant or in the physical model that properly and adequately fits the actual process. The input-output relationships are studied using the open-loop dynamic response of the process, which can be determined from the process model by stepping different inputs and recording output responses. Starting from steady state conditions, each input is perturbed with certain magnitude that is enough to show the effect on the system dynamics. The transesterficition process with temperature of about 70 oC, and methanol ratio to the triglyceride of
about 5 times its stoichiometry and the NAOH catalyst of wt 0.4%, appear to be acceptable process condi-tions. PASA shows methanol ratio to the triglyceride has big effect on the system. PASA method can be ap-plied for different processes. © 2009 BCREC. All rights reserved.
.
Keywords: Mathematical model, System identification, Vegetable oil, Catalytic reactor, Dynamic study
vegetable oils received a lot of attention and may be one day will become one of the most important renewable energy sources for transport and house-hold uses (Dunn, 2008). Both Malaysia and Indone-sia have recently started developing bio-diesel de-rived from vegetable oils (Antaresti et.al., 2005) in large quantities using different sources for the oil
(Franceschini and Macchietto, 2007). Production of bio diesel from vegetable oils received a lot of attention and may be one day will become one of the most important renewable energy sources for transport and household uses.
Both Malaysia and Indonesia have recently started developing bio-diesel derived from vegeta-ble oils (Antaresti et.al., 2005) in large quantities using different sources for the oil. What makes bio diesel important is attributed to its chemical and physical properties which closely resemble those of diesel fuel. This has been documented by many authors (Clark et al., 1984; Mittelbach and Tritthart, 1988; Pakpahan, 2001; Legowo, 2001). The bio-diesel cetane number, energy content, viscosity and phase changes are similar to those of petroleum based diesel fuel, but is essentially sulfur free. Bio-diesel offers enhanced safety char-acteristics when compared to diesel fuel. It has a higher flash point and does not produce explosive air/fuel vapors. Generally bio-diesel fuel less toxic than petroleum fuel due to the absence of aromat-ics hydrocarbons. Bio-diesel is made by trans-esterification of triglyceride found in natural oils with methanol in the presence of a catalyst. Transesterification of a vegetable oil was con-ducted as early as 1853 by scientists E. Duffy and J. Patrick, many years before the first diesel en-gine became functional. Rudolf Diesel's prime model, a single 10 ft (3 m) iron cylinder with a flywheel at its base, ran on its own power for the first time in Augsburg, Germany, on August 10, 1893.
In remembrance of this event, August 10 has been declared "International Biodiesel Day.The French Otto Company (at the request of the French government) demonstrated a Diesel en-gine running on peanut oil at the World Fair in Paris, France in 1900, where it received the Grand Prix (highest prize).
This engine stood as an example of Diesel's vision because it was powered by peanut oil a biofuel, though not biodiesel, since it was not transesterified. He believed that the utilization of biomass fuel was the real future of his engine. In a 1912 speech Diesel said, "the use of vegetable oils for engine fuels may seem insignificant today but such oils may become, in the course of time, as important as petroleum and the coal-tar prod-ucts of the present time."
During the 1920s, diesel engine manufactur-ers altered their engines to utilize the lower vis-cosity of petrodiesel (a fossil fuel), rather than vegetable oil (a biomass fuel). The petroleum in-dustries were able to make inroads in fuel mar-kets because their fuel was much cheaper to
pro-duce than the biomass alternatives. The result, for many years, was a near elimination of the biomass fuel production infrastructure. Only recently have environmental impact concerns and a decreasing price differential made biomass fuels such as bio-diesel a growing alternative.
Despite the widespread use of fossil petroleum-derived diesel fuels, interest in vegetable oils as fuels for internal combustion engines was reported in several countries during the 1920s and 1930s and later during World War II. Belgium, France, Italy, the United Kingdom, Portugal, Germany, Brazil, Argentina, Japan and China were reported to have tested and used vegetable oils as diesel fu-els during this time. Some operational problems were reported due to the high viscosity of vegetable oils compared to petroleum diesel fuel, which re-sults in poor atomization of the fuel in the fuel spray and often leads to deposits and coking of the injectors, combustion chamber and valves. At-tempts to overcome these problems included heat-ing of the vegetable oil, blendheat-ing it with petroleum-derived diesel fuel or ethanol, pyrolysis and crack-ing of the oils.
On August 31, 1937, G. Chavanne of the Uni-versity of Brussels (Belgium) was granted a patent for a "Procedure for the transformation of vegeta-ble oils for their uses as fuels" (fr. "Procédé de Transformation d’Huiles Végétales en Vue de Leur Utilisation comme Carburants") Belgian Patent 422,877. This patent described the alcoholysis (often referred to as transesterification) of vegeta-ble oils using ethanol (and mentions methanol) in order to separate the fatty acids from the glycerol by replacing the glycerol with short linear alcohols. This appears to be the first account of the produc-tion of what is known as "biodiesel" today.
More recently, in 1977, Brazilian scientist Ex-pedito Parente invented and submitted for patent, the first industrial process for the production of biodiesel. This process is classified as biodiesel by international norms, conferring a "standardized identity and quality. No other proposed biofuel has been validated by the motor industry." Currently, Parente's company Tecbio is working with Boeing and NASA to certify bioquerosene (bio-kerosene), another product produced and patented by the Bra-zilian scientist.
Research into the use of transesterified sun-flower oil, and refining it to diesel fuel standards, was initiated in South Africa in 1979. By 1983, the process for producing fuel-quality, engine-tested biodiesel was completed and published internation-ally. An Austrian company, Gaskoks, obtained the technology from the South African Agricultural
Engineers; the company erected the first biodiesel pilot plant in November 1987, and the first indus-trial-scale plant in April 1989 (with a capacity of 30,000 tons of rapeseed per annum).
Throughout the 1990s, plants were opened in many European countries, including the Czech Re-public, Germany and Sweden. France launched local production of biodiesel fuel (referred to as diester) from rapeseed oil, which is mixed into regular diesel fuel at a level of 5%, and into the diesel fuel used by some captive fleets (e.g. public transportation) at a level of 30%. Renault, Peugeot and other manufacturers have certified truck en-gines for use with up to that level of partial bio-diesel; experiments with 50% biodiesel are under-way. During the same period, nations in other parts of the world also saw local production of bio-diesel starting up: by 1998, the Austrian Biofuels Institute had identified 21 countries with commer-cial biodiesel projects. 100% Biodiesel is now avail-able at many normal service stations across Europe.
In September 2005 Minnesota became the first U.S. state to mandate that all diesel fuel sold in the state contain part biodiesel, requiring a content of at least 2% biodiesel. In 2008, ASTM published new Biodiesel Blend Specifications Standards. In 2005, Franceschini and Macchietto derived model-based experiment design techniques for bio-diesel process based on experimental data only, while Dunn (2008) derived a mathematical model to cal-culate the temperature effects on the system. The two models did not include the effect of catalysts and concentration of reactants unlike our model which takes into it all variables such as tempera-ture, concentration of reactants, and catalyst. New mathematical model calculates the effects of con-centrations of triglycerides, methanol, catalyst weight percent and temperature of reaction on the percent of conversion.
Based on the Antaresti et.al. (2005) work ex-perimental basics of reactor design and the results of experiments on the various conditions. Design a complete mathematical model of the system by us-ing computer software such as MATLAB, the sys-tem is simulated and results compared to the ex-perimental results and give acceptable results be-tween new model predictions and the experimental data.
In this paper, we address the following ques-tion: what types of input signals are sufficient to completely identify the input/output behavior of a system? In other words, we look for classes x of in-puts with the property that, if a system is stimu-lated with the inputs from the set x and the corre-sponding time record of outputs is recorded, then,
on the basis of the collected information on inputs and outputs it is possible at least theoretically, with no regard to computational effort, and in the absence of noise to obtain a system output which is equivalent to y. By “equivalent” we mean that the estimated system will be completely indistinguish-able from the true system in its input/output be-havior.
2. Modified Mathematical Model
A mathematical model was applied to Antar-esti. et.al experimental work which deals with the relationship between rate coefficient (k) of the re-action with weight percent of NaOH as a catalyst (cat). A numerical polynomial relationship depend-ing on experimental results was developed in our model by using version seven MATLAB software to give high accuracy (more than 99%) in calculating the rate coefficient (k) of the reaction which makes it suitable to use in calculating the rate of reaction (rA), mass balance (CA) and (CB) for the reactor, as
well as energy balance (Treact) for reactor and the
jacket (Tjacket) as shown in Figure (1). The
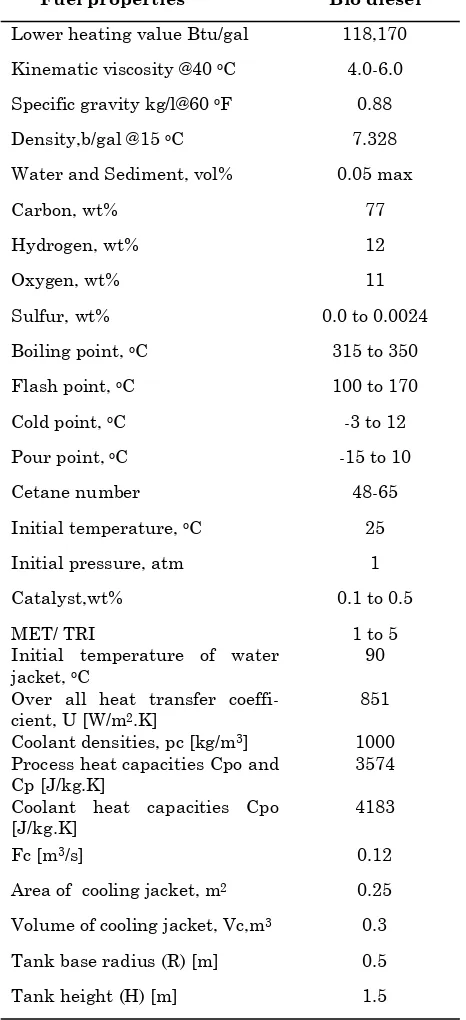
estima-tion of the reactor model parameters are given in Table (1). The relationship between rate coeffi-cients of the reaction with weight percent of NaOH as a catalyst is given by:
Reactor mole balances for triglycerides (A) in vol-ume (v):
Mole in – Mole out + Generation = Rate of accumu-lation of mass
Reactor mole balance for methanol (B) in volume (v):
Mole in – Mole out + Generation = Rate of accumu-lation of mass
Bulletin of Chemical Reaction Engineering & Catalysis, 4(2), 2009, 63
Reactor Energy Balance:
Energy in – Energy out + Energy generated - En-ergy observed = Rate of accumulation
Jacket Energy Balance:
Energy in – Energy out + Energy generated = Rate of accumulation
3. Results and calculations
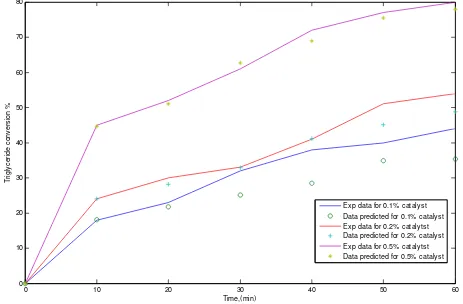
Figure (2) shows the results of our model along with (Antaresti et.al., 2005) results. The comparison between the results of the model pre-sented in this work with the actual experimental data (Antaresti et.al., 2005) is made and gave us high accuracy as shown in Figure (2) for the sys-tem triglycerides conversion for different catalyst weight percent. Weight percentage of catalyst has big effects on triglycerides conversion because the
Bulletin of Chemical Reaction Engineering & Catalysis, 4(2), 2009, 64
dt
Table 1. Physical constants and operating parame-ters for the mathematical model system
Fuel properties Bio diesel
Lower heating value Btu/gal 118,170
Kinematic viscosity @40 oC 4.0-6.0
Specific gravity kg/l@60 oF 0.88
Density,b/gal @15 oC 7.328
Water and Sediment, vol% 0.05 max
Carbon, wt% 77
Cetane number 48-65
Initial temperature, oC 25
Initial pressure, atm 1
Catalyst,wt% 0.1 to 0.5
MET/ TRI 1 to 5
Initial temperature of water jacket, oC
90
Over all heat transfer coeffi-cient, U [W/m2.K]
851
Coolant densities, pc [kg/m3] 1000
Process heat capacities Cpo and Cp [J/kg.K]
3574
Coolant heat capacities Cpo [J/kg.K]
4183
Fc [m3/s] 0.12
Area of cooling jacket, m2 0.25
Volume of cooling jacket, Vc,m3 0.3
Tank base radius (R) [m] 0.5
Tank height (H) [m] 1.5
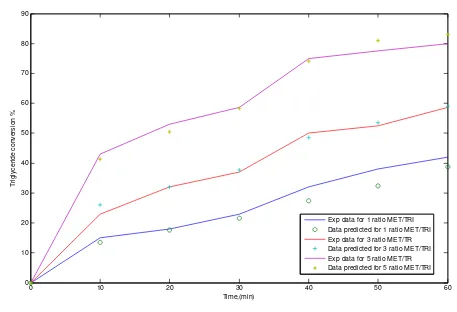
weight percentage of catalyst effects on rate con-stant of reaction that leads to increase the conver-sion as shown in Figure (2) when the catalyst weight percentage increase from 0.1% to 0.2% the conversion increase more than 8%. So, if the weight of catalyst increases to 5% the conversion will increase more than 40% that give us a very good idea about the effects of weight of catalyst in the system. Meanwhile, Figure (3) shows the ef-fects different weight ratio of methanol (MET) to triglycerides (TRI) on triglycerides conversion that give us a very good idea about the accuracy of this model and big effects of increasing ratio of MET/ TRI in the system. The conversion will be in-creased more than 45% if the ratio increases from 1 to 5 as shown in Figure (3). While Figures (4) and (5) show the effects different concentration step changes of TRI on the temperature of reaction with the time and different weight percent of catalyst step change on the concentration of TRI with the
time respectively. Once again there is a good agree-ment between the new model and the actual ex-perimental data.
4. Dynamic Analysis and Identification for Mathematical Model
System identification involves building a dy-namical model from an input/output data and without use of any laws concerning the fundamen-tal nature and properties of the nonlinear system. The batch reactor process involves many variables, which contribute to its operation, and this makes it a Single-Input Single-Output (SISO) process. These variables are classified as follows:
Input or manipulated variables (MVs) are chosen from those variables that have direct effect on the process performance, and practically easy to actuate. In our case, these are: percent of NaOH as a catalyst (Qc) and ratio of MET/ TRI
stoichiome-Bulletin of Chemical Reaction Engineering & Catalysis, 4(2), 2009, 65
0 10 20 30 40 50 60
0 10 20 30 40 50 60 70 80
Time,(min)
T
ri
g
ly
ce
ri
d
e
co
n
v
e
rsi
o
n
%
Exp data for 0.1% catalyst Data predicted for 0.1% catalyst Exp data for 0.2% catalytst Data predicted for 0.2% catalyst Exp data for 0.5% catalytst Data predicted for 0.5% catalyst
try. The controlled variables (CVs) are selected from the process outlet streams that are usually of foremost importance such as the triglycerides conversion (TRI). A schematic diagram represent-ing the previously mentioned variables is shown in Figure (6).
So, the identification steps can be defined for PASA as follows;
1. First step is to make actual calculations for the system from nominal conditions xn,i to calcu-late yn,i.
2. Second step repeat step one with +33% per-turbed parameter input vector (1.33 × xn,i) to
produce the + 33% perturbed output yi matrix. 3. Third subtract each element from matrix in
first step from the corresponding element in matrix in second step and divided the differ-ence by yn,i. (yi- yn,i) / yn,i.
4. Fourth step similarly calculate the change in parameters (xi- xn,i) / xi.
5. Fifth step divided each element in third step by fourth step to produce the sensitivity matrix k. Depends completely on scale matrix without using any a proper factor.
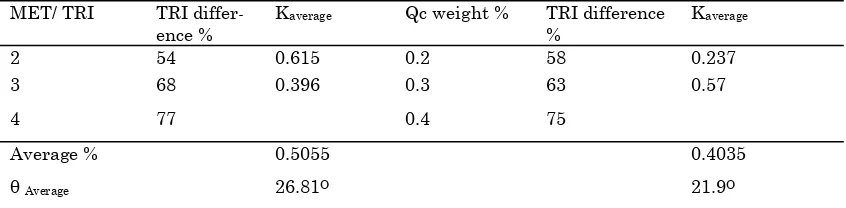
6. Sixth step calculate k matrix for negative direc-tion which mean calculate k+33% and k-33% so as, we can check the effect of each parameters on output as seen in Table (2) .
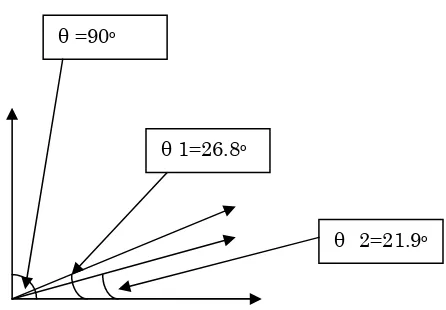
Then find average slope to find average angle ( ) that is represented overall effect of each pa-rameters on the measured output ( 1 represents
the effects of MET/TRI and 2 represents the
ef-fects of catalyst on the system as shown in Figure (7).
From parameters average slope analysis we can see a preliminary partitioning of estimating into different groups depend on slope angle ( ) of kaverage and these groups can be specified as fol-lows;
Bulletin of Chemical Reaction Engineering & Catalysis, 4(2), 2009, 66
0 10 20 30 40 50 60
0 10 20 30 40 50 60 70 80 90
Time,(min)
T
ri
gl
y
c
er
ide
c
o
nv
er
s
ion
%
Exp data for 1 ratio MET/TRI Data predicted for 1 ratio MET/TRI Exp data for 3 ratio MET/TR Data predicted for 3 ratio MET/TRI Exp data for 5 ratio MET/TR Data predicted for 5 ratio MET/TRI
Bulletin of Chemical Reaction Engineering & Catalysis, 4(2), 2009, 67
0 10 20 30 40 50 60
320 325 330 335 340 345 350 355 360 365
Time (min)
T
e
m
pera
ture k
Figure 4. Effect of concentration step change of TRI on the temperature of reaction with the time (concentration of TRI=2kmol/m3 from time=0 min until 14min then concentration of TRI=0.5 kmol/m3 at time 14.5min).
0 10 20 30 40 50 60
0.75 0.8 0.85 0.9 0.95 1
Time (min)
C
onc
ent
rat
ion m
ol
/m
3
Figure 5. Effect of weight percent of catalyst step change on the concentration of TRI with the time (weight percent of catalyst =0.5 from time=0 min until 15min then weight percent of catalyst =0.1 at time 14 min).
Figure 6. Representation of variables in bio diesel system as a MISO system BATCH
REACTOR BIO DIESEL MET/ TRI
Qc
TRI
Manipulated
Variables Out put
Table 2. Calculate the percent difference for output profile
MET/ TRI
TRI differ-ence %
Kaverage Qc weight % TRI difference
%
Kaverage
2 54 0.615 0.2 58 0.237
3 68 0.396 0.3 63 0.57
4 77 0.4 75
Average % 0.5055 0.4035
• ( ) ≥ 20o: Large effects on the system.
• 20o > ( ) > 15o: Middle effects on the system.
• 15o≥ ( ) ≥ 10o: Weak effects on the system.
• 10o < ( ): Can not be established.
5. Conclusion
New identification and analysis for new dy-namic model for bio diesel was developed in this work and a new dynamic bio-diesel model was es-tablished in this work by using three differential equations mass balance equation for reactor sys-tem, heat balance equation for reactor system and heat balance for cooling jacket. New technique is used in this model to calculate rate constant by depending into account experiments results be-tween the catalyst weight percent and rate con-stant to produce third order polygon equation. This model takes into account the presence of catalyst weight percent, ratio of methanol to triglycerides, temperature of reaction, and temperature supply for reactor on conversion percent of triglycerides which depend on these parameters. The model pre-sented in this work was compared with experimen-tal data at unsteady state for conversion percent-age of triglycerides of the bio-diesel batch reactor process. From its observed accuracy, we can con-veniently use this model as a predictive tool to study the effects of operating, and kinetic parame-ters on the reactor performance. The results be-tween the new model and the experimental results gave a good indication about the behavior of the present model which is very close to experimental data.
This model takes into account the presence of particles participating in the reaction with TRI conversion which depend on the ratio MET/TRI and catalyst weight percentage. The comparison results between these two inputs gave good indica-tion about the behavior of the present model the
identification results gave good indication for ef-fects of the ratio MET/TRI and catalyst weight per-centage on the system. The ratio MET/TRI has more a great affects on the system compared to the catalyst weight percentage as see in Table (2) and Figure (7). This kind of identification and analysis method can be used to any system to identify which is the best input variables that effects on any system
REFERENCES
[1] Ahmmed S Ibrehem, andHikmat S Al-Salim.
Advanced Mathematical Model to Describe the Production of Bio-diesel Process, Bulletin of Chemical Reaction Engineeringt & Cataly-sis, Article Inpress, 2009
[2] Clark,S.,J.,Wagner, L., Schrock, M.D., and Pinnaar,P.G.1984.Methyl and ethyl esters as renewable fules for diesel engines. J. Amer. Oil Chem. Soc.,61,1632-1638.
[3] Legowo, E.2001,Experience in Palm Biodiesel uses for Transportation, Proceedings of the International Biodiesel Workshop, Medan, Indonesia.
[4] Mittelbach and Tritthart, P.1988.Diesel fuel derived from vegetable oils, III Emission test using methyl esters of used frying oils J. Amer. Oil Chem. Soc., 65, 1185-1187.
[5] Muniyappa, P.R.,Brammer, S.C., and Noureddini,H.1996.Improved conversion of plant oils and animal fats into biodiesel and co-product, Biodiesel Technology, 56,19-24. [6] Pakpahan,A.2001. Palm Biodiesel: Its
po-tency,technology,business prospect and envi-ronmental implication in Indonesian, Pro-ceeding of the International Biodiesel Wwork-shop, medan, Indonesia.
[7] Antaresti. et.al., 2005. The Biodiesel Produc-tion Process from Vegetable Oil, Dev. Chem. Eng. Mineral Process. 13(5/6), pp.687-692,2005.
[8] Dunn, R.O. 2008. Effect of temperature on oil stability index (OSI) of biodiesel. Energy and Fuels. 22:657-662.
[9] Gaia Franceschini and Sandro Macchietto, Validation of a Model for a Biodiesel Produc-tion Process through Model-Based Experi-ment Design for Parameter Precision, Com-puters and Chemical Engineering, 24, 1261-1267.
[10] SAE Technical Paper series no. 831356. SAE International Off Highway Meeting, Milwau-kee, Wisconsin, USA, 1983
Bulletin of Chemical Reaction Engineering & Catalysis, 4(2), 2009, 68
1=26.8o
2=21.9o
=90o