Copyright: © 2016 Pacheco E, et al.
Open Access
Research Article
Journal of Veterinary Research and Animal Husbandry
Social Status Affects Welfare Metrics of Group-Housed Gestating Sows
Eridia Pacheco and Janeen L Salak-Johnson*
Department of Animal Sciences, University of Illinois, Urbana-Champaign, IL, USA
Abstract
Gestating sows experience various stressors which may have negative consequences on health and well-being. Aggressive encounters are inevitable when gestating sows are mixed and hierarchies are formed; therefore, the aim of this study was to evaluate the impact of social status on the wellbeing of gestating sows housed in small group pens using multiple welfare metrics. Subpopulation of sows (n = 64)
were identified based on social status from a larger scale study designed
to assess effects of diet and feeding system on sow well-being. On gestational d37, four pens of nine multiparous sows (n = 36 sows/block) across four blocks were subjected to a feed competition test in order to calculate dominance value (DV) for each sow within the pen to determine social status. Dominant (DOM) sows had the highest DV and submissive (SUB) sows the lowest DV. Sow body weight (BW), back fat (BF), body condition score (BCS), cortisol, glucose, and immune measures were obtained on gestational d30 (prior to mixing), 70, 90, 104, and 135 (end of lactation). Lesion scores were recorded every third day for two weeks post mixing, and then bi-weekly. Behavioral observations were registered starting on gestational d 38 (post-mixing), and then for every three weeks. Socially, SUB sows had less neutrophils, lower N:L ratio, and greater plasma IL-12 than DOM sows (P < 0.05). SUB sows spent more (P < 0.05) time sitting and laying, while DOM sows spent more (P < 0.01) time sham-chewing. Lesion scores increased at mixing but decreased over time; except for DOM sows had less severe scores (P < 0.01) late in gestation. DOM sows gained more (P < 0.01) BW from gestational day 30 till 70. DOM sows had more (P < 0.01) total piglets born and born alive, but higher (P < 0.01) piglet mortality compared to SUB sows. There were minimal negative effects on sow well-being based on social rank in the short-term, but socially DOM and SUB sows evoke different biological responses in attempt to adapt to their environment which may impact behavior, physiology, and productivity in the long-term.
Keywords: Gestation; Group; Stress; Social Status; Sows; Well-being
Introduction
Assessing stress is often challenging because animal factors including genetics, age, physiologic state, and social relationships affect the biological response(s) to the stressor and the biological consequences [1]. Sows kept in groups during gestation experience acute stress, but some sows can experience chronic stress caused by ongoing social stress. Social status can differentially affect the biological response to a stressor which may ultimately affect animal well-being [2]. Social stress is a welfare concern associated with group-housed sows. Establishment of social hierarchy is necessary to stabilize the dynamics of the group [3], however if the aggression is intense and prolonged it can lead to stress and compromised well-being [4]. Group housing of gestating sows provides the opportunity for increased social interactions, but one of the welfare tradeoffs is increased aggression (social stress) which may negatively impact wellbeing of some sows [5,6].
Aggression is inevitable for establishment of social hierarchy which helps to reduce overall aggression and tension within the group, but may be stressful for sows, especially submissive ones. Dominant sows are more active and aggressive than submissive
sows [7]. Submissive sows receive more aggression and are displaced more often from the feeder and other resources (e.g., enrichment material), which results in lower feed intake among lower ranked sows [7-9]. Moreover, 46% of sows (primarily submissive sows) housed in pens with an electronic feeding system (e.g., Fitmix) were found to require more human intervention to help sows adapt to feeding system and 8.3% of those sows failed to adapt [10]. Social status is positively correlated with sow body weight and parity [10,11], with submissive sows having lower body weight and greater skin lesion scores or injuries than dominant sows [9,12,13]. Submissive sows also have lower farrowing rates [13,14] and less piglets born [12,14]. Conversely, others have found that dominant sows had less piglets born alive, more stillborns, and lower litter weights [13], while others found no effect of social status on sow productivity [10,11].
Social status is an important animal factor that can affect the biological response and consequence of stress. Therefore, the objective of this study was to determine the effects of social status on the stress responsiveness and well-being of gestating sows housed in small group pens equipped with a competitive feeding system using multiple welfare metrics across one farrowing.
Materials and Methods
Animals and housing
The animal protocol for this study was approved by the University of Illinois Institutional Animal Care and Use Committee.
A subpopulation of primiparous (first pregnancy; n = 21) and multiparous sows (parities 2 to ≥ 4, n = 43) derived from Genetiporc
Fertilis 25 commercial line were housed at the University of Illinois Swine Research Center between September 2013 and June 2015 in groups of nine sows per pen. Sows (n = 64) used in this study were from a larger scale study of 180 gestating sows. Immediately following the feed competition test, sows were moved as a group to their assigned group pen. Sows were fed as a group at 0630 h daily in individual feeding stalls and had ad libitum access to water via individual nipple waterers. Sows were housed in
group-pens at a floor-space allowance of 1.7 m2 /sow and each pen was
fitted with either 0.6 m or 1.8 m long feeding stall. Sows were fed fiber supplemented gestation diet containing either 30% wheat
middlings, 15 % soy hulls or 30% DDGS (Distiller’s dried grains with solubles), 30% corn germ meal. Diets were formulated to meet or exceed NRC requirements [15], therefore, sows received 6,700 kcal ME/d from gestational d 35 to 90 and 10,720 kcal ME/d from d 91 to 104.
Feed competition test and sow behavior
At gestational d 37, groups of nine pregnant sows were subjected to a feed competition test as previously described to determine social status [16]. Nine sows were placed in a non-experimental pen (4.10 m × 4.10 m) with one feeder and no water. Initially,
sows were acclimated for five minutes, and then 4 kg of feed was
added to the feeder. During the 30-min test period, behaviors were Received Date: May 27, 2016, Accepted Date: June 30, 2016, Published Date: July 11, 2016.
captured using EverFocus EQ120A/EN colored cameras (EverFocus Co., LTD., Duarte, CA) located above the non-experimental pen. Data were acquired using Geovision GVd1240 video capture card
(Geovision, Inc., Irvine, CA). Sow behaviors included fight, bite,
push, chase, and displacement from feeder (Table 1) and aggressive interactions were also registered which included the “initiator” and “receiver” during each encounter. Based on all aggressive interactions, dominance values (DV) were calculated for each sow within the group. The equation used: DV = aggressive encounters initiated/ (aggressive encounters initiated + encounters received).
Briefly, the pair of sows within each group with the highest DV were identified as dominant (DOM) and those with lowest as
submissive (SUB). Data was always collected on the entire group,
but analysis reported within is only for those sows identified as
either DOM or SUB. Moreover, live behavioral observations and video-records were used to register behaviors during feeding,
including the first feeding period post-mixing, and then every three
weeks thereafter until sows were moved to farrowing facility. Other behaviors captured and viewed using EZViewLog (Geovision, Inc., Irvine, CA) included eat, drink, sham-chew, oral-nasal-facial (ONF), locomotion, stand, sit, and lay at various time points including 30 mins prior to and 30, 60, 90, 120 minutes post-feed delivery for the
first two-days post-mixing and then on a bi-weekly basis, thereafter
(Table 1). Observers were blinded to sow social rank, therefore all behavior data was collected on all sows within the group.
Blood collection and plasma samples
Sows were nose-snared and 15 mL of blood was collected via jugular venipuncture using syringes containing sodium heparin on gestational d 30, 70, 90, 104, and again at the end of lactation. Total white blood cell counts (WBC) were made electronically using
a Coulter Z1 particle counter (Beckman Coulter) by adding 10 μL of whole blood to Isoflow (10 mL; Beckman Coulter, Beckman,
FL), and red blood cells were lysed with Zap-o-globin (Beckman
Coulter). Whole blood smears were made, fixed in methanol, stained with Hema-3 staining system (Fisher Scientific, Houston,
TX) and viewed under a light microscope to determine leukocyte differential counts. Whole blood was centrifuged and plasma was aliquoted and stored at -80°C for later analysis.
Plasma analysis
Total plasma cortisol was measured on gestational d 30 (baseline) and 90 using a commercially available RIA cortisol kit,
following manufacturer’s protocol, with minor modifications. Briefly, in duplicate, 25 μL of sample or standard were added to
antibody-coated tubes and then 1 mL of radiolabeled (125I) cortisol was added to tubes, vortex, and incubated for 45 min in water bath at 37°C. The liquid phase was aspirated and radioactivity was counted with a gamma counter. Standards were made in stripped porcine plasma (MP Biomedicals, Santa Ana, CA) and the standard
curve based on 0, 8, 16, 32, 62.5, 125, and 250 ng/μL. Intra- and
inter-assay CV were 9.1% and 8.3% respectively, and sensitivity of the assay was 3 ng.
Plasma IL-12 was also measured on gestational d 30 (baseline) and 90 as an immune marker related to subpopulations of lymphocytes using a commercially available ELISA kit, following
manufacturer’s protocol (R&D Systems, Minneapolis, MN). Briefly, in duplicates, 100 μL of diluted sample or standard and 50 μL of
assay diluent were added to 96-well microplate coated with a
monoclonal antibody specific for porcine IL-12/IL-23 p40. Plates were incubated for 2 hours at room temperature and washed five times. Conjugate solution (200 μL) was added, plates incubated for 2 hours, and then washed five times. Substrate solution (120 μL) was
added and plates incubated for 30 minutes at room temperature (protected from light), and then reaction was stopped. Plates were
read using a microplate reader (Thermo Scientific Instruments) at
a wavelength 450 nm. A standard curve based on 0, 47, 94, 188, 375, 750, 1500, and 3000 pg/mL was used.
Body condition and skin lesion scores and back fat depth
Sow body condition score (BCS) were taken on gestational d 30, 90, 104 and end of lactation ± 1 day for all sows in the pen. Using the visual-appraisal (sow’s rear aspect) method described by Coffey RD, et al. [17] and Salak-Johnson JL, et al. [18], sow BCS (1 = emaciated to 5 = obese) was assessed by trained, experienced university personnel were blinded to social status category of the sows. Sow body lesions scores were assessed prior to mixing (day
0), one day after mixing, and every three days for the first two
weeks post-mixing, and then on bi-weekly basis until gestational d 104, and again at the end of lactation. Body locations used to assess lesion scores included the head, ears, neck, chest/breast, shoulders, back, udder, rear, vulva, perineum, legs, and hooves [14]. Lesion scores were based on the presence or absence of a new or old lesion in conjunction with severity of the wound (0 = normal/no lesions; 1 = dehairing, callus, balding; 2 = redness, swelling; 3 = swelling plus callus, abscess; 4 = moderate wound, scabbed over scratch; 5 = marked wound, fresh scratch; and, 6 = severe wound, open wound;
and 7 = severe swelling) with minor modifications [18,19]. Sows received both an average score for each specific body region on a
particular day and a total lesion score across all body regions.
Sow- and litter-related measures
Sow body weight (BW) and back fat depth (BF) were taken on gestational d 30, 70 (BF excluded), 90, 104, and end of lactation (~ d 131), ± 1 d. Sow BF depth was measured using a longitudinal imaging ultrasound scan (Aloka-500V machine, Hitachi Aloka, Walllingford, CT) cranial to last rib. Litter-related traits included total number of piglets born and born alive, and numbers of
females, males, stillborn, mummified, laid on, euthanized, and total mortality (no. of stillborn + no. of mummified + no. of laid on + no.
Table 1: Definitions of observed and registered behaviors.
Behavior Description
Aggressive
Bite Sow opens and closes mouth near or on any part
of another sow
Chase Sow aggressively pursues another sow
Push Sow hits another sow with head or snout
Fight Vigorous reciprocated aggression (repetitive bite/
push) by sow
Displacement Sow aggressively displaces another sow from
feeder space
Threat Sow displays aggressive act without making
physical contact
Others
Lay Sow reclining in lateral or ventral position
Sit Sow supported by two front legs
Stand Sow supported by all four legs
Locomotion Sow supported by all four legs and in motion
Eat Snout/mouth of sow in contact with feed (in
presence of feed)
Drink Snout/mouth of sow in contact with nipple
waterer
Sham-chewing Empty mouth moving in a repetitive chewing
motion by sow
Oral-nasal-facial (ONF) Snout/mouth of sow in contact with any object
of euthanized), and piglets weaned. Calculated litter traits included litter BW at birth, adjusted litter BW at birth (adjusted by number of piglets born), litter wean BW, adjusted litter wean BW (adjusted by number of piglets weaned), and mean piglet weaning BW.
Statistical analysis
All data were analyzed with the mixed models procedure of SAS (SAS Inst. Inc., Cary, NC), with repeated measures. All traits were tested for normality using Kolmogorov-Smirnov and Shapiro-Wilk tests. A natural-logarithmic transformation was applied to those variables that exhibited a skewed distribution. A linear
mixed-effects model was used to analyze measurements with fixed effect
of sow social status (DOM or SUB). A random effect of replicate was included in the model to account for potential environmental and management differences across groups. The model for physiological measures also included day of measurement (levels varies dependent on measurement). The behavior model for some measure included day post-mixing. For ordinal variable, lesion scores, data were analyzed using PROC GLIMMIX (SAS Inst. Inc., Cary, NC). Least square means were generated and separated
statistically with pair wise t-tests (PDIFF option). Significance was set at P ≤ 0.05, whereas trends were discussed at P ≤ 0.10.
Results
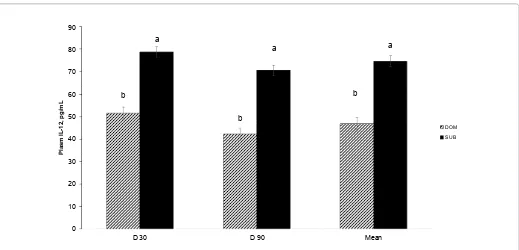
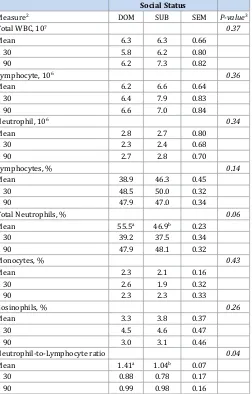
Sow social status had no effect on any functional immune traits, including mitogen-induced lymphocyte proliferation of both T- and B-cells and natural killer cell cytotoxicity (data not shown), but plasma IL-12 was affected social status (Figure 1). Mean plasma IL-12 concentrations were greater (P < 0.0001) among SUB sows compared to DOM sows and SUB sows had greater (P < 0.001) plasma IL-12 at gestational d 30 and 90 (Figure 1). Differential leukocytes populations indicative of stress also tended to be affected by sow social status (Table 2). Mean percentage of neutrophils (P = 0.06)
and neutrophil-to-lymphocyte ratio (N:L; P < 0.05) were greater for socially DOM sows compared to SUB sows (Table 2). DOM sows also had greater percentage of neutrophils at gestational d 104
90
80
70
60
50
40
30
20
10
0
D 30 D 90 Mean
b
b a
a a
b
DOM SUB
Pl
a
s
m
I
L
-1
2
,
p
g
/m
L
Figure 1: Main effect of sow social status (P < 0.0001) on mean and gestational d 30 (prior to grouping) and 90 concentrations of plasma IL-12 (mean ± SEM) for group-penned sows during gestation. Socially, SUB sows had greater plasma IL-12 compared to dominant sows at all time points. DOM = dominant, SUB = submissive.
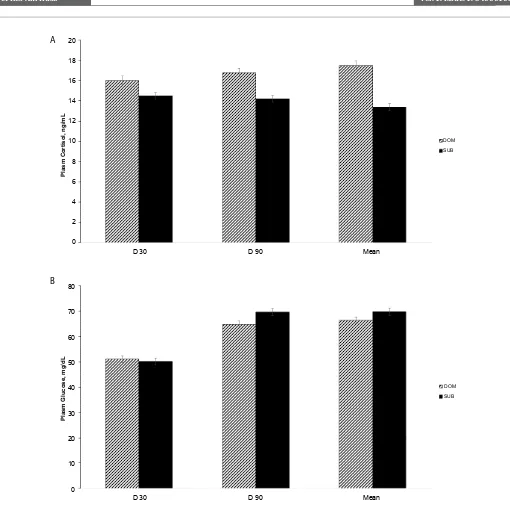
(55.4 vs. 46.2, SEM = 0.32) compared to SUB sows. Socially, DOM sows also had a greater N:L ratio (1.7 vs 1.0; SEM = 0.11, P < 0.05) at gestational d 104 and end of lactation (d 135; 2.8 vs 2.1, SEM =0.17, P < 0.05). There was a tendency (P = 0.10) for mean cortisol (Figure 2A) and glucose (Figure 2B) to be affected by sow social status, with cortisol being lower and glucose being higher for SUB sows compared to DOM sows.
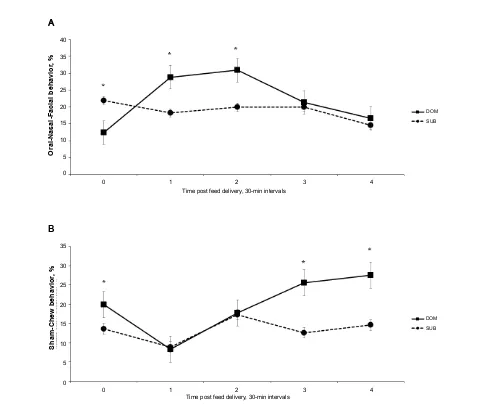
Main effect of sow social status occurred for sit, lay, and sham-chew behaviors (Table 3). Socially, SUB sows spent more time sitting (P < 0.001) and lying (P = 0.05) compared to DOM sows, while DOM sows spent more (P < 0.01) time sham-chewing (Table 3). An interactive effect of social status by time of feeding occurred for stand and drink behaviors (Table 4); prior to feeding, DOM sows spent more time standing, but less time 30-min post-feeding (P < 0.0001) and more time (P < 0.05) drinking 30-min post-feeding compared to SUB sows (Table 4). Socially, DOM sows spent more (P < 0.01) time ONF (A) at 30 and 60 mins post-feeding and more (P < 0.01) time sham-chewing (B) at 90 and 120 mins post-feeding (Figure 3). Prior to feed delivery SUB sows displayed more ONF behavior (Figure 3A).
At mixing, total lesion scores were similar between DOM and SUB sows (13.1 vs. 9.9, SEM = 1.2) and 24 hour post-mixing DOM sow were slightly higher than SUB sows (29.2 vs. 26.4, SEM = 1.7), but the magnitude of increase was much greater among SUB sows. Mean total lesion severity scores were greater (P = 0.005) among SUB sows, but DOM sows had more severe (P = 0.0003) udder (1.1 vs. 0.5; SEM = 0.11) and (P < 0.09) back lesion scores (2.1 vs. 1.6; SEM = 0.16) than SUB sows.
vs 16.9 mm; SEM = 0.03). Socially, DOM sows had greater (P < 0.01) total piglets born and born alive than SUB sows, but total piglet mortality was greater (P < 0.05) for DOM sows (Table 6). Mean piglet weaning weight tended to be greater (P = 0.14) for SUB sows compared to DOM sows (7.1 vs. 6.7 kg, SEM = 0.13), even though
number weaned was similar.
Discussion
The stress response and consequences on health and well-being is dependent on characteristics of the stressor and the animal, with social status being an important factor that may have greater impact on the outcome than the stressor per se [2]. The present study was designed to test the hypothesis that social status of gestating sows housed in group pens may differentially affect well-being in response
to increased aggression (social stress). Dominant and submissive sows apparently evoked the appropriate biological response to cope with the constraints of the group-housing environment with minimal consequences on well-being in the short-term [9]. However, in the long-term it is plausible, that the welfare tradeoffs may be greater in terms reproductive performance and (or) health based on social status. Social stress affected maternal behavior in female [20], while social status affected sexual motivation among submissive sows [21]. Others have shown that in pigs, social stress can impair immune responsiveness to viral vaccine and consequently impair protection against infectious challenges [22]. Taken together, these data imply sow social status is an important factor to consider when managing sows in group housing system since sow social status differentially affected welfare metrics.
A
B 20
18
16
14
12
10
8
6
4
2
0
D 30 D 90 Mean
DOM SUB
D 30 D 90 Mean
DOM SUB
Pl
a
s
m
C
o
rti
s
o
l,
n
g
/m
L
Pl
a
s
m
G
lu
c
o
s
e
,
m
g
/d
L
80
70
60
50
40
30
20
10
0 A
In this study, we speculate that socially dominant sow may have experienced prolonged “stress responsiveness” when housed in small group pens in order to maintain social status. During gestation, dominant sows continuously engaged in aggressive encounters, especially at feeding time and often displaced other sows from the feeder (unpublished data). Moreover, dominant sows spent less time sitting and laying, but more time standing. They also displayed more oral-nasal-facial and sham-chew post-feeding compared to submissive sows. Surprisingly, a classic indicator of acute stress - N:L ratio - was greater among dominant sows throughout gestation and lactation, this is not typical stress response among animals experiencing chronic stress. It is plausible that the energetic tradeoff associated with maintaining social rank is more costly to the dominant sow than submissive sow. It is plausible that as pregnancy progresses the energy demand among dominant sows is greater because of the drive to maintain social rank and during late gestation the demand is exacerbated in terms of sow- and litter-related traits.
Research has shown reduced litter performance in terms of litter size and birth and weaning weights for dominant sows but increase in number of piglets weaned for lower ranked sows [13].
Zhao and colleagues speculated that the biological cost to meet milk production demand is greater, thus lactation requires more body reserves resulting in less back fat depth and body weight among submissive sows at end of lactation [13]. We speculate that less body weight gain during gestational days 30 to 70 was partly due to submissive sows being lighter at the start of the study and upon mixing until social hierarchy was established and until they behaviorally adapted to aggressive encounters during feeding. Based on live behavioral observations, submissive sows were displaced more often from the feeder (early-on), thus not consuming their feed allotment resulting in less BW gain during early to mid-gestation. Moreover, in our study submissive sows had less back fat overall, but had similar body weight and gain during late gestation and through lactation compared to dominant sows. Both dominant and submissive sows weaned same number of piglets, submissive sows tended to have heavier weaned piglets. Thus, we speculate that maintaining social rank in a group housing systems has a higher biological cost for higher ranked sows in terms of sow-related traits than their lower ranked counterparts.
In general, acute stress may suppress, enhance, or have no effect on the immune system, whereas chronic stress often suppresses 40
Time post feed delivery, 30-min intervals
Time post feed delivery, 30-min intervals A
the immune system, thus compromising animal health and well-being [2]. In this study, measures of innate (i.e. natural killer cell cytotoxicity) and adaptive (i.e. both T- and B-cell mitogen induce
Social status
Behavior2 DOM SUB SEM P-value3
Stand
Percentage 32.7 35.4 2.6 0.40
Frequency, no. 360 404
Sit
Percentage 1.9d 6.6c 1.0 0.0003
Frequency, no. 31 53
Lay
Percentage 9.1b 12.8a 1.8 0.05
Frequency, no. 83 150
ONF
Percentage 22.4 19.0 2.5 0.30
Frequency, no. 284 343
Sham Chew
Percentage 19.8a 13.4b 2.1 0.01
Frequency, no. 233 172
Eat
Percentage 9.2 9.8 1.4 0.88
Frequency, no. 95 111
Drink
Percentage 4.7 2.9 1.1 0.21
Frequency, no. 57 38
Locomotion
Percentage 0.03 -0.10 0.33 0.76
Frequency, no. 5 3
Table 3: Means (± SEM) for main effect of social status on percentage of time spent performing behaviors during observational period for
gestating sows housed in group pens1 (Means within a row lacking
common superscript letter a,bdiffer, P ≤ 0.05 and c,d differ, P ≤ 0.001. 1Data
represent 64 pregnant sows across 4 replicates, with sow as experimental unit based on social status; dominant = DOM, submissive = SUB. 2Behavior
is reported as means ± SEM for the percentage of time spent during the observational period for each behavior. Oral-nasal-facial = ONF behavior.
3Probabilty value for sow social status, Total frequency = 2,422). Social Status
Measure2 DOM SUB SEM P-value3
Total WBC, 107 0.37
Mean 6.3 6.3 0.66
d 30 5.8 6.2 0.80
d 90 6.2 7.3 0.82
Lymphocyte, 106 0.36
Mean 6.2 6.6 0.64
d 30 6.4 7.9 0.83
d 90 6.6 7.0 0.84
Neutrophil, 106 0.34
Mean 2.8 2.7 0.80
d 30 2.3 2.4 0.68
d 90 2.7 2.8 0.70
Lymphocytes, % 0.14
Mean 38.9 46.3 0.45
d 30 48.5 50.0 0.32
d 90 47.9 47.0 0.34
Total Neutrophils, % 0.06
Mean 55.5a 46.9b 0.23
d 30 39.2 37.5 0.34
d 90 47.9 48.1 0.32
Monocytes, % 0.43
Mean 2.3 2.1 0.16
d 30 2.6 1.9 0.32
d 90 2.3 2.3 0.33
Eosinophils, % 0.26
Mean 3.3 3.8 0.37
d 30 4.5 4.6 0.47
d 90 3.0 3.1 0.46
Neutrophil-to-Lymphocyte ratio 0.04
Mean 1.41a 1.04b 0.07
d 30 0.88 0.78 0.17
d 90 0.99 0.98 0.16
Table 2: Means (± SEM) for main effect of social status on numbers and percentages of leukocyte populations prior to mixing (gestational d 30 - baseline) and gestational d 90 for group-housed sows1 (a,bWithin a row,
means without a common superscript differ, P ≤ 0.05. 1Data represent 64
pregnant sows across 4 replicates at gestational days 30, 70 and 90, only, with sow as the experimental unit. 2White blood cells = WBC; Mean = mean for specific measure across all gestational days; Gestational day = d 30
post-breeding and d 90; Dominant = DOM, Submissive = SUB. 3Probabilty
value for sow social status).
proliferation) immune function were not affected by sow social status (data not shown), while others have reported social status effects on pig immune status [2,23]. Surprisingly, submissive sows had enhanced mean IL-12 concentrations and IL-12 was also greater at gestational days 30 and 90, but no differences were found for other immune traits associated with IL-12. This was unexpected because IL-12 is a crucial immunoregulatory cytokine responsible for maintenance of T-helper 1 and T-helper 2 cytokine balance
[24], and this balance is significantly disrupted by chronic stress
[25]. In fact, a decrease in IL-12 often shifts the immune response
DOM SUB
Post-feeding, minutes Post-feeding, minutes
Behavior2 pre -30 30 60 90 120 pre-30 30 60 90 120 SEM P-value3
Stand, % 65.5a 9.8d 30.8c 30.3c 27.3c 52.4b 24.4c 32.1c 38.3c 29.8c 4.9 0.0001
Sit, % -0.18 -0.86 2.4 3.1 5.2 4.0 1.9 6.81 6.3 14.1 1.9 0.10
Lay, % 2.8 2.8 8.9 13.1 17.8 5.8 6.3 10.7 18.0 23.2 3.4 0.94
Eat, % -0.19 40.8 4.0 2.4 -1.3 0.35 36.8 8.8 3.3 -0.16 2.7 0.15
Drink, % -0.43c 11.1a 4.9b 4.2b,c 4.6b,c 0.58b,c 3.5b 3.9b 1.5b 5.0b 2.1 0.03
Locomotion, % 0.38 -0.06 -0.36 0.24 -0.06 -0.04 -0.29 -0.29 0.05 0.05 0.62 0.96
Table 4: Interactive effects of sow social status and time of feed delivery on behaviors of group-housed gestating sows 30-min prior to feed delivery up to 120 minutes post-feeding1 (a-d Means within a row with different superscripts differ (P ≤ 0.05). 1Data represent 64 pregnant sows across 4 replicates during
and after feeding, with sow as the experimental unit. 2Behavior is reported as means ± SEM for the percentage of time spent during the observational
Social Status
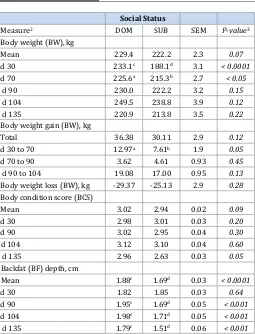
Measure2 DOM SUB SEM P-value3
Body weight (BW), kg
Total 36.38 30.11 2.9 0.12
d 30 to 70 12.97a 7.61b 1.9 0.05
d 70 to 90 3.62 4.61 0.93 0.45
d 90 to 104 19.08 17.00 0.95 0.13
Body weight loss (BW), kg -29.37 -25.13 2.9 0.28
Body condition score (BCS)
Table 5: Means (± SEM) for main effect of social status on sow-related traits prior to mixing (gestational d 30) and throughout gestation and end of lactation for group-housed sows1 (Within a row, least square means ±
standard error (SEM) lacking common superscript letter a,bdiffer, P ≤ 0.05
or c,ddiffer, P ≤ 0.001). 1Data represent 64 pregnant sows across 4 replicates,
with sow as the experimental unit. 2Body weight = BW; Gestational day =
d 30 post-breeding, d 70, d 90, d 104, and d 135 (end of lactation); Body condition score = BCS, 1 (emaciated) to 5 (obese); Backfat depth = BF measured at the 10th rib; Dominant = DOM; Submissive = SUB. 3Probabilty
value for social status).
Social Status
Measure2 DOM SUB SEM P-value3
Total born, no. 15.1a 11.8b 0.67 0.001
Total born alive, no. 12.9a 10.7b 0.57 0.01
Stillborns, no. 2.02a 0.92b 0.35 0.03
Laid-on, no. 0.8 0.65 0.2 0.28
Euthanized, no. 1.1a 0.42b 0.19 0.02
Total mortality, no. 4.1a 2.1b 0.45 0.001
Total litter weight, kg 20.6 18.4 0.98 0.10
Adjusted litter weight, kg 19.0 20.1 0.69 0.32
Piglets weaned, no. 10.5 10.0 0.37 0.33
Adjusted litter wean weight, kg 69.5 71.3 1.29 0.33
Average piglet wean weight, kg 6.8 7.1 0.13 0.13
Table 6: Means (± SEM) for main effect of social status on litter-related traits for group-housed gestating sows1 (Within a row, least square means
± standard error (SEM) lacking common superscript letter a,bdiffer, P ≤ 0.05 or c,ddiffer, P ≤ 0.001). 1Data represent 64 pregnant sows across 4
replicates, with sow as the experimental unit. 2Adjusted litter weight =
adjusted for number of live piglets; Adjusted litter wean weight = adjusted for number of piglets weaned; = DOM; Submissive = SUB. 3Probabilty value
for social status).
away from a cell mediated (T-helper 1 driven) cytokine profile. Not
only were IL-12 concentrations greater for submissive sows, N:L ratio was less in late gestation and plasma cortisol tended to be less. While, we speculate that submissive sows may have initially diverted energy to cope with higher lesion scores, it is plausible that once social rank is established, they require fewer resources to
maintain, thus they had sufficient energy reserves to adapt to social
stress by adapting behaviorally and immunologically.
Assessing the stress response and well-being of group housed sows requires an integrative approach using multiple welfare metrics including behavior, physiology, performance and productivity in order to assess the animal’s coping mechanism. While, socially dominant and submissive sows well-being was not compromised, the results of this study suggest that sow social status affects the biological response evoked in attempt to cope and adapt to social stress within small group housing system. Moreover, the biological cost to maintain social status may be greater for dominant sows, while establishment of social status post-mixing is of greater cost to submissive sows. This cost may be partly due to the diversion of energy stores late in gestation away from sow- and litter-related traits that may be consequential to the animal’s well-being, especially among dominant sows. These results indicate that social status may impact sow well-being in certain group-housing environments, in both the short- and long-term, thus should be considered when implementing group housing systems.
Acknowledgements
The research herein was supported by the National Pork Board. The authors gratefully acknowledge M. Lopez for her technical assistance.
References
1. Moberg GP, Mench JA. The biology of animal stress: basic principles and implications for animal welfare. 1st ed. CABI; 2000.
2. Salak-Johnson JL, McGlone JJ. Making sense of apparently conflicting data: Stress and immunity in swine and cattle. J Anim Sci. 2007;85(13 Suppl):E81-8.
3. Coutellier L, C Arnould, A Boissy, P Orgeur, A Prunier, I Veissier, MC MeunierSalaun. Pig’s responses to repeated social regrouping and
relocation during the growing-finishing period. Appl Ani Behav Sci.
2007;105(1-3):102-14. Doi: 10.1016/j.applanim.2006.05.007.
4. Turner SP, Roehe R, D’Eath RB, Ison SH, Farish M, Jack MC, et al. Genetic validation of postmixing skin injuries in pigs as an indicator of aggressiveness and the relationship with injuries under more stable conditions. J Anim Sci. 2009;87(10):3076-82. doi: 10.2527/jas.2008-1558.
5. Verlarde A. Agonistic behaviour. In: Varlarde A, Geers R, editors. On farm monitoring of pig welfare. Wageningen, the Netherlands: Wageningen Academic Press; 2007. p. 53-56.
6. Ison SH, D’Eath RB, Robson SK, Baxter EM, Ormandy E, Douglas AJ, et al. 2010. ‘Subordination style’ in pigs? The response of pregnant sows to mixing stress affects their offspring’s behavior and stress reactivity. Appl Anim Behav Sci. 2010;124:16-27.
7. Elmore MRP, Garner JP, Johnson AK, Kirkden RD, Richert BT, Pajor EA. Getting around social status: Motivation and enrichment use of dominant and subordinate sows in a group setting. Appl Anim Behav Sci. 2011;133:154-63.
8. Andersen IL, Boe KE, Kristiansen AL. The influence of different feeding arrangements and food type on competition at feeding in pregnant sows. Appl Anim Behav Sci. 1999;65(2):91-104.
10. Chapinal N, Ruiz-De-La-Torre JL, Cerisuelo A, Gasa J, Baucells MD, Manteca X. Aggressive behavior in two different group-housing systems for pregnant sows. J Appl Anim Welf Sci. 2010;13(2):137-53. doi: 10.1080/10888700903579846.
11. Arey DS. Time course for the formation and disruption of social organisation in group-housed sows. Appl Anim Behav Sci. 1999;62:199-207.
12. Tonepohl B, Appel AK, B. Voß, U. Konig von Borstel, Gauly M. 2013. Interaction between sows’ aggressiveness post mixing and skin lesions recorded several weeks later. Appl Anim Behav Sci. 2013;144:108-15.
13. Zhao Y, Flowers WL, Saraiva A, Yeum KJ, Kim SW. Effect of social ranks and gestation housing systems on oxidative stress status, reproductive performance, and immune status of sows. J Anim Sci. 2013;91(12):5848-58. doi: 10.2527/jas.2013-6388.
14. Hoy S, Bauer J, Borberg C, Chonsch L, Weirich C. Impact of rank position on fertility of sows. Livestock Sci. 2009;126:69-72.
15. National Research Council. Nutrient Requirements of Swine. 11th Revised ed. Washington, DC: National academic press; 2012.
16. Parent JP, Meunier-Salaün MC, Vasseur E, Bergeron R. Stability of social hierarchy in growing female pigs and pregnant sows. Appl Anim Behav Sci. 2012;142:1-10.
17. Coffey RD, Parker G, Laurent K. Assessing sow body condition. University of Kentucky, Cooperative Extension Service. Lexington, KY.
18. Salak-Johnson JL, Niekamp SR, Rodriguez-Zas SL, Ellis M, Curtis SE. Space allowance for dry, pregnant sows in pens: Body condition, skin lesions, and performance. J Anim Sci. 2007;85(7):1758-69.
19. DeDecker AE, Hanson AR, Walker PM, Salak-Johnson JL. Space allowance and
high fiber diet impact performance and behavior of group-kept gestating
sows. J Anim Sci. 2014;92(4):1666-74. doi: 10.2527/jas.2013-6776.
20. Jarvis S, Moinard C, Robson SK, Baxter E, Ormandy E, Douglas AJ, et al. Programming the offspring of the pig by prenatal social stress: Neuroendocrine activity and behaviour. Horm Behav. 2006;49(1):68-80.
21. Pedersen LJ, Heiskanen T, Damm BI. Sexual motivation in relation to social rank in pair-housed sows. Anim Reprod Sci. 2003;75(1-2):39-53.
22. de Groot J, Ruis MA, Scholten JW, Koolhaas JM, Boersma WJ. Long-term effects of social stress on antiviral immunity in pigs. Physiol Behav. 2001;73(1-2):145-58.
23. Kick AR, Tompkins MB, Almond GW. Stress and immunity in the pig. CAB Reviews Perspectives in Agriculture Veterinary Science Nutrition and Natural Resources. 2011;6:1-17.
24. Watford WT, Moriguchi M, Morinobu A, O’Shea JJ. The biology of IL-12: coordinating innate and adaptive immune responses. Cytokine Growth Factor Rev. 2003;14(5):361-8.
25. Trinchieri G, Pflanz S, Kastelein RA. The IL-12 family of heterodimeric cytokines: new players in the regulation of T cell responses. Immunity. 2003;19(5):641-4.
*Corresponding author: Salak-Johnson JL, Department of Animal Sciences, University of Illinois, 1207 W Gregory, 392 ASL, Urbana, IL 61801, USA, Tel:
217-333-0069; Fax: 217-333-8286; E-mail: [email protected]
Received Date: May 27, 2016, Accepted Date: June 30, 2016, Published Date: July 11, 2016.
Copyright: © 2016 Pacheco E, et al. This is an open access article distributed under the Creative Commons Attribution License, which permits unrestricted use, distribution, and reproduction in any medium, provided the original work is properly cited.
Citation: Pacheco E, Salak-Johnson JL (2016) Social Status Affects Welfare Metrics of Group-Housed Gestating Sows. J Vet Res Ani Husb 1(1): 103.