SPECIAL SECTION: LAND USE OPTIONS IN DRY
TROPICAL WOODLAND ECOSYSTEMS IN
ZIMBABWE
Household resource allocations in response to risks and
returns in a communal area of western Zimbabwe
M.K. Luckert
a,*, J. Wilson
b, V. Adamowicz
a, A.B. Cunningham
c aDepartment of Rural Economy,Uni6ersity of Alberta,Edmonton,AB,T6G2H1CanadabGroup for En
6ironmental Monitoring(GEM),Pretoria,South Africa cWWF/UNESCO/Kew People and Plants Initiati
6e,New York,NY,USA
Abstract
A household production model is constructed in the context of a subsistence economy, influenced by fluctuating rainfall, increasing populations, and relationships to the natural resource base. Households are modelled as attempting to optimally allocate their resources among four sectors: agriculture, woodlands (with wood and non-wood sub-sec-tors), livestock and urban. Simulations show that, although welfare decreases over the 50-year simulation period, the resource base appears to be able to sustain the increased pressure. Data to feed the model are limited, implying further research is needed on: resources expended by households by sector, perceptions of risk, and differentiation within and among households according to gender and wealth. Despite data limitations, results show the importance of consider-ing that households may allocate resources between multiple sectors, as these options may buffer their welfare from rainfall shocks and increasing population pressures. © 2000 Elsevier Science B.V. All rights reserved.
www.elsevier.com/locate/ecolecon
1. Introduction
Many households in Zimbabwe depend on the natural resource base, in the context of fluctuating rainfall, changing economic conditions, and in-creasing populations. However, the behaviour of these households, as they seek to maintain and/or improve their livelihoods in response to risks and returns, is not well understood. Bradley and De-wees (1993), for example, point out that:
… there are few studies which seek to link broader patterns of agricultural production and household economics with tree-related land-use choices. Nor do these types of studies address the differential impact of the use of trees and wood-lands across groups of households. If meaningful analysis of trees and woodland resources are to be undertaken, they must necessarily focus on the household and the community, for example, not the fact that a certain percentage of households are dependent on these resources, but which households, when, and under what conditions. * Corresponding author.
A typical approach to assessing household allo-cation decisions in the economics literature re-volves around household production models. Cavendish (1997) reviews this approach in the context of Zimbabwean households, and notes the difficulties in solving for the optimal household solution in the context of multiple resource uses in a dynamic, risky, environment over time. His approach is to simplify the model to a point where it may be solved by ignoring dynamics and risk. In contrast, our approach is to attempt to capture more reality by including risk and dynam-ics over time, but at the cost of constructing a simulation, instead of an optimisation, model.
In this paper a stylised model of human be-haviour, with linkages to the ecological system, is constructed. In essence, the model simulates re-source allocation behaviour by communal house-holds. The paper outlines a model of how rural households within and adjacent to Mzola State Forest in the Lupane district, Matabeleland northwestern Zimbabwe, allocate their household resources among crop production, raising live-stock, urban employment and gathering products from woodlands in response to risks associated with each sector, and changes in variables such as rainfall, human populations, and employment op-portunities. The effort exerted by households in each sector is linked to their expectation of the value that they may obtain from each sector. In addition, whether the resource base may sustain the household activities is modelled.
The model developed in this paper should be regarded as a ‘scoping model’ in that its purpose is to provide a general method for modelling household allocation decisions and a framework for generating specific research questions, rather than to generate accurate simulated scenarios. As will become evident in the following presentation, there are large data gaps where expert opinion was used in order to simulate scenarios.
The paper proceeds as follows. In the next section, background information regarding the so-cio-economic and biophysical characteristics of the study region, along with characterisations of the modelled sectors, are reviewed. Next the model and the methods used in the simulations are presented. The results are then presented and
discussed, followed by our conclusions and rec-ommendations for further research.
2. Background
2.1. Bio-physical
The Lupane district falls within Natural Region IV, the largest (14.7 million ha) of the five natural regions into which Zimbabwe is divided. With a mean rainfall of 650 mm per annum, this region is subject to periodic seasonal droughts and extreme dry spells during the rainy season.
Two main vegetation types cover Mzola State Forest and surrounding communal areas: mopane (Colophospermum mopane) woodland and Baiki -aea–Schinziophyton–Pterocarpus woodland. In addition, there are grasslands in the drainage lines (dambos). Dambos are the focus of both crop production and livestock grazing. They are also the main areas from which thatching grass is collected, yet form a small proportion (B10%) of
the total land area. Baikiaea–Schinziophyton– Pterocarpus woodlands on leached, drought sus-ceptible Kalahari sands cover a major portion of the study area, followed by Colophospermum mo -pane woodlands on more clay-rich soils.
2.2. Socio-economic
Our model is based on households within and adjacent to the Mzola State Forest. In 1997, there were 1225 households in the communal area adja-cent to Mzola State Forest and about 500 ‘squat-ter’ households within the State Forest.1 The
combined areas of the communal lands and the State Forest occupy 136 000 ha. The communal area lies within the Lupane district that has a total population of 94 800 people, with a popula-tion density of 12.28 people/km2
and a population growth rate of 3.09% per annum (Central Statisti-cal Office, 1992).
The size of households in communal areas in Zimbabwe is an important factor determining the
availability of labour that can be directed to the crop, livestock, woodland product or urban em-ployment sectors. Average size of household is 6.2 persons in the communal area adjacent to Mzola State Forest (Gwaai Working Group, 1997). There is a somewhat larger mean household size amongst households within the State Forest.2
Polygamous households are fairly common in the area. In two villages within the communal areas adjacent to the State forest (Bimba 1 and Bimba 2) approximately 20% of the households were headed by women (Gwaai Working Group, 1997). Mean household income per year in well-wooded areas of Zimbabwe was Z$2495 in 1994 (c. US$300) (Campbell and Mangono, 1994). Cavendish (1997) reports an average income of Z$3528 in 1993/94 (c. US$500) including in-kind income from woodland products (see also Clarke et al., 1996).
Human settlements in the study area are con-centrated within 3 – 4 km of rivers and dambos. These concentrations enable easier access to wa-ter, better grazing and arable soils. Thus, dambos and nearby woodlands are likely to feel the great-est pressure from increasing population.
2.3. Characterisations of modelled sectors
2.3.1. Li6estock
Livestock play many roles within the farming system and household economy (Campbell et al., 2000), and people invest in livestock as a form of savings and an indication of wealth. Herds consist of both cattle and goats, with the ratio between these two depending on wealth and rainfall. In dry times, there is a shift from cattle to goats, which are more tolerant of drought (Steinfeld, 1988). Livestock units (LU), equivalent to 500 kg liveweight, are a standard measure for a species mix to determine the pressure on a given grazing area. On average, households in the study area own 4 LU.2
2.3.2. Crops
Agricultural land per household in the commu-nal area is thought to be 3 ha, while holdings in the State Forest average 9 ha. Weighting these amounts by population yields an average of 4.7 ha per household. Households typically cultivate crops in gardens on dambos as well as in dryland systems on sandy soils away from dambo mar-gins. Pearl millet (Pennisetum) and two Sorghum types (for seed and sweet stems) are commonly intercropped with pumpkins and melons (Citrullus lanatus) in dryland systems. Maize (Zea mays) is cultivated during high rainfall years, but it is a risky crop in the region due to the drought sus-ceptible soils and uncertain rainfall. Sweet pota-toes (Ipomoea batatas), peanuts (Arachis hypogoea), beans (Vigna sp.), bambara ground-nuts (Vigna subterranea) and okra (Hibiscus escu -lentus) are cultivated on the more fertile soils of dambos or dambo margins. Edible greens are collected from cultivated crops (e.g. pumpkin shoots) as well as from ‘weeds’ within fields (e.g. Cleome gynandra, Amaranthus).
Uncertain rainfall greatly increases the risk for cash crops, particularly in dryland farming sys-tems where farmers attempt to grow maize, rather than more drought-tolerant sorghum and pearl millet. As a result, there is increased reliance on livestock production, with nearly 80% of livestock in Zimbabwe grazing in Natural Regions III – V, where rainfall is lowest (GFA, 1987).
2.3.3. Woodland use: wood and non-wood sectors Woodlands provide ‘green social security’, the last safety net for poor rural households during drought or periods of economic depression and high urban unemployment. One indication of this is the rapid rise in numbers of people marketing wood carvings, basketry and other gathered prod-ucts (mopane caterpillars, wild fruits such as Strychnos cocculoides, fuelwood and thatching grass) in western Zimbabwe (Braedt and Gunda, 1988; Hobane, 1994, 1995; Matose et al., 1997). Woodlands also provide a major source of low-cost housing materials, fuel, household utensils, medicines, farm implements, products for process-ing or storage of crops (grain stampprocess-ing mortars, winnowing trays, granaries) and dietary supple-2Mushove, 1997, Personal communication, Zimbabwe
ments. Campbell et al. (1991), for example, record woodland trees as the source of 96% of domestic utensils, 98% of agricultural tools and 94% of rope and cord.
Household wood consumption rates for fuel and construction have been relatively well studied in Zimbabwe and are reviewed by Campbell and Mangono (1994). Median fuelwood consumption for cooking is 4.5 tonnes/household per year, to which must be added wood use for other activities (beer brewing (0.2 tonnes), brick burning (0.4 tonnes) and special occasions (0.7 tonnes)), giving a total of 5.8 tonnes/household per year for fuel-wood and 2 tonnes/household per year for con-struction timber. In well-wooded communal areas, such as this study area, women spend 9 h/week gathering fuelwood in the dry season and 3 h/week during the wet season (Campbell and Mangono, 1994). By comparison, the time men spend collecting construction timber is negligible (8.2 h per trip every 2 – 4 years).
Wild foods (fruits, edible greens, mushrooms, insects) are gathered by woman and children, and are an important seasonal activity for poorer households. Starchy staple diets are frequently deficient in nicotinic acid, vitamin C, calcium and riboflavin, protein and caloric values. Bush foods gathered from woodlands of the study area are valuable dietary supplements providing nutrients deficient in the starchy staple diet of local people. Particularly important are nicotinic acid from wild spinach, vitamin C from a range of wild fruits, and protein from Sclerocarya birrea and Schinziophyton rautaneniiseeds and edible insects. Favoured wild fruit-bearing trees such asStrych -nos cocculoides are frequently maintained in agri-cultural fields (see Chivaura-Mususa et al., 2000). Although values from wild foods will decline with severe reduction in tree cover or with species specific over-exploitation, woodland systems are very resilient to wild food gathering (McGregor 1995). For this reason, in the model that follows, we assume that the share of household effort in gathering wood and non-wood products will not be directly affected by population growth. A greater potential effect on woodlands may occur as they are cleared for crop production, which results in a decline of woodlands for both gather-ing and livestock grazgather-ing.
2.3.4. Urban sector
The urban sector is included in the model as returns to households from remittances are signifi-cant, especially in times of low rainfall. Most people in rural areas rely to a certain extent on remittances from the cities. In return, agricultural foodstuffs are frequently returned to the city. However, returns from the urban sector are quite risky since employment opportunities are difficult to secure and these opportunities are influenced by shocks to the macro-economy. Also, em-ployees might use their wages to maintain a household in the city and not send money back to their rural family.
Although a high level of urbanisation (5% per year) is a general trend in Africa (Huntley et al., 1989), urban migration is strongly influenced by the availability of urban employment. Between 1977 and 1993, the proportion of Zimbabwe’s total population employed in the formal sector dropped from 15.6 to 11.6% (Bond, 1996). Be-tween 1985 and 1993, real wages dropped by 35% (Bond, 1996). Decreasing wages and reduced op-portunities for employment imply that more peo-ple may be relying on communal areas for their livelihood. Government subsidies to communal agriculture through drought relief and the provi-sion of seed, fertiliser and tillage have provided an additional incentive for people to remain in, or move to rural areas (Bond, 1996).
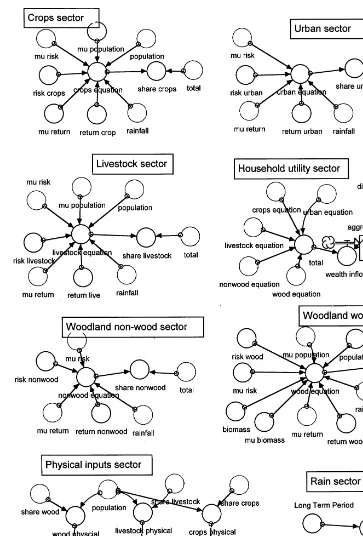
3. The model
The model functions to allocate household ‘effort’3 to five activities or sectors, in response to
the returns from these sectors and the associated risks. The sectors used are crops, livestock, urban, woodland non-wood, and woodland wood. An-other component of the model includes a house-hold utility sector. Househouse-holds are shown to derive their utility from the five sectors of the economy, thus in this sector the total returns to the household are calculated. Also included is a physical inputs component that tracks quantities of natural resources being drawn from the natural resource base4and a rainfall sector taken from the
ecological model (Gambiza et al., 2000).
All five sectors of the economy are similar in that their respective functions are shown to allo-cate shares of household resources depending on the variables of rainfall, and risks and returns of a given sector. Variables beginning with mu are parameters that represent marginal utilities associ-ated with variables.5 All sectors except for the
urban and woodlands non-wood products sectors are shown to be directly influenced by population. The woodlands non-wood products sector is as-sumed to not be directly affected by population because, as discussed above, their production is believed to be quite resilient to population pres-sures. Similarly, the urban sector is assumed to not be directly affected by population. Despite the fact that the urban and woodlands non-wood sectors are not shown to be directly affected by population, the model does account for indirect
effects. As population pressures degrade natural resources, returns decline thereby attracting more resources to the urban sector. The woodland wood products function is shown to have a biomass variable to account for growth dynamics of the woodland over time.
A number of theoretical approaches for mod-elling household behaviour could be used.6 For
this model, we adopt random utility theory, as it is quite flexible, allowing us to include large num-bers of diverse considerations within the Stella framework. This theory supposes that individuals choose from alternatives based on the utility asso-ciated with these alternatives. However, the utili-ties arising from these alternatives are not known with certainty to the analyst. This uncertainty causes a random element to be associated with household decisions and may be addressed with a model that produces probabilities of investment in each sector. We interpret these probabilities as shares of resources devoted to each sector. Thus, we employ the random utility structure as a method of apportioning the household resources. The five sectors are assumed to capture all of the household’s ‘effort’. Thus the shares of effort must total unity. The modelling approach chosen to meet this need, while capturing the interactions described above, is centred on a multinomial lo-gistic function.7 If the utility arising from effort
allocated to each sector i is represented as:
Ui=(Returns, Risk, Environmental8) (1)
then the share of resources devoted to sector iis:
Si=exp(Ui)/Sexp(Ui) (2)
where i=1 – 5. 3We use of the term ‘‘effort’’, as we do not have the data
necessary to allocate distinct factors of production (i.e. land, labour, capital and management) amongst sectors. Therefore, effort may be interpreted as an amalgamation of household resources. Of the components that may make up household effort, labour resources have been identified as the primary variable input into production decisions in the context of smallholder Zimbabwean economies (Campbell et al., 1997). An important exception, addressed in a latter section, may be the presence of capital in the livestock sector.
4Non-wood resources are not included in the physical in-puts sector as it is assumed that this resource is relatively resilient.
5The random utility theoretical foundation of the model is described below.
6Angelson (1999) reviews several models of the household in the context of development issues.
7See Greene (1993) for details on the use of the multinomial logit model in econometrics.
8En
The multinomial logit approach employs utility functions and maintains the ordinal nature associ-ated with economic utility theory. Thus, the model is based on shares of effort in the activities, but returns and risks are classified in terms of utility. This utility is not directly convertible to income or monetary units. However, changes in the utility received by households over time can be tracked. Accordingly, the model in Fig. 1 shows a sub-model (the household utility sector) that totals the sectors’ returns and records their flows over time. These amounts may also be accumulated and discounted to compare net present values of alternative scenarios.
It could be possible to identify the parameters on each element of the utility functions through a detailed econometric analysis of the shares that households invest in these activities and the re-turns and risks they face. In a simple financial analysis the household would ‘invest’ resources to the point where the marginal returns from these activities are equated between sectors and periods over time. However, several activities that com-munal households expend effort on do not have market values. For example, collection of non-wood products from the communal forest is a significant household activity, especially in drought years, but attempts to value these prod-ucts in conventional economic terms have been difficult. Furthermore, given the limited role of
cash in the communal economies of the region, strictly using returns in monetary units would probably not accurately reflect the value of these resources to the household. Accordingly, data for econometric estimations of return functions from the various sectors are not available. The ap-proach taken in this paper was to construct a simple model by calibrating the parameters on the variables affecting utilities, according to knowl-edge about the local community and their re-sponses to changes in rainfall, and population numbers.
4. Model calibration
In order to calibrate the model, known infor-mation regarding returns received, effort allo-cated, risks, population, rainfall, and biomass were collected.
4.1. Returns and effort
A study in Chivi communal area (Natural re-gion IV) found the following sources of wealth: crops (33%), remittances (13%), off-farm income (48%) and livestock income (7%) (GFA, 1987). By contrast, in Chilimanzi, crop sales represent 50% of income, livestock products 6%, urban remit-tances 13% and off-farm income 32% (Steinfeld, 1988). For the purposes of our study, we also need information about percentages of household income derived from sectors, such as non-wood woodland products, that do not necessarily have market values.9 For this reason we chose to use
data presented by Cavendish (1997), which come from Shindi Ward in Southern Zimbabwe.10 The
Fig. 2. Household income (cash and in-kind) by sector.
9While we are aware of the great cultural importance of some woodland localities for traditional religious purposes such as rainmaking ceremonies (e.g. Hot Springs Working Group, 1995), we have not included non-use values in calibrat-ing the model.
percent of household income from each sector is compiled in Fig. 2. Data regarding effort allo-cated between sectors are not available. However, if we assume that households allocate effort among activities in proportion to the returns that they receive, then the income percentages may also be used as proxies for effort expended.11
4.2. Risk
Unfortunately, there have been no explicit stud-ies done on the risk perceptions of Zimbabwean households associated with these economic sec-tors. Although no data are available on house-hold perceptions of risk or on how these vary between wealthier and poorer households, the risks associated with different options are known locally. In part, these are related to the nutrient poor, drought susceptible sandy soils in this area and the risks this poses for crop production and pastoralists. Droughts and patchy rainfall also pose a risk for more ephemeral gathered re-sources, particularly wild spinach and edible caterpillars. In an economy where formal employ-ment options have historically been declining, seeking work in urban areas may also be a risky option. Under risky circumstances, therefore, woody gathered products are a mainstay provid-ing a resilient, risk-free backup if sustainably used. Considering these and other attributes of the sectors, estimates by experts at the workshop suggested the following risk factors associated with the model’s sectors, based on the number of years in a decade in which the sector will fail to produce the average returns received in fail-ure years: urban, 4; crops, 2; livestock, 1; non-wood, 0.5; and non-wood, 0.
4.3. Population, rainfall, and biomass
The human population of the Lupane district was known to grow at 3% per year (Gwaai Work-ing Group, 1997). Although the average rainfall in the region is approximately 650 mm/year, the income data from Cavendish were collected dur-ing 1993/94 in an area where rainfall was 523.5 mm. Accordingly, the model was calibrated as-suming this rainfall amount. Standing biomass was assumed to be 30 tonnes per hectare (Frost, 1996).
4.4. Specification of model equations
Given the above information, the equations of the model in any given period were specified as:
Uc=ac+bc1(return crop×rainfall)
+bc2(risk crop)+bc3(population) (3)
Uu=au+bu1(return urban×rainfall)
+bu2(risk urban) (4)
Un=an+bn1(return non-wood×rainfall)
+bn2(risk non-wood) (5)
Uw=aw+bw1(return wood×rainfall)
+bw2(risk wood)+bw3(population)
+bw4(biomass) (6)
Ul=al+bl1(return livestock×rainfall)
+bl2(risk livestock)+bl3(population) (7)
where: U is utility derived from each sector; a is constant for each sector equation; b is marginal utility associated with the variables; ‘return’ is return associated with each sector (normalised with crops=1) (superscripts: c, crop; u, urban; n, non-wood; w, wood; l, livestock); rainfall= ln(raint)/ln(650) where annual rainfall (raint) is generated over time by the rainfall sub-model, and 650 is the mean annual rainfall in mm; ‘risk’ is risk factor associated with each sector (urban, 4; crops, 2; livestock, 1; non-wood, 0.5; and wood, 0); population=1−(1450/householdst) where householdst is the total number of households in the study area at a given point in time with a 11A maximising firm would attempt to get the same ratio of
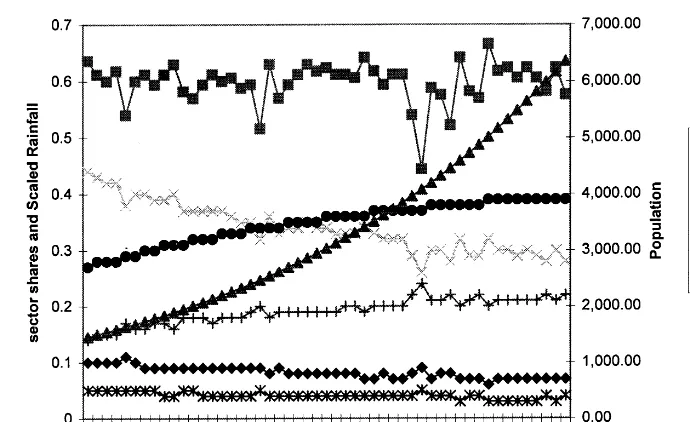
Fig. 3. Effect of rainfall and population growth on sector shares. starting value of 1450 and forecast to increase by
3% per year; ‘biomass’ is total wood biomass per hectare, estimated at a starting value of 30 tonnes. The model is solved to allocate shares among sectors by employing these utility equations in Eq. (2).
4.5. Sol6ing for model coefficients
Given the above equations, the model was cali-brated on a spreadsheet by searching for marginal utilities that caused the logistic function to dis-tribute incomes, according to the data presented in Fig. 2. Because there was no a priori reason to believe that the marginal utilities for a given variable would be different across sectors, values were used that were constant across sectors. After marginal utilities that caused the model to ap-proximate the actual income shares were found, finer calibration was done by adding constants. The resulting marginal utilities and constants were: b(0.1)=2; b(0.2)= −0.01; b(0.3)=1; b(w3)=
0.001; a(c,w)=0; a(l)=0.4; a(n)=0.2; a(u)=0.2.
With these parameters, the model was run over a 50-year period in the presence of rainfall varia-tion and increasing populavaria-tion numbers. These simulations were assessed using knowledge of the
local communities’ response to significant rainfall shocks and changes in ecological conditions. As will be described in the next section, the model seems to reflect local knowledge of sectoral changes in response to the exogenous factors modelled.
5. Results
Fig. 3 shows how sector shares change over time in response to increases in population and fluctuating rainfall. In the figure, crops are shown to be most responsive to rainfall variations. As rainfall decreases, households shift their efforts from crop production to gathering woodland products and seeking returns in the urban sector. Efforts in livestock production are relatively sta-ble unless there is a marked change in rainfall, such as a severe drought. This is because livestock are more resilient to drought than crops. In re-sponse to increasing populations, land pressures are felt in the crops, livestock and wood sectors, causing decreasing shares, while urban and non-wood sector shares increase.
Fig. 4. Physical offtake of resources over time and accompanying wealth. show how the welfare of households are changing
and potential effects of increasing use levels on the resource base. Fig. 4 shows the flows of resources used by households from the landbase, and resulting wealth flows over time. In general, welfare per household is shown to decrease over time with increasing pressures on the land base. However, the resource use levels appear to be sustainable over the period of the simulation. In order to calculate land pressures, average num-bers of resources used by households were pro-jected over time, given expected changes in sector shares.12
Livestock units have increased to ap-proximately 19 000 for all households over the 50-year simulation period. The stocking rate rec-ommended by the national extension for the area is 8 ha per LU, but this rate applies for beef production. For a multi-purpose herd, twice as many animals can be carried. Given that the size of the area is 136 0000 ha, the area could proba-bly sustain 34 000 LU, which is well above the numbers predicted by the end of the simulation period. Crop area increases to approximately
24 000 ha by the end of the simulation period, which makes up about 18% of the study area. Wood collection totals approximately 36 000 ton-nes per year by the end of the period that appears sustainable considering an annual production of 0.75 tonnes/ha per year (Grundy et al., 1993) and 91 800 ha of woodland, giving a total annual growth of 68 800 tonnes.
6. Discussion
This paper presents a framework for consider-ing how households may allocate their resources among activities in response to varying rainfall and increasing populations over time. Although some data are available to provide a basis for simulations, the major contribution of this paper is not in its empirical results, but in identifying a framework and the accompanying data needs for addressing household allocation issues with future research. Furthermore, the intent of the modelling exercise is not to construct the ‘correct’ model of human behaviour. Rather, our intent is to outline how a model of human behaviour can be inte-grated into a model of ecological – economic inter-actions. The model here could be developed with more elaborate feedback, perhaps including links to the macro-economy that effect remittances as members of communal households move to urban areas in search of employment. Links between 12Average household consumption/use per annum of
population growth, livestock rearing and cropland use could also be established, perhaps using some form of Ricardian rent model to describe how added population pressure would push individuals to the extensive margin and increase the risk of cropping. Conceptually, the choices of the house-hold could then be modelled to affect the ecologi-cal system through changes in biomass, cropped area or other factors. This would provide an integrated model of the human system and the ecological system. There are many avenues by which one could proceed, given the basic structure of modelling communal household behaviour in the context of the changing ecosystem.
With respect to the existing model structure, one key area where data are needed includes amounts of effort expended by households among sectors. In the above model, effort is taken as an aggregate measure of resources allocated among sectors. Tracking resource allocations of land, labour and capital separately, in response to returns to each factor of production, would provide more insights into the behaviour of households. Furthermore, contrary to our assumptions in this paper, it is quite possible that households fail to equate the values of effort to return ratios among sectors that we are able to measure. Other factors such as status from holding cattle or cultural values of collecting woodland products are not being cap-tured. Nonetheless, if effort is accurately recorded, then the model will be in a better position to capture the random utility elements that we are not able to explain.
A further area where research could aid in specifying the model relates to risk perceptions by households. Risk factors associated with the vari-ous economic sectors were largely based on expert opinion. To our knowledge, there have been no systematic studies of household risk perceptions among rural households in Zimbabwe.
Extensions to the above model could also war-rant further research. Specifically, the macro-econ-omy could be explicitly modelled within the urban sector to better assess effects on households of such policies as the recently introduced economic structural adjustment policies. Similarly, mod-elling of the agricultural sector could also be refined to attempt to depict decisions between
maize and sorghum, and between cattle and goats. Furthermore, effects of alternative land tenure policies could be modelled by altering returns according to different scenarios. Likewise, techno-logical change could be introduced over time as it influences relationships between household inputs and outputs.
Finally, refinements to the assumption of a household as a homogenous decision making unit could be added. Household behaviour could vary significantly according to wealth levels. Data re-garding households could be collected among dif-ferent wealth classes in order to model the actions of each class separately. Furthermore, household decisions and available resources could be broken down by age and/or gender to capture inter-house-hold dynamics.
The above types of data would ideally be col-lected in a number of regions of the country. This would allow a better understanding of how robust the model is between regions, and provide infor-mation regarding the extent to which the model needs to be re-calibrated for the differing environ-mental and social situations found in the commu-nal areas.
Acknowledgements
The programme Agroforestry: Southern Africa, funded by the Canadian International Develop-ment Agency, provided support for this work.
References
Angelson, A., 1999. Agricultural expansion and deforestation: modelling the impact of population, market forces and property rights. J. Dev. Econ. 58, 185 – 218.
Bond, I., 1996. Employment, population growth and the de-mand for land in communal areas. In: Campbell, B.M. (Ed.), The Miombo in Transition: Woodlands and Welfare in Africa. CIFOR, Indonesia, p. 88.
Bradley, P.N., Dewees, P., 1993. Indigenous woodlands, agri-cultural production and household economy in the com-munal areas. In: Bradley, P.N., McNamara, K. (Eds.), Living with Trees: Policies for Forestry Management in Zimbabwe. World Bank, Washington DC, pp. 63 – 138 World Bank Technical Paper 210.
Braedt, O., Gunda, W., 1988. The woodcraft industry in Zimbabwe: an overview. Unpublished paper.
Campbell, B.M., Mangono, J.J., 1994. Working towards a biomass energy strategy for Zimbabwe. Department of Energy Resources and Development, Ministry of Trans-port and Energy, Harare, Zimbabwe Unpublished reTrans-port. Campbell, B.M., Vermeulen, S.J., Lynam, T., 1991. Value of Trees in the Small-Scale Farming Sector of Zimbabwe. IDRC, Canada.
Campbell, B.M., Luckert, M., Scoones, I., 1997. Local level valuation of savanna resources: a case study from Zim-babwe. Econ. Bot. 51, 59 – 77.
Campbell, B.M., Dore´, D, Luckert, M., Mukamuri, B., Gam-biza, J., 2000. Economic comparisons of livestock produc-tion in communal grazing lands in Zimbabwe. Ecol. Econ. 33, 413 – 438.
Cavendish, W., 1997. The economics of natural resource utili-sation by communal area farmers of Zimbabwe. University of Oxford, Oxford Ph.D. thesis.
Central Statistical Office, 1992. General population census. Preliminary findings, Government Printer, Harare. Chivaura-Mususa, C., Campbell, B., Kenyon, W., 2000. The
value of mature trees in arable fields in the smallholder sector, Zimbabwe. Ecol. Econ. 33, 395 – 400.
Clarke, J., Cavendish, W., Coote, C., 1996. Rural households and miombo woodlands. In: Campbell, B.M. (Ed.), The Miombo in Transition: Woodlands and Welfare in Africa. CIFOR, Indonesia, pp. 101 – 136.
Frost, P., 1996. The ecology of miombo woodlands. In: Camp-bell, B.M. (Ed.), The Miombo in Transition: Woodlands and Welfare in Africa. CIFOR, Indonesia, pp. 11 – 57. Gambiza, J., Bond, W., Frost, P., Higgins, S., 2000. A
simula-tion model of miombo woodland dynamics under different management regimes. Ecol. Econ. 33, 353 – 368.
GFA, 1987. Study on the economic and social determinants of livestock production in the communal areas — Zimbabwe. Gesellschaft fur agrarprojekte in Ubersee MBH, Hamburg, Germany.
Greene, W.M., 1993. Econometric Analysis, second ed. Macmillan, New York.
Grundy, I., Campbell, B.M., Balebereho, S., Cunliffe, R., Tafangenyasha, C., Fergusson, R., Parry, D., 1993. Availability and use of trees in Mutanda Resettlement Area, Zimbabwe. Forest Ecol. Manage. 56, 243 – 266. Gwaai Working Group, 1997. Local level valuation of village
woodlands and State Forests: cases from Matabeleland South in Zimbabwe. Institute of Environmental Studies, University of Zimbabwe, Harare, Zimbabwe, IES Working Paper 7.
Hobane, P.A., 1994. The urban marketing of the mopane worm: the case of Harare. University of Zimbabwe, Centre for Applied Social Sciences, Harare CASS Occasional Pa-per No. 59/1994.
Hobane, P.A., 1995. Amacimbi: The Gathering, Processing, Consumption and Trade of Edible Caterpillars in Bulilima-mangwe District. University of Zimbabwe, Centre for Ap-plied Social Sciences, Harare, p. 33.
Hot Springs Working Group, 1995. The hidden harvest: the role of wild foods in agricultural systems. In: IIED Re-search Series, vol. 3. International Institute for Environ-ment and DevelopEnviron-ment, London.
Huntley, B., Siegfried, R., Sunter, C., 1989. South African Environments into the 21st Century. Human and Rousseau, Cape Town.
Matose, F., Mudhara, M., Mushove, P., 1997. The woodcraft industry of the Bulawayo – Victoria Falls road. Institute of Environmental Studies, University of Zimbabwe, Harare, Zimbabwe, IES Working Paper 2.
McGregor, J., 1995. Gathered produce in Zimbabwe’s com-munal areas: changing resource availability and use. Ecol. Food Nutr. 33, 163 – 193.
Steinfeld, H., 1988. Livestock Development in Mixed Farming Systems. Farming Systems and Resource Economics in the Tropics, vol. 3. Wissenschaftsverlag Vauk, Kiel, Germany.