RIGOROUS GEOMETRIC MODELLING OF 1960s ARGON SATELLITE IMAGES FOR
ANTARCTIC ICE SHEET STEREO MAPPING
W. Ye a,b, G. Qiao a,b,*, F. Kong a,b, S. Guo a,b, X. Ma a,b, X. Tong a,b, R. Li a,b
a
College of Surveying and Geo-Informatics, Tongji University, 1239 Siping Road, Shanghai, China b
Center for Spatial Information Science and Sustainable Development, Tongji University, 1239 Siping Road, Shanghai, China – (yewenkai1990, qiaogang, 4kongfansi, guosong, 1434906, tongxhtj, rli)@tongji.edu.cn
Commission III, WG III/1
KEY WORDS: ARGON, Geometric Modelling, Antarctica
ABSTRACT:
Global climate change is one of the major challenges that all nations are commonly facing. Long-term observations of the Antarctic ice sheet have been playing a critical role in quantitatively estimating and predicting effects resulting from the global changes. The film-based ARGON reconnaissance imagery provides a remarkable data source for studying the Antarctic ice-sheet in 1960s, thus greatly extending the time period of Antarctica surface observations. To deal with the low-quality images and the unavailability of camera poses, a systematic photogrammetric approach is proposed to reconstruct the interior and exterior orientation information for further glacial mapping applications, including ice flow velocity mapping and mass balance estimation. Some noteworthy details while performing geometric modelling using the ARGON images were introduced, including methods and results for handling specific effects of film deformation, damaged or missing fiducial marks and calibration report, automatic fiducial mark detection, control point selection through Antarctic shadow and ice surface terrain analysis, and others. Several sites in East Antarctica were tested. As an example, four images in the Byrd glacier region were used to assess the accuracy of the geometric modelling. A digital elevation model (DEM) and an orthophoto map of Byrd glacier were generated. The accuracy of the ground positions estimated by using independent check points is within one nominal pixel of 140 m of ARGON imagery. Furthermore, a number of significant features, such as ice flow velocity and regional change patterns, will be extracted and analysed.
* Corresponding author
1. INTRODUCTION
Accelerated melting and mass loss of the Antarctic ice sheet are one of the major effects resulted from the global climate change. Evaluation and analysis of the responses of the ice sheet to the global change usually require long-term observations. The commonly employed early records for this purpose are the extensive collection of Landsat satellite images collected since 1970s. However, in 1995 the remarkable historical satellite photographs collected by a series of film-based reconnaissance satellites (KH series) including CORONA, LANYARD and ARGON were made available. They provide a rare opportunity for study of the ice sheet surface dated back to 1960s. In this study we used the Antarctic data collected as part of the ARGON program operated between 1961 and 1964, and now distributed by USGS through a film-to-digit scan service.
Handling of the historical film-based satellite remote sensing data presents a number of challenges, such as imperfection of early imaging mechanism, artefacts of films, deformation through long-period storage, and others. The previous research work related to processing these film-based data mainly focuses on mathematical modelling, DEM and orthophoto generation in non-polar regions. Gheyle et al. (2011) pointed out the calibration errors with the scanner UGSG used for scanning CORONA films which could result in gaps between scan tiles, as well as distortions with the DEM products. Surazakov and Aizen (2010) used the KH-9 Hexagon imagery acquired in 1980 to generate a DEM with six stereo images, and evaluated the
horizontal and vertical accuracy in both flat and mountainous terrain conditions. Sohn et al. (2004) compared three mathematical modelling methods for CORONA HK-4B images and generated a DEM using the geometric model proposed. It achieved an accuracy of 1.5 pixels (horizontal and vertical).
The research of employing ARGON satellite imagery in polar areas for ice sheet studies emphasizes on the surface change analysis along with the assist of modern images. For example, ARGON images in 1963 were compared with recent AVHRR and SPOT data, and large changes were found in the region where an active ice stream enters the Ross Ice Shelf, which implied that the velocity field in this region shifted during the past half century (Bindschadler, 1998). The ARGON images in Greenland were employed in a rigorous bundle adjustment method for orthorectification and mosaic generation, a horizontal accuracy of 168 m in flat areas and 186 m in mountainous areas were obtained, respectively (Zhou, 2002a and 2002b). Kim (2004) and Kim et al. (Kim, 2001 and 2007) assembled the 1963 ARGON images produced a map quality mosaic of the coastal Antarctica, and then compared the result with later satellite images to investigate changes in ice sheet features, ice shelf advance and retreat rates and dynamical glaciological processes.
Geometric modelling is the fundamental step to use remote sensing dataset for different applications, it is especially important for the film-based ARGON satellite images. In this paper we propose a rigorous geometric modelling method for ISPRS Annals of the Photogrammetry, Remote Sensing and Spatial Information Sciences, Volume III-3, 2016
the ARGON satellite images in Antarctic ice-sheet research applications. The images used here were scanned from films by USGS using the Leica DSW700 scanner with a resolution of 7 µm (Gheyle, 2011). Section 2 introduces the geometric modelling method, including the interior and exterior orientations, error compensation, ground control estimation, and bundle adjustment; Section 3 gives the geometric modelling results and discussion; and the last Section discusses the future work.
2. GEOMETRIC MODELLING OF ARGON IMAGES 2.1 Interior Orientation and Systematic Error Correction
This section focuses on interior orientation of ARGON images including measurement of fiducial marks (FMs) on the images and transformation between the scanning coordinate system and the fiducial coordinate system based on these FMs. Furthermore, the systematic errors in ARGON images and the corresponding correction methods are briefly discussed.
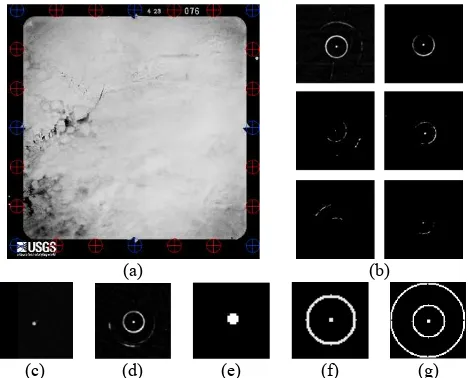
2.1.1 Semi-Automatic Recognition of Fiducial Marks: According to the supplement to camera calibration report of three ARGON missions, i.e. mission 9034A, 9058A and 9059A, there are 24 FMs distributed evenly around each image (Figure 1a). There are three types of FMs as illustrated in Figures 1e-1g (a solid dot, a solid dot with a circle, and a solid dot with two concentric circles). It should be noted that the distribution, type, and size of the FMs are different for different missions.
(a) (b)
(c) (d) (e) (f) (g)
Figure 1. (a) Distribution of FMs on ARGON 9059A image; (b) - (d) FMs of various levels of quality; and (e)-(g) three types of FM templates
Most FMs, no matter of which mission, were undermined to some extents during the nearly half-century storage (Galiatsatos, 2004; Gheyle, 2011). They were sometimes so blurred or incomplete that it is even difficult to identify manually and with the help of image processing techniques. Figures 1b -1d are examples of FMs of various levels of quality. In order to make an effective use of the FMs, a semi-automatic recognition approach is adopted based on Schickler and Poth (1996). A circle fitting method with some a priori knowledge is implemented to precisely locate the FMs.
The FM templates were first developed according to the design and implemented as binary images using an adaptive Otsu’s employed for recognition of the FMs. Moreover, a circle fitting technique (Taubin, 1991) was applied to deal with the situations where the FMs in the images are damaged.
Finally, an average of 21 FMs can be found and measured precisely by applying the above mentioned approach. They are then employed in the subsequent process.
2.1.2 Transformation from FMs to Scanned Image Coordinate System: In this paper, all the calibrated coordinates of FMs are obtained from the supplement to camera calibration reports. The reports work well with images of mission 9034A and 9059A. However, significant inconsistency was found in mission 9058A. The difference between the distribution of calibrated FMs and that of measured FMs is so significant that is out of any meaningful consideration. This issue makes it necessary to find an alternative way if we still want to use the data of mission 9058A. Therefore, we made an effort to use a large number of available 9058A images to estimate the FM positions that should have been in the calibration report.
The FMs were calibrated and measured in the film coordinate system, while the scanned images were in the scanner coordinate system. The FMs and contents have differences between their status in 1960s when the films were used and in 1990s when the photographs were scanned. This may be due to film handling, deformation during long term storage, scanner errors and others. We use a mathematic model to compensate these errors. The known and measured positions of the FMs are employed to estimate the parameters of the model. Through our tests the affine transformation model seems not to be effective way to compensate the errors, while a 2nd polynomial transformation model showed a promising result. Using residuals calculated from the known and transformed coordinates of the FMs, a mean of 0.5 pixels and a standard deviation of 0.25 pixels were achieved. Thus the 2nd polynomial transformation model is adopted in the interior orientation.
2.1.3 Other Corrections: Because of the nature of the ARGON imaging system, such as large film format (11.43 cm 11.43 cm), relatively short focal length (76.2 mm), frame imaging and others, there is a few corrections which are significant in this setting. Among them are large lens distortion and earth curvature corrections. They are particularly effective when the measurements or results are projected from the image space to the ground space.
2.2 Measurements of Features in Image and Ground Spaces
In this research, distinct points of bare rocks were selected as ground control points (GCPs). Their coordinates were measured from the LIMA (horizontal coordinates) and ASTER GDEM (elevation), respectively. This method is based on the assumption that the bare rocks are stationary since 1960s. The distribution of bare rocks in Antarctica can be found in the Antarctic Digital Database (ADD, Scientific Committee on Antarctic Research). This information is used as a prior knowledge when selecting areas and features for GCPs. One ISPRS Annals of the Photogrammetry, Remote Sensing and Spatial Information Sciences, Volume III-3, 2016
example of GCP selection and measurement is shown in Figure 2.
Co-registration of LIMA and ASTER GDEM was performed to eliminate the geo-reference errors induced by the two different data sources. Given the different imaging geometry for component images in LIMA and different data types of LIMA and ASTER GDEM, a shaded relief map was generated according to the imaging geometry of the corresponding component image in LIMA. The shaded relief map was compared with LIMA to locate the same feature in the two datasets. The similarity of appearance between the shaded relief map and LIMA facilitates the measurement of correspondences. Since the features in the shaded relief map are created by the elevation information of the ASTER GDEM, the matched planar features and coordinates make sure that the corresponding elevation information is found correctly.
(a) (b)
(c) (d)
(e) (f)
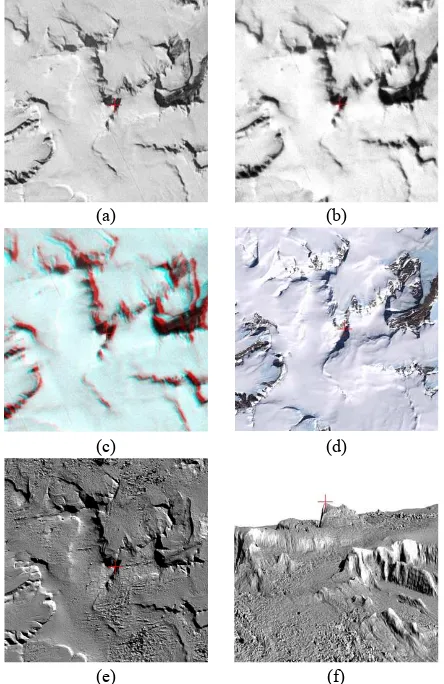
Figure 2. Example of ground control point selection and measurement on ARGON images, LIMA, and shaded relief map generated from ASTER GDEM. (a) and (b) are ARGON stereo-pair; (c) is anaglyph for 3D viewing; (d) is LIMA; (e) is shaded relief map; and (f) 3D view of the shaded relief map draped on DTM. The GCP is selected at the point marked with a red cross.
Careful attention should be paid while selecting GCPs where there are large areas of shadows. It should be avoided that a sharp point of the shadow be selected as a GCP because in that case it may not necessary be a sharp geometric point. A number of tools can be used to perform this task. An effective way may be to use an image draped on a DTM to avoid the effect of shadows. To avoid inducing errors caused by the inaccuracy of the DEM, a better approach to check may be to employ the
anaglyph 3D generated by ARGON stereo-pairs to help determine the GCP locations. Many of these methods can also be applied for selection and measurement of tie points and check points.
Significant elevation differences were found between ASTER GDEM and other DEM products of Antarctica in our research (up to hundreds of meters). The elevation data used in this study include the RADARSAT Antarctic Mapping Project (RAMP) digital elevation model version 2 (Liu, 2001) and the Ice, Cloud and land Elevation Satellite (ICESat) level 2 data which were used to further validate the reliability of the selected features.
2.3 Initial Exterior Orientation (EO) Estimation
Approximations of the six EO elements are needed in bundle adjustment. More accurate approximations would yield more accurate results with faster convergence. The approximations of EO elements involved in this research are computed using space resection with the help of the ephemeris file that documented the satellite trajectory and GCPs obtained via the approach introduced in the last session.
A 9th order Lagrange polynomial interpolation is usually applied to derive the position of the satellite (Yousif, 2007; Zheng, 2009), which was used as the approximate position of the camera in this research.
However, the exact exposure time of each ARGON image is unavailable, thus the interpolation cannot be performed based on the time parameter. Alternatively, it can be achieved by using the planar positons to interpolate the elevation. First, the image center can be obtained when it is registered to the LIMA mosaic. As shown in Figure 3, by using a 9th order Lagrange polynomial the elevation of the orbit can be approximated from ten known elevation points (five fore and five aft the image center) from the accompany “high accuracy ephemeris” file, which was obtained from the U.S. National Archives. There is no reported accuracy assessment of the orbit data. The elevations of the camera positions were interpolated and treated as approximate values.
We set the initial values of the roll and pitch angles of Point P as zero (Figure 3). The flight direction is v. As for the initial yaw angle (κ), it can be computed from the angle between the projects of the orbit (v’) and the X axis of the LIMA mosaic defined in O-XYZ.
Figure 3. Diagram of the yaw angle determination. ISPRS Annals of the Photogrammetry, Remote Sensing and Spatial Information Sciences, Volume III-3, 2016
Once the initial values of the EO elements of all images were obtained, the space resection was carried out to refine the approximations. The refined EO elements were finally taken as the approximations and used in the following bundle adjustment.
2.4 Bundle Adjustment
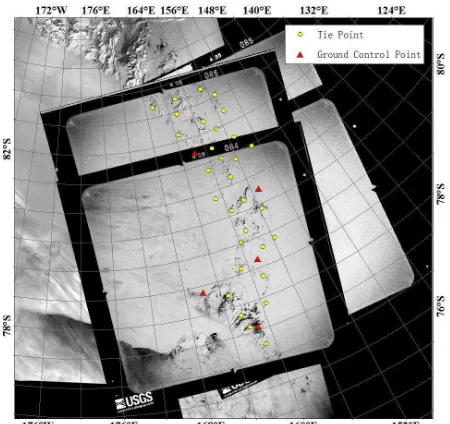
Bundle adjustment (BA) was performed to the ARGON images using the commercial software LPS of Leica Systems. In this paper we use a set of ARGON stereo images covering the Byrd glacier region (80 S, 160 E). It is one of the large and active outlet glaciers in East Antarctica. Figure 4 shows the coverage of four ARGON images used in Byrd glacier BA.
Apart from the orientation elements and GCPs obtained by the above methods, multiple tie points were selected to strengthen the geometry. To achieve an even distribution of the tie points a grid is used in the overlapping area where at least one tie point is established in a cell. In the Byrd glacier region, the grid was set by an increment of 4 degrees in longitude and 40 minutes in latitude, which is to make each grid as square as possible.
Figure 4. Coverage of four ARGON stereo images in the Byrd glacier region with an ARGON mosaic as background (Kim, 2004). The tie points and ground control points used in the geometry reconstruction are denoted by yellow circle and red triangle, respectively.
3. RESULTS AND DISCUSSION
31 tie points, 5 control points and 12 check points were involved in the bundle adjustment process (Figure 4). The accuracy evaluation results using the tie points and check points are listed in Table 1 and 2 to show both internal and external accuracy, respectively. The standard deviations for the image coordinates and ground coordinates of the tie points were estimated in BA through error propagation and averaged for all tie points (ASD) as σx, σy, σX, σY, and σZ (Table 1). They are considered as the internal measure of the accuracy.
Generally, the bundle adjustment of the Byrd glacier images yielded a unit-weight RMSE of 0.51 pixels. The averaged image coordinate accuracy for the tie points is better than 0.4 pixels. Both indicated a high level of internal accuracy of the BA.
Table 1. Average standard deviations of tie points estimated in bundle adjustment
ASD σx (pix) σy (pix) σX (m) σY (m) σZ (m)
Value 0.32 0.35 15 23 45
With the geometric positioning parameters obtained from the BA, 12 check points were selected that were not involved in the BA to assess the external accuracy. The check points were measured in the ARGON images and then triangulated in the ground space. On the other hand, they were also measured in the LIMA mosaic and the ASTER GDEM to obtain their coordinates (known). The differences between the triangulated and known coordinates were used to calculate RMSE of the ground coordinates as ΔX, ΔY, and ΔZ as shown in Table 2. We can see the horizontal accuracy is higher than that of the vertical accuracy. Overall, the accuracy is within one nominal pixel of 140 m. This accuracy is considered as the external accuracy.
Table 2. Accuracy of ground coordinates of check points RMSE ΔX (m) ΔY (m) ΔZ (m)
Value 25 16 109
4. FUTURE WORK
The camera poses were precisely refined after bundle adjustment and they can be used for topographic mapping and ice flow speed estimation. Given the lack of 1960s global and regional digital surface models covering Antarctic areas, an attempt was made to generate DEMs from ARGON stereo-pairs. Dense correspondences were matched first via a hierarchical matching strategy, and then a 500 m resolution DEM was produced. Besides, an orthophoto map was generated from the obtained DEM and the geometric modelling results. Figure 5 shows the 3D view of the orthophoto map draped on the DEM. Significant features, such as the coastline and the ice velocity, can be extracted from the orthophoto map and the images. A novel approach to simultaneously produce the digital surface model and estimate the ice velocity from only one stereo-pair is being developed (Li, 2016). Future works will focus on applying the proposed method to conduct geometric reconstruction in more areas and producing regional speed maps of Antarctica.
Figure 5. 3D view of the ARGON orthophoto draped on the DTM in the Byrd glacier area.
ACKNOWLEDGEMENTS
This work has been supported by National Key Basic Research Program of China (No. 2012CB957701).
REFERENCES
Bindschadler, R. and Vornberger, P, 1998. Changes in the West Antarctic ice sheet since 1963 from declassified satellite photography. Science, 279(5351), pp. 689-692.
Galiatsatos, N., 2004. Assessment of the CORONA series of satellite imagery for landscape archaeology: a case study from the Orontes valley, Syria. Durham University.
Gheyle, W., Goossens, R., Bourgeois, J. and Jacobsen, K., 2011. Scan Problems in Digital CORONA Satellite Images from USGS Archives. Photogrammetric Engineering & Remote Sensing, 77(12), pp. 1257-1267.
Kim, K.T., Jezek, K.C. and Sohn, H.G., 2001. Ice shelf advance and retreat rates along the coast of Queen Maud Land, Antarctica. Journal of Geophysical Research: Oceans (1978-2012), 106(C4), pp. 7097-7106.
Kim, K.T., 2004. Satellite Mapping and Automated Feature Extraction: Geographic Information System-Based Change Detection of the Antarctic Coast. The Ohio State University.
Kim, K.T., Jezek K.C. and Liu, H., 2007. Orthorectified image mosaic of Antarctica from 1963 Argon satellite photography: image processing and glaciological applications. International Journal of Remote Sensing, 28(23), pp. 5357-5373.
Li, R., Ye, W., Kong, F., Qiao, G., Liu, S., Tong, X., Guo, S. and Ma, X., 2016. A New Analytical Method for Estimation of Antarctic Ice Flow in 1960s from Historical Optical Satellite Imagery. To be submitted to IEEE Transactions on Geoscience and Remote Sensing.
Liu, H., Jezek, K.C., Li, B. and Zhao, Z., 2001. RADARSAT Antarctic Mapping Project digital elevation model. National Snow and Ice Data Center. Digital Media. National Snow and Ice Data Centre: Boulder, CO.
Schickler, W. and Poth, Z., 1996. The automatic interior orientation and its daily use. In: The International Archives of Photogrammetry and Remote Sensing, Vienna, Austria, Vol. XXXI, Part B3, pp. 746-751.
Sohn, H.G., Kim, G.H. and Yom, J.H., 2004. Mathematical modelling of historical reconnaissance CORONA KH4B Imagery. The Photogrammetric Record, 19(105), pp. 51-66.
Surazakov, A. and Aizen, V., 2010. Positional accuracy evaluation of declassified hexagon KH-9 mapping camera imagery. Photogrammetric Engineering & Remote Sensing, 76(5), pp. 603-608.
Taubin, G., 1991. Estimation of planar curves, surfaces, and nonplanar space curves defined by implicit equations with applications to edge and range image segmentation. IEEE Transactions on Pattern Analysis & Machine Intelligence, 13(11), pp. 1115-1138.
Yousif, H. and El-Rabbany, A., 2007. Assessment of several interpolation methods for precise GPS orbit. Journal of Navigation, 60(03), pp. 443-455.
Zhou, G. and Jezek, K.C., 2002a. Satellite photograph mosaics of Greenland from the 1960s era. International Journal of Remote Sensing volume, 23(6), pp. 1143-1159(1117).
Zhou, G., Jezek, K.C., Wright, W., Rand J. and Granger, J., 2002b. Orthorectification of 1960s satellite photographs covering Greenland. IEEE Transactions on Geoscience & Remote Sensing, 40(6), pp. 1247-1259.
Zhang, Y. and Wu L., 2011. Fast Document Image Binarization based on an improved adaptive Otsu’s method and destination word accumulation. Journal of Computational Information Systems, 7(6), pp. 1886-1892.
Zheng, W., Hsu, H., Zhong, M., Yun, M., Zhou, X. and Peng, B., 2009. Effective processing of measured data from GRACE key payloads and accurate determination of Earth's gravitational field, Chinese Journal of Geophysics, 52(4), pp. 772-782. ISPRS Annals of the Photogrammetry, Remote Sensing and Spatial Information Sciences, Volume III-3, 2016