DERIVATION OF TREE CANOPY COVER BY MULTISCALE
REMOTE SENSING APPROACH
Weicheng Wu
GISU/ICARDA (International Center for Agricultural Research in the Dry Areas), POBox 5466, Aleppo, Syria - [email protected]
ISPRS, WG IV/1-7
KEYWORDS:Forestry, Multiresolution, Multisensor, Acquisition, Processing, Estimation, Calibration
ABSTRACT:
In forestry, treecanopy cover (CC) is an important biophysical indicator for characterizing terrestrial ecosystemsand modeling global biogeochemical cycles, e.g., woody biomass estimation, carbon balance analysis (sink/emission). However, currently available CC product cannot fully meet what we need while conducting woody biomass estimation in tropical savannas.It is thus necessary to develop an approach to estimate more reliable CC. Based on the acquisition of multisensor and multiresolution dataset, this study introduces an innovative multiscalemethod for this purpose taking the multiple savannas country Sudan as an example. The procedure includes: (1)Measurement of CC using Google Earth Pro in which very high resolution images such as QuickBirdand GeoEye images are available, and then the measured CC was coupled with atmospherically corrected and reflectance-based 16 frames of Landsat ETM+ vegetation indices (EVI, SARVI and NDVI)dated Nov 1999-2002 to establish the CC-VIs models; it was noted that among these indices NDVI indicates the best correlation with CC (CC = 153.09NDVI– 10.12, R2 = 0.91);(2) The NDVI of Landsat ETM+ was calibrated against MODIS NDVI of the same time period (Nov 2002)to make sure that model developed from Landsat ETM+ data can be applied to MODIS data for upscalingto regional scale study; (3)Time-series MODIS NDVI data of the period Jan 2002–Dec 2009 (MODIS13Q1, 250m, 186 acquisitions) were acquired and used to decompose the woody component(NDVI) from seasonal changeand herbaceous component by time-series analysis;(4) The equation obtained in step 1 was applied to the decomposed MODIS woody NDVI images to derive country scale CC data. The produced CC was checked against the 287 ground measured CC obtained in step 1 and a good agreement (R2 = 0.53-0.71) was found.It is hence concluded that the proposed multiscale approach is effective, operational and can be applied for reliable estimation of regional and even continental scales CC data.
1. INTRODUCTION
One of the key biophysical indicators for assessing forests and woodlands is the tree canopy cover (CC) which allows us to characterize the forestry and tropical savannas ecosystems, estimate woody biomass production and monitor carbon emission/sequestration balance in the context of global environmental change research.Actually, Helldén (1987a, 1987b and 1991) and Duncan et al. (1993) havediscovered the possibility to characterize CC by remote sensing and built up CC-NDVI relationship for woodlands and forests;Kuhnell et al. (1998) have also developed a model linking the tree foliage projective cover (FPC) with NDVI and Landsat TM band 5. More recently, other authors (DeFries et al. 2000, Huang et al. 2001 and Hansen et al. 2003, Schwarz and Zimmermann 2005) have employed either linear mixture modeling, regression tree or generalized linear model to estimate percent tree CC. DeFries et al. (2000) and Hansen et al. (2003) have produced global scale tree cover product (1km and 500m resolution respectively) using AVHRR and MODIS data. These studies and their related products are no doubt significant contribution to the global scale forestry and woodland savannas research. However, while applying the product of Hansen et al. (2003), which is available on the data server of the Global Land Cover Facility (GLCF) of the University of Maryland1, to our woody biomass estimation
1
Accessible at: ftp://ftp.glcf.umiacs.umd.edu/modis/VCF
in tropical African savannas, it was found that the tree cover product did not detect a large area of sparse woodlands in the Southern Saharan/Sahelian Savannas, whereas almost all swamp and river floating vegetation (e.g., in the Sudd in the SudanianEcoregion) consisting of Cyperus papyrus, Eichhorniacrassipes, Ceratophyllumdemersumand Vossiacuspidata (Denny 1984), was interpreted as closed rainforests, with tree cover attaining 80%, the top value of their product. Given these major discrepancies, it was not considered appropriate to directly apply the GLCF tree cover product to the assessment of forests and woodlands in tropical savannas. It was hence necessary to develop a tropical savanna-tailored approach that can lead to more reliable CC characterization.
In line with the climate conditions, tropical savannas crossa large geographical dimension from Southern Saharan/Sahelian toSudanian Woodlands including locally forests. Different authors proposed different subdivisions for savanna woodlands based on tree canopy coverage (Helldén 1987b). This paper defines wooded grassland savanna, open woodland savanna and sparse woodland as having 1-20% of tree/shrub canopy cover (CC), and woodland/shrublandsavanna of CC more than 20%; when the CC exceeds 60%, it is considered forest.
studies on the tree canopy cover quantification aiming at estimating woody biomass based on the field measurement in Saharan/Sahelian woodlands, no atmospheric correction was conducted on the Landsat MSS and TM images and the radiance values in digital counts (DC) were not converted into spectral reflectance in his study. This constituted the limitation for applying and extending his model to wider regions of interest. Secondly, due to the difference in woody species in different savannas, whether such CC-NDVI relationship is valid for and can be extended to Sudaniansavannas still remains uninvestigated. Thirdly, in terms of remote sensing, winter images,which are the mainly data source used for tree cover estimation (Helldén 1987a and 1987b, Duncan et al. 1993, Kuhnell et al. 1998, Hansen et al. 2003) to avoid the mixture of herbaceous information, encounter from time to time problems such as fire, lower Sun-elevation angle in comparison with other seasons, and few or no leaves left for deciduous species. These factors would influence the estimation accuracy and reliability of CC.
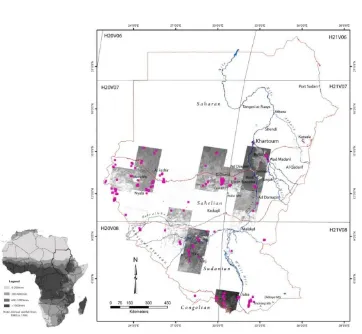
In view of these problematic issues, the objective of this study is to develop widely and year-roundly applicable remote sensing approach to reliable estimate CC in woodlands and forests in tropical savannas. Sudan, the largest tropical African country encompassing a cross-section of tropical savannas namely the Southern Saharan, Sahelian and Sudanian Savannas (WWF 2010, Figure 1), was selected as a basis for developing and illustrating the methodology.
2. MATERIAL AND METHOD 2.1 Dataset
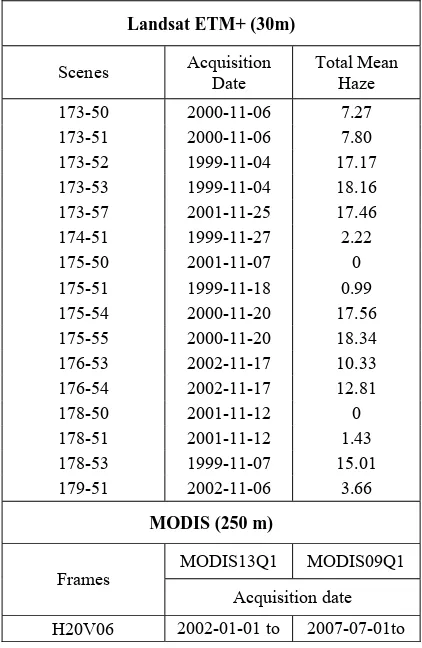
To develop widely applicable CC estimation approach in tropical African savannas, a multiscale methodology was envisaged. We need thus multiresolution data to achieve the research. Fortunately, very high resolution satellite images such as QuickBird and GeoEye images (0.5-2.5m) are available in Google Earth Pro. These image patches can be used for counting tree number and canopy cover (CC) measurement as well as ground-truthing. High resolution Landsat TM/ETM+ (15-30m) and SPOT images (5-20m) are sensitive to local level land cover and phenological change and hence suitable for local-scale remote sensing model development. Moderate resolution data such as MODIS (250-1000m) are ideal for regional-scale land system analysis. Based on this general knowledge, a multisensor and multiresolution dataset was prepared for this research (Table 1).
2.2 Calibration of the Relationship Between CC and Vegetation indices
2.2.1 Atmospheric correction of Landsat ETM+ images: Sixteen Landsat ETM+ images acquired in Nov. (autumn when herbaceous vegetation starts to wither but Acacia and coniferous and broadleaved trees are still green) of the period of 1999-2002 (see Table 1 and Figure 1 for spatial coverage) were radiometrically normalized and atmospherically corrected using the COST model developed by Chavez (1996), which intends to remove both additive scattering and multiplicative path transmission effects. The haze values of images shown in Table 1, an important input for the COST model, were estimated using the 4th feature of the Tasseled Cap Transformation (Crist et al. 1984a and 1984b). The haze removal was conducted in terms of the multiplication factor for each band proposed by Chavez (1988).
2.2.2 Transformation of relevant vegetation indices: In addition to the NDVI, other vegetation indices (VIs) published recently may, according to their development theory, be more pertinent for ecosystem research including biomass estimation. Examples are the Enhanced Vegetation Index (EVI) (Hueteet al. 1997), the Atmospherically Resistant Vegetation Index (ARVI) and the Soil Adjusted and Atmospherically Resistant Vegetation Index (SARVI) proposed by Kaufman and Tanré (1992) and so on. Both EVI and SARVI introduce the blue band to conduct a self-correction and remove not only soil influence but also atmospheric effect. For this reason, NDVI, SARVI and EVI were selected for calibration.
2.2.3 Calibration and extension of models to MODIS data: (1) Canopy cover measurement
Using Google Earth Pro, we randomly selected 287 woodlands and forests plots (1 plot covers 100×100m2 = 1 ha) in southern Saharan, Sahelian (Darfur and Kordofan) and Sudanian Savannas where there is coverage of QuickBird or GeoEye images. The distribution of these sampling plots is shown in Figure 1. In the plots we counted the number of trees, measured canopy diameter and calculated the tree canopy cover (CC) as follows:
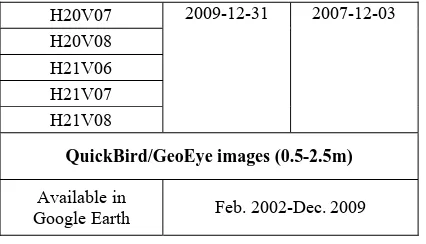
H20V07
Google Earth Feb. 2002-Dec. 2009
Table 1. Satellite dataset used in this study
(Note: Landsat ETM+ and MODIS images were freely obtained from the USGS data server: http://glovis.usgs.gov/)
As this method was applied manually, its main limitation was the difficulty to count all trees when the number was more than 40-50. Another shortcoming arising was that when the tree canopy size varied significantly inside the plot, we had to measure the crown diameter for all trees. The advantages of this approach were its simplicity and ease of use, especially, in case of crown shading due to the low Sun-Elevation angle and low heterogeneity among tree canopy sizes. One point should be clarified: the tree or shrub of which canopy diameter (di) is < 2m
was not counted.
Another approach to measure CC was to copy the 1-ha plot sampling area from Google Earth Pro using the print-screen function of the keyboard and paste it into Photoshop. After flattening the color layers, the plot was turned into black-and-white image. By enhancing the contrast between the crown area (dark) and background soil (white), the number of black pixels can be easily read to get the crown area percentage2. This approach is shown in Figure 2. The limitations of this method lie in that it can be only applied in the plots where there is an apparent difference in reflectance between canopy cover and background soil, and when Sun-Elevation angle is large enough not to produce much crown shadow.
Five plots in which both methods could be applied were checked to indicate the accuracy and reliability. It was found that the difference between the two approaches varies from 3% to 7%.
(2) Coupling CC with VIs
While plotting the CC of these 287 sampling plots against the Nov. Landsat ETM+ images, it was noted that 102 plots fell out of the available image frames (Figure 1) and the correlation between the CC of the remained 185 plots and vegetation indices (VIs) was very low (R2 = 0.16). To understand this phenomenon, for each of the 185 plots the QuickBird or GeoEye image was compared with the corresponding Landsat ETM+ image. The major difference occurred in the following cases: (a) forest/woodland fire in Nov. ETM+ images (1999-2002), but trees or shrubs have regrown in the recent QuickBird or GeoEye images (low VIs versus high CC case); (b) recent woodland fire observed in the QuickBird or GeoEye images, with high VIs in the ETM+ images (high VIs versus low CC case); and (c) a very green herbaceous understory (high VIs) in the Nov. ETM+
2 Method developed based on a personal communication with Dr R.
Sommer
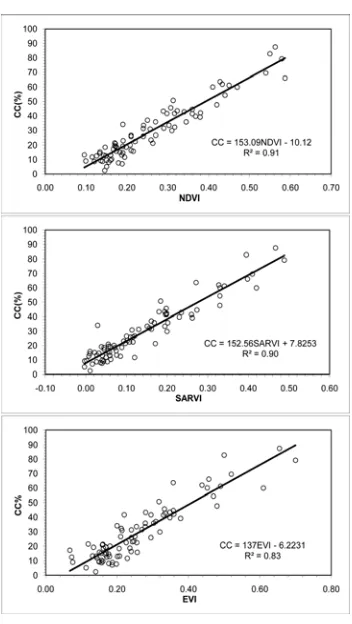
images but with low tree density (low CC) measured in the QuickBird or GeoEye images, particularly in the Sudanian Savannas (again high VIs versus low CC case). The plots belonging to these three abnormal cases were excluded and finally 82 plots were retained for calibration, with the result showing a clear and strong correlation between CC and VIs (R2 = 0.83–0.91, Figure 3).
Although there are some concerns on the use of NDVI to infer vegetation and soil properties, especially in drylands (Kaufman and Tanré 1992, Hueteet al. 1997), this calibration reveals that among the three vegetation indices the atmospherically corrected reflectance-based NDVI shows the best correlation with CC (R2 = 0.91). SARVI has the same level of correlation with CC (R2 = 0.90) as NDVI but with a lower dynamic range (0.2 units lower than that of NDVI and EVI). For this reason NDVI was selectedfor CC calibration. We should keep it in mind that the NDVI is woody trees' NDVI, so we can denote it as NDVIW. The equation between CC and NDVI can be
expressed as:
CC = 153.09NDVIW – 10.12 (R2 = 0.91) (2)
(3) Upscaling test for models developed from Landsat ETM+ to MODIS
Since the estimation models were developed based on Landsat ETM+ images, a critical step was to evaluate whether they can be directly applied to MODIS data, because the sensed information between the two captors is not identical even for the same targets or objects due to the difference in spatial resolution and nadir viewing angle. For this purpose, three scenes of Landsat ETM+ images in which their Path-Row No. and acquisition dates are respectively 176-53 Nov17-2002, 176-54 Nov17-2002 and 179-51 Nov06-2002 (Table 1) and two frames of MODIS 250 resolution reflectance images (Frame No: H20V07 and H20V08) dated Nov 16, 2002 were selected for this upscaling test.
To have more comparability with MODIS NDVI and diminish the difference in spatial resolution, the three scenes of Landsat NDVI were resampled to 250m resolution. 2000 points were randomly dotted in the frames of three Landsat images. By removing those falling in rivers and burnt areas, 1655 points were retained. It was found that the NDVI of Landsat ETM+ images (NDVIL) and that of MODIS (NDVIM) of the same period are highly correlated (NDVIM = 0.9786NDVIL + 0.0471, R2 = 0.88). Thus, the models developed from Landsat ETM+ images can be upscaled and applied to the MODIS data for regional or nationwide assessment.
2.3 NDVI Decomposition
Firstly, the Land Cover Map of Sudan produced by the FAO Africover Project (FAO 2003) was employed to define the woodland areas (sparse woodland and woodland) and forests in different savannas. Some typical areas of forests (795 pixels), woodlands (4048 pixels) and sparse woodlands (5006 pixels) located in the Sahelian and Sudanian Savannas were selected to obtain the time-series mean NDVI dataset of these biomes from Jan 2002 to Dec 2009.
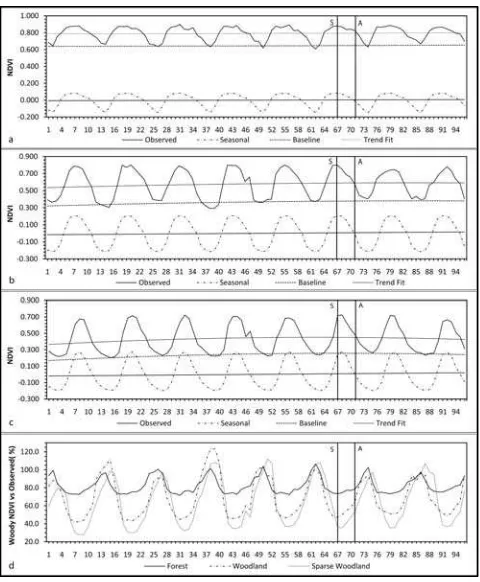
Secondly, the decomposition technique of vegetation cover into woody and herbaceous components as demonstrated by Roderick et al. (1999) and Lu et al. (2003) was applied to the time-series mean NDVI dataset of forests, woodlands and sparse woodlands. More concretely, these time-series mean NDVI data of forests, woodlands and sparse woodlands were input into a R-Code, a free software developed by Wessa (2008) based on the “locally weighted regression smoother (LOESS)” theory proposed by Cleveland et al. (1990). The decomposed results, seasonal component and trend fit (NDVITi) are shown in Figure
4. In the light of Roderick et al. (1999) and Lu et al. (2003), the baseline (NDVIBi), which can be obtained by shifting the NDVI
trend (NDVITi) by a constant K, is a good measure of the
evergreen woody component (NDVIWi) at the given time i and
can be expressed as:
NDVIWi = NDVIBi = NDVITi– K (3)
where K is the absolute value of minimum seasonal component for the two consecutive years. K for forests, woodlands and sparse woodlands is measured respectively 0.1466, 0.2143 and 0.1982. The baseline is also shown in Figure 4.
After obtaining the baseline, the percentage of the woody component, in other words, the ratio between the woody NDVI (NDVIWi) and the observed NDVI (NDVIO) of pixel at any time i
can be calculated as:
Ri = (NDVIWi /NDVIOi)×100% (4)
Figure 1. Distribution of the 287 sampling plots
Note: (1). The division of ecoregions or different savannas (red lines) was based on the annual rainfall according to WWF (2010); (2) Each pink rectangle represents a 1-ha sampling plot (100×100m2, see Figure 2 for detail); (3) Grey image frames indicate the 16
Figure 2. Measurement of canopy cover (CC) using the second approach
(Left: 1 ha = 100×100m2 plot No.262 in color; Middle: screen printed from Google Earth, copied and pasted into Photoshop and cut into the size of 100×100m2; Right: black-and-white image with contrast enhancement between
tree canopy (black) and soil background (white). CC = 19121 pixels/74528 pixels in total = 25.66%.
This woody NDVI percentage is projected in Figure 4d. Taking the MODIS NDVI images of 2007 for example, the woody NDVI component % of summer (Aug) and autumn (Nov) is shown in Table 2.
2.4 Derivation of CC
Figure 3. The relationship between the measured canopy cover (CC%) and vegetation indices (VIs)
The 8-days interval MODIS09Q1 reflectance data of which bands 1 (Red) and 2 (NIR) have a spatial resolution of 250m of the periods Jul 01 to Sep 30 (12 acquisitions) and Nov 01 to Dec 03 (5 acquisitions) of 2007 (Table 1) were converted into NDVI. With a specifically designed algorithm, the summer peak NDVI
image, or rather, the maximum value of each pixel of the 12 summer acquisitions was produced; the same algorithm was applied to the five Nov NDVI images to extract the cloud-free autumn NDVI for each pixel.
In the FAO classified woodlands, sparse woodlands and forests areas (FAO 2003), the decomposed ratios, woody NDVI percentage as shown in Table 2, were respectively applied to the summer peak and autumn cloud-free MODIS NDVI images to produce summer and autumn woody component (NDVIW)
images. And then the Eq.2 was applied to the woody component images to derive summer and autumn tree canopy cover (CC) of forests and woodlands in Sahelian and Sudanian Savannas in Sudan.
3. RESULTS AND VALIDATION
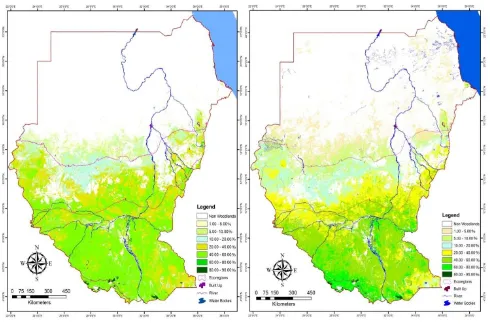
Based on the implementation of the above methodological procedure, the results obtained are shown as follows: (1) Among the investigated vegetation indices, atmospherically corrected and reflectance based NDVI shows the best correlation (R2 = 0.91) with tree canopy cover (CC). This CC-NDVI relationship derived from Landsat images and ground measurement is relevant for tropical savannas, and can be applied to MODIS data for regional CC quantification; (2) By integration of time-series decomposition analysis, it becomes possible to extract the woody component from seasonal change and herbaceous component in the tropical savanna woodlands and forests at any time of the year; (3) As shown in Figure 5, we can see that the two CC maps (summer and autumn) are quite similar to each other, indicating that the decomposition technique provides reliable partitioning of the woody component in both summer and autumn; (4) The CC maps of summer and autumn were checked against the 287 ground measured CC, and a good agreement was found (R2 is 0.53 and 0.71 respectively for summer and autumn). The CC quantification using the proposed approach produces good results, especially, for autumn (Nov) images.
4. CONCLUSIONS
in the extent of CC at the level 60-80% was noted between the two summer and autumn maps, the estimated CC result, especially, that of autumn, shows a good agreement with the ground measured data, implying the feasibility of the proposed method. One significant advantage of this approach is that it can be applied to the images of any season to produce year-round CC. One point worthy of attention is that the CC-NDVI model
(Eq. 2) may lose its sensitivity when CC is below 5% or over 80% and the estimation result may be less accurate than that in the middle parts (CC = 20-70%). In future work, more attention should be paid to the time-series decomposition processing in order to partition more reliably and accurately the woody component for any season.
Forest Woodland Sparse Woodland 2007
Summer Autumn Summer Autumn Summer Autumn
NDVIO 0.88 0.82 0.80 0.58 0.72 0.48
NDVIW(Baseline) 0.65 0.65 0.38 0.38 0.26 0.26
R (%) 73.51 78.63 47.14 65.54 35.45 53.45
Woody NDVI 0.7351* NDVIO 0.7863* NDVIO 0.4714* NDVIO 0.6554* NDVIO 0.3545* NDVIO 0.5345*NDVIO
Table 2. Woody NDVI percentage in summer and autumn
Figure 4. Seasonal components, trend and baseline of NDVI series and the percentage of the woody component a: forest, b: woodland, and c: sparse woodland; d: woody NDVI versus observed NDVI (R); S: summer and N: autumn (Nov.) of
Figure 5. Tree canopy cover maps of 2007 (left: summer and right: autumn)
REFERENCES
Chavez, P. S., Jr., 1988. An improved Dark-Object Subtraction Technique for Atmospheric Scattering Correction of
Multispectral Data. Remote Sensing of Environment, 24, pp.459-479.
Chavez, P. S., Jr., 1996. Image-Based Atmospheric Correction — Revisited and Improved.Photogrammetric Engineering and Remote Sensing, 62, pp.1025-1036.
Crist, E. P., Cicone, R. C. 1984a. Application of the Tasseled Cap concept to simulated Thematic Mapper
data.Photogrammetric Engineering and Remote Sensing, 50,pp.343-352.
Crist, E. P., Cicone, R. C., 1984b. A physically-Based Transformation of Thematic Mapper Data — The TM Tasseled Cap. IEEE Transaction on Geoscience and Remote Sensing, GE22 (3),pp.256-263.
Cleveland, R. B., Cleveland, W. S., McRae, J. E., Terpenning, I., 1990. STL: A seasonal trend decomposition procedure based on LOESS. Journal of Optical Statistics, 6, pp.3-73.
DeFries, R.S., Hansen, M.C., Townshend, J.R.G., Janetos, A.C. and Loveland, T.R., 2000. A new global 1-km dataset of percentage tree cover derived from remote sensing. Global Change Biology, 6, pp.247-254.
Denny, P., 1984.Permanent swamp vegetation of the Upper Nile.Hydrobiologia,110, pp.79-90.
Duncan, J., Stow, D., Franklin, J. and Hope, A., 1993. Assessing the relationship between spectral vegetation indices and shrub cover in the Jornada Basin, New Mexico.International Journal of Remote Sensing, 14, pp.3395-3416.
FAO, 2003.Land Cover Map of Sudan (FAO Africover Project, accessible at: http://www.africover.org/africover_initiative.htm).
Hansen, M., DeFries, R.S., Townshend, J.R.G, Carroll, M., Dimiceli, C. and Sohlberg, R.A., 2003. Global Percent Tree Cover at a Spatial Resolution of 500 Meters: First Results of the MODIS Vegetation Continuous Fields Algorithm. Earth Interactions, 7 (10),pp.1-15.
Helldén, U.,1987a. An Assessment of Woody Biomass, Community Forests, Land Use, and Soil Erosion in Ethiopia: A Feasibility Study on the Use of Remote Sensing and GIS-Analysis for Planning Purposes in Developing Countries. Lund University Press, ISBN: 9780862381585, 75 pp.
Helldén, U.,1987b. Application of remote sensing data for forest mapping: the Gedaref study. Project: Fuelwood Development for Energy in Sudan, SUD/033/NET, Report No: FAO-FO--GCP/SUD/033/NET, Accession No: 289885, 15 pp.
planning and management, Eastern Region of the Sudan. Final report for the Project: Fuelwood Development for Energy in Su-dan, SUD/033/NET, Report No: FAO-FOG-CP/SUD/033/NET, Accession No: 338129, 21 pp.
Huang, C., Yang, L., Wylie, B., Homer, C., 2001.A strategy for estimating tree canopy density using Landsat ETM+ and high resolution images over large areas. In: Proceedings of the 3rd International Conference on Geospatial Information in Agriculture and Forestry, Denver, Colorado, Nov5-7.
Huete, A. R., Liu, H. Q., Batchily, K., and van Leeuwen, W.,1997. A comparison of vegetation indices global set of TM images for EOS-MODIS. Remote Sensing of Environment, 59,pp.440-451.
Kaufman, Y. J. and Tanré, D., 1992. Atmospherically resistant vegetation index (ARVI) for EOS-MODIS. IEEE Transactions on Geoscience and Remote Sensing, 30, pp.261-270.
Kuhnell, C.A. Goulevitch, B. M., Danaher, T. J. and Harris, D. P., 1998.Mapping Woody Vegetation Cover over the State of Queensland using Landsat TM Imagery.Ninth Australasian Remote Sensing and Photogrammetry Conference Proceedings, Sydney, Australia (available at:
http://www.dnr.qld.gov.au/slats/).
Lu, H., Raupach, M. R., McVicar, T. R. and Barrett,D. J., 2003. Decomposition of vegetation cover into woody and herbaceous components using AVHRR NDVI time series. Remote Sensing of Environment, 86,pp.1-18.
Roderick, M. L., Noble, I. R. and Cridland, S. W., 1999. Estimating Woody and Herbaceous Vegetation Cover from Time Series Satellite Observations. Global Ecology and Biogeography, 8, pp.501-508.
Schwarz, M. and Zimmermann, N. E., 2005: A new GLM-based method for mapping tree cover continuous fields using regional MODIS reflectance data. Remote Sensing of Environment, 95, pp.428–443.
Wessa, P., 2008. Decomposition by Loess (v1.0.1), In Free Statistics Software (v1.1.23-r6), Office for Research Development and Education (accessible at: http://www.wessa.net/).