* Corresponding author.
MULTI-TEMPORAL LAND USE ANALYSIS OF AN EPHEMERAL RIVER AREA
USING AN ARTIFICIAL NEURAL NETWORK APPROACH ON LANDSAT IMAGERY
M. Aquilinoa,E. Tarantinoa*, U. Fratinoa
aPolitecnico di Bari, via Orabona n.4, Bari, 70125, Italy–E-mail: [email protected]
KEY WORDS: Ephemeral River area, Multi-temporal Land Use, LANDSAT Imagery
ABSTRACT:
This paper proposes a change detection analysis method based on multitemporal LANDSAT satellite data, presenting a study performed on the Lama San Giorgio (Bari, Italy) river basin area. Based on its geological and hydrological characteristics, as well as on the number of recent and remote flooding events already occurred, this area seems to be naturally prone to flooding.
The historical archive of LANDSAT imagery dating back to the launch of ERTS in 1972 provides a comprehensive and permanent data source for tracking change on the planet‟s land surface. In this study case the imagery acquisition dates of 1987, 2002 and 2011 were selected to cover a time trend of 24 years. Land cover categories were based on classes outlined by the Curve Number method with the aim of characterizing land use according to the level of surface imperviousness.
After comparing two land use classification methods, i.e. Maximum Likelihood Classifier (MLC) and Multi-Layer Perceptron (MLP) neural network, the Artificial Neural Networks (ANN) approach was found the best reliable and efficient method in the absence of ground reference data. The ANN approach has a distinct advantage over statistical classification methods in that it is non-parametric and requires little or no a priori knowledge on the distribution model of input data. The results quantify land cover change patterns in the river basin area under study and demonstrate the potential of multitemporal LANDSAT data to provide an accurate and cost-effective means to map and analyse land cover changes over time that can be used as input in land management and policy decision-making.
1. INTRODUCTION
River channels in semi-arid regions are usually ephemeral in flow, remaining dry for a high proportion of time and only flowing occasionally, usually as flash floods lasting a few hours. However, flows can cause major channel changes, carrying large amounts of sediment and being highly destructive on human assets, thus impacting on overall risk (Pirotti et al. 2010). Data on channel changes in relation to flow events are still sparse and few channels have been monitored long enough to detect the effects of sequences of flow events as well as of
individual floods (Hooke, 2007). Understanding the current
hydrologic condition of a river basin can be rather difficult when rainfall and runoff gauge stations are lacking. In such cases, to measure the runoff depth or volume of a basin area, the Soil Conservation Model is used (Mishra and Singh, 2006). This model accounts for many of the factors affecting runoff generation, including soil type, land use and treatment, surface condition, and antecedent moisture condition, incorporating them in a single Curve Number (CN) parameter. However, parameterization is often difficult due to lack of spatially distributed information. Often indirect methods are used to estimate the percentage of imperviousness of a certain land-use type (Prisloe et al., 2000). The drawback of this approach is that there is no standardized method for the derivation of an average percentage of imperviousness per land-use type. Furthermore, variability in the amount of imperviousness within the same land-use class is not incorporated (Dams et al., 2008).
Several methodologies can be used to generate impervious surface maps but some of them are expensive and generally not practical for mapping large areas (Bauer et al., 2002). The use of automated or semi-automated image interpretation methods, utilizing the multi-spectral information content of satellite imagery, substantially reduces the effort to derive the impervious surface cover (Figorito et al., 2012).
The Artificial Neural Networks (ANN) approach has been increasingly applied in recent years (Weng 2009). The neural network has several advantages, including its nonparametric nature, arbitrary decision-boundary capability, adaptation to different types of data and input structures, fuzzy output values, and generalization for use with multiple images (Paola and Schowengerdt 1995). Although many neural-network models have been developed, the multilayer perceptron (MLP) feed-forward neural network is the most frequently used. The MLP has been applied in land-use/land-cover classifications (Kavzoglu and Mather 2003; Zhang and Foody 2001; Joshi et al., 2006), impervious surface estimation (Weng et al., 2008), and change detection (Li and Yeh 2002; Nemmour and Chibani, 2006).
The LANDSAT data archive has played an important role across many disciplines, being used as a tool to achieve improved understanding of the Earth's land surfaces and human impacts on the environment. The instrument characteristics (30 m spatial resolution for VIR/NIR and 120 m for TIR, 185 km swath width and 16 day repeat cycle) are intentionally specified to detect the local and regional patterns of change characterizing
the Earth‟s land processes (Sofia et al., 2013).
This paper proposes a change detection analysis method based on multitemporal LANDSAT satellite data, presenting a study performed on the Lama San Giorgio (Bari, Italy) river basin area with the aim of supporting further studies in the field of hydrological processes modelling. After executing an MLC classification on 2011 data for comparison aims, the MLP feed-forward neural network was chosen as classification method, aimed at the characterization of land use according to the level of surface imperviousness. The fact that artificial neural networks (ANNs) behave as general pattern recognition systems and assume no prior statistical model for the input data makes them an excellent technique for change detection analysis when no ground reference data are available for historic satellite imagery.
2. METHODOLOGY
2.1 Study area and data
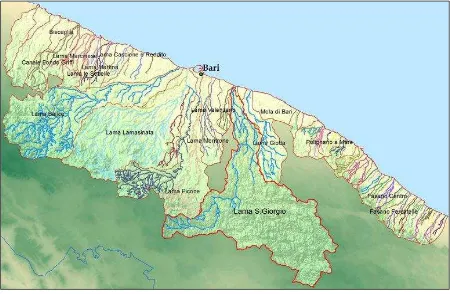
The study area (Figure 1) is the Lama San Giorgio, an ephemeral river located in the central area of Puglia, a region in Southern Italy. The Lama spreads over 42 km, crossing the karstic hilly area of Murge with an average width of 150 m. It starts at the feet of Monte Sannace (383 m o.s.l.), within the municipality of Gioia del Colle, and ends into the Adriatic Sea, 10 km South-East of Bari.
In this area several severe floods have occurred with considerable impact and consequent damages to a vast area of the lower watershed. The Murge karstic area shows a well-developed drainage-network, formed by a dense dendritic pattern in the headwater zone (Murge Alte) which evolves into regularly spaced, incised valleys moving towards the coastal area (Murge Basse). These valleys are locally named "lame", and show subvertical rocky flanks and a flat bottom. Valleys cutting the Murge area act as water channels only during and immediately after heavy rainfall, and can be classified as episodic (ephemeral) rivers (Andriani and Walsh, 2009, Gioia, et al., 2011). In recent years, the important hydraulic function of lame as drainage lines has been heavily altered. Many of them have become pasture or agricultural lands and some even areas of intensive quarrying and urbanization. These changes have significantly transformed, disturbed, and partially destroyed the karst landscape causing the alteration of surface and subsurface runoff, besides a deterioration of the groundwater quality.
Figure 1. Location of the study area of Lama S. Giorgio in the province of Bari (Italy)
Three cloud-free LANDSAT-5 TM sensor imagery were collected on June 13th 1987, June 22nd 2002 and June 15th 2011 to cover a time trend of 24 years. For each date, two contiguous path-row scenes were necessary to cover the whole study area.
LANDSAT data can be freely selected through the USGS EROS web site (http://glovis.usgs.gov/) and nominally processed as Level 1 terrain corrected (L1T). The L1T data are available in GeoTIFF format in the Universal Transverse Mercator (UTM) map projection with World Geodetic System 84 (WGS84) datum. The Level 1T processing includes radiometric correction, systematic geometric correction, precision correction using ground control chips, and the use of a digital elevation model to correct parallax error due to local topographic relief (Roy, et al., 2010; Pirotti et al. 2013).
2.2 Pre-processing
Standard techniques were used to pre-process the LANDSAT TM data acquired for the test site. Pre-processing was required to turn the data into a suitable format for quantitative analysis
and, in particular, to enhance direct spatial and temporal comparability (Foody, et al., 2003).
Four main pre-processing methods commonly used in remote sensing were employed, involving radiometric, atmospheric and geometric correction applied to the data acquired at each acquisition date.
Figure 2. Workflow of the implemented procedures
As an initial step, the images were radiometrically corrected. The related data on surface reflectivity, showing in the image as digital numbers (DN), were converted into absolute forms as reflectance, using the post-launch calibration coefficients on the assumption that this would aid the transferability of relations (CHAVEZ, 1989).
After the mosaicing and resizing (spatial/spectral) procedures, an atmospheric correction was undertaken on each data set to compensate for the effects of the atmosphere on the measured remotely sensed responses. While physically based radiation transfer modelling may be the most accurate means of correcting for atmospheric effects such methods require information on atmospheric properties that, as in this study case, are typically unavailable. Consequently, a simple image-based atmospheric correction procedure was performed, applying the modified dark object subtraction technique proposed by Chavez (1996).
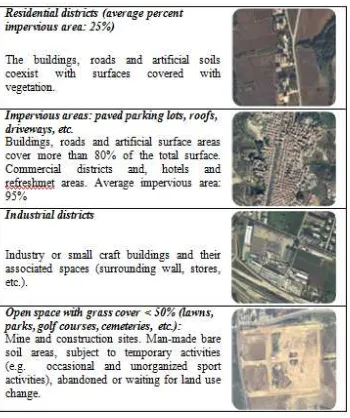
Figure 3. Agricultural land cover categories
Figure 4. Urban land cover categories
Finally, to prepare the following change detection analysis on multi-date LANDSAT images, the homogenization in a unique digital information content was required. Jensen (1996) suggested the Multiple-date Empirical Radiometric Normalization. This method involves the selection of ground targets whose reflectance values are considered as constant over time, i.e. the Pseudo-Invariant Features (PIFs) as named by Schott et al. (1988), to allow intercomparisons between a target image and a base image (in this case the LANDSAT 2011 data) by calculating an image based linear regression. Histogram statistics of the two mask images are then generated to create band-by-band transforms for the radiometric correction. For the purposes of this study, some pseudo-invariant regions (Roads, Buildings, Water, Bare soil, Rock) with similar radiometric characteristics were selected by referring ground truth regions on technical and thematic cartography and orthophoto dating back to the same period of the acquisition dates of the imagery to be corrected.
In order to characterize thematic classes according to their hydrological response to rainfall as required by the CN model, Minimum Mapping Units (MMU) of 900 m2 (pixel area) were processed for classification, aiming at an Overall Accuracy greater than 85%.
Technical and Land Use cartography of 2006 (at scale 1: 5000) and Google Earth data updated to 2011 were used as ground truth information for determining the regions of interest (ROI). Data for each test site were split into independent training and testing sets. Figures 3-4 show the main land cover categories for a reliable understanding of hydrological processes according to the CN model.
2.3 Classification
In the first phase of the study, LANDSAT 2011 imagery was classified through the MLC classification method using ENVI image processing software (ITT, 2009). To follow, the MLP feed-forward neural network with 4 layers was implemented on the same data through the JavaNNS simulator (2001).
Neural Networks (NNs) are connectionist systems (i.e., knowledge is distributed among various nodes). NNs learn by example (training), by doing or by analogy, providing a framework where knowledge is unstructured. They can provide good generalization and they easily adapt to new input data (Mather, 2005).
The two main functions of the artificial neuron are to sum the weighted inputs and to apply a thresholding function to this sum. The summation procedure can be expressed by:
∑ (1)
where represents the sum of the n weighted inputs, wji is
the weight associated with the i th input and xi is the value of the i th input (which is an output from some other neuron).
The thresholding procedure, at its simplest, is a comparison between and some pre-set value, say T. If is greater than T then the neuron responds by sending an output to other neurons to which it is connected further „down the line‟. In this case the Multi-Layer Perceptron (MLP) model uses a more complex thresholding function based on the following sigmoid function:
The term feed-forward is used to describe this kind of neural network model because information progresses from the initial inputs to the final outputs. Learning is accomplished by providing training samples and comparing the actual output of the ANN with the expected output. If there is a difference between the two then the weights associated with the connections between the neurons forming the ANN are adjusted so as to improve the chances of a correct decision and diminish the chances of the wrong choice being made, and the training step is repeated. The weights are initially set to random values.
This „supervisedlearning‟ procedure is followed until the ANN
gets the correct answer.
The Multi-Layer Perceptron is trained using the back-propagation learning rule, which is described by Paola and Schowengerdt (1995).
Assume that a certain training data pixel vector, called a training pattern, is fed into the network and it is known that this training pattern is a member of class i. The output from the network consists of one value for each neuron in the output layer. If there are k possible classes then the expected output
vector dk should have elements equal to zero except for the ith
element, which should be equal to one.
The actual output vector, ok, differs from dk by an amount called
the error E. Thus:
∑ ∑
The error is used to adjust the weights by a procedure which (in fact) maps the isolines or contours of the distribution of the error against the values of the weights, and then uses these isolines to determine the direction to move in order to find the minimum point in this map. This is known as the method of steepest descent. The gradient is measured by the first derivative of the error in terms of the weight; this gives both the magnitude and direction of the gradient. The step length is fixed and, in ANNs terminology, it is called the learning rate. A step is taken from the current position in the direction of maximum gradient and new values for the weights are determined. The error is propagated back-wards through the net from the output layer to the input data, hence the term back-propagation.
Figure 5. Multilayered Neural Network. Units on the left side are input units (spectral bands); units in the centre are hidden units; on the right side, output units (land cover classes)
Figure 5 shows the four-layered network modelled to identify the six initial classes. The input layer consists of as many units as the spectral measures. The output layer instead consists of a number of units equal to the number of classes to be represented. As to the two hidden layers, their number and the number of units they consist of are empirically established according to a general empiric rule: the higher the number of units and hidden layers, the better the network can learn from training samples. Unfortunately though, this affects and reduces the generalization capacity while also increasing training time.
3. RESULTS
The thematic map obtained through the approach presented in this paper was compared to the map generated using the Maximum Likelihood Classifier for accuracy assessment. A cross-examination of the error matrixes observed for 2011 data showed a clear advantage in terms of accuracy in the results obtained from the Neural Network Classification (Tables 1 and 2).
Based on the results obtained with the MLP network, a further classification enhancement process was subsequently implemented, by adding further six classes as listed in the following figures and tables.
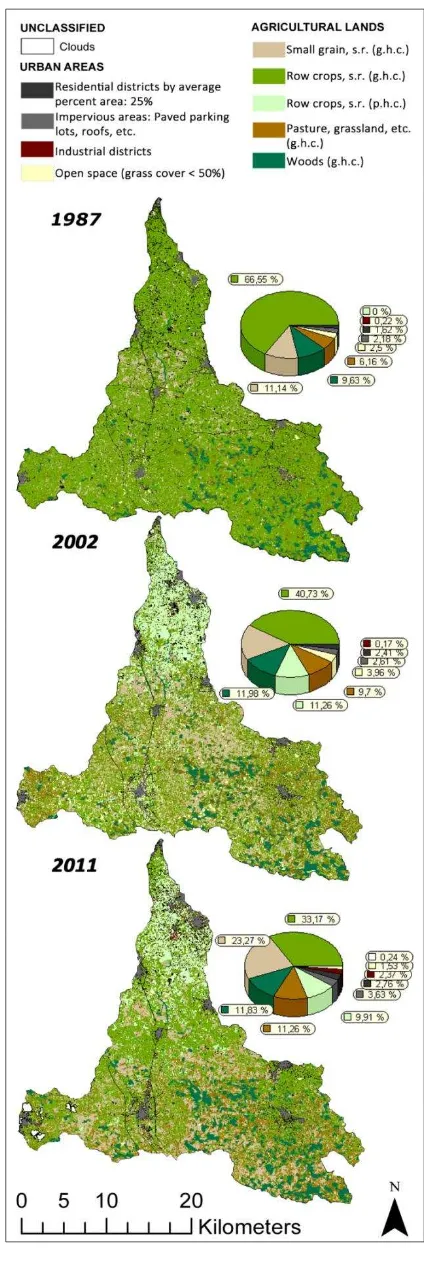
The neural networks already trained and used to classify 2011 data were then used, in the same way, to classify the data sets acquired on 13th June 1987 and 22nd June 2002. The graphical results of such classifications are shown in Figure 6.
Figure 6. Land Cover classes after MLP feed-forward NN classification on the LANDSAT data subsets of 1987, 2002 and 2011.
The three classifications obtained were subsequently compared and analysed based on the percentages observed for each class at each acquisition date, distinguishing three land evolution stages.
Overall Accuracy = 84,35%; Kappa Coefficient = 0,80
Table 1. Accuracy assessment of the MLC classification
Training Class
Overall Accuracy = 95,97%; Kappa Coefficient = 0,95
Table 2. Accuracy assessment of the MLP feed-forward NN classification
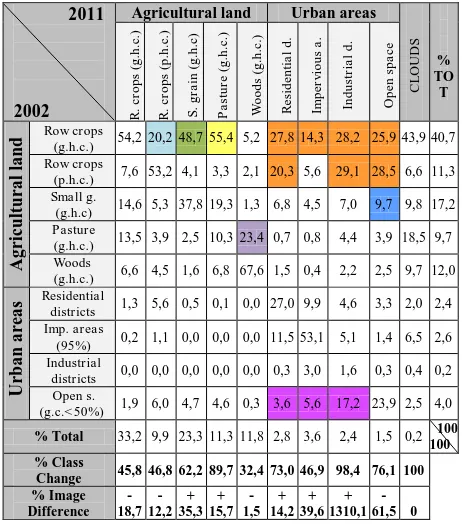
In Tables 3 and 4 the values on the main diagonal represent the percentages of areas not subject to change over time for each class. The values in the columns indicate which classes (and by which percentage) featured in which areas at each evolution stage.
The different colours highlight values which may be variously interpreted in terms of land evolution:
- Orange cells: percentage of urban areas used as farming land at a previous stage.
- Sky-blue cells: percentage of areas used for intensive crops under greenhouses or plastic covers, previously featuring simpler crops.
- Magenta cells: percentage of areas featuring completed buildings which showed as building sites at a previous stage.
- Turquoise cells: percentage of areas featuring cereal crops that, at the initial stage, were temporarily used for rotation meadow (fallow land).
- Yellow cells: percentage of areas used as pasture or unused but previously farmed.
- Green cells. Percentage of areas used for cereal crops but previously used for other crops.
- Purple cells: percentage of wood lands previously featuring sparse vegetation.
The multi-temporal comparison performed also highlighted some imperfections in the classification methodology presented, as for the issue of mixed pixels due to LANDSAT data geometric resolution. This showed particularly with the main arterial roads which were classified either as areas having a 95% average imperviousness or as residential areas (with an average imperviousness of 25%).
Table 3. Matrices of land cover (LC) and changes (Percentages) from 1987 to 2002
Table 4. Matrices of land cover (LC) and changes (Percentages) from 2002 to 2011
The main land use changes observed between 1987 and 2011 include:
-The conversion of many farming and natural pasture areas into wheat-growing fields; according to various bibliographic sources, such conversion has been incentivised since the 1980s through regional, national and European funding aimed at increasing farming productivity in under-developed areas. In Puglia, and particularly in the Alta Murgia area, deep tilling and mechanical rock crashing (the so-called “de-stoning” practice) were required to transform rocky areas into cropped fields.
-With such practice being sanctioned by the Regional Law 54/81 for land improvement, its use quickly spread all over the region causing the transformation of thousands of hectares of land. Some authors estimate a consequent 35-40% increase in the total amount of de-stoned land. -A generalised increase of impervious areas which may be
ascribed to specific land planning strategies causing the abandon of historical building heritage in favour of urban building expansion (not always by the law).
-The diffusion of intensive crops under greenhouses or plastic covers: plastic-covered vineyards feature as the main farming practice in the lower part of the Lama.
-processed and applied to other geographical areas.
The main advantages observed in the utilization of NN, in comparison with other conventional statistical techniques such as MLC, include:
- absence of constraints in the statistic distribution of input data;
- generalization capacity, i.e. capacity to recognize input similar but non-identical to that used for training;
- tolerance to noise present in the training set (although outliers, i.e. wrong information, are not tolerated);
- linear capture capacity, i.e. the capacity to capture non-linear relations among input and output variables;
- higher accuracy of results on medium resolution data. A few disadvantages were also observed:
- incertitude on architecture features, e.g. number of layers and of units within intermediate and hidden layers, unit connections, and optimal value of training coefficient: there is no certain rule but only empirical criteria;
- training times are much longer than with a statistic classifier;
- overtraining risk, i.e. an over-precise correspondence of characters to the learning set may impair the generalization capacity of the network.
To improve the method presented, further studies shall be performed with more complex input, such as ancillary data of other nature and provenance to be associated with radiometric information. This may lead to further accuracy in the recognition of problematic classes, such as those extracting urban areas.
REFERENCES
Andriani, G. and Walsh, N., 2009. An example of the effects of anthropogenic changes on natural environment in the Apulian karst (southern Italy). Environmental geology, 58(2): 313-325.
Bauer, M., Doyle, J. and Heinert, N., 2002. Impervious surface mapping using satellite remote sensing, Geoscience and Remote Sensing Symposium, 2002. IGARSS'02. 2002 IEEE International. IEEE, pp. 2334-2336.
Chavez, P., 1989. Radiometric calibration of LANDSAT Thematic Mapper multispectral images. Photogrammetric Engineering and Remote Sensing, 55: 1285-1294.
Chavez, P.S., 1996. Image-based atmospheric corrections-revisited and improved. Photogrammetric Engineering and Remote Sensing, 62(9): 1025-1035.
Dams, J. et al., 2008. Improving hydrological model parameterisation in urbanised catchments: remote sensing derived impervious surface cover maps. Water and Urban Development Paradigms: Towards an Integration of Engineering, Design and Management Approaches: 405. Figorito, B., Tarantino, E., Balacco, G. and Fratino, U., 2012. An object-based method for mapping ephemeral river areas from WorldView-2 satellite data, SPIE Remote Sensing. International Society for Optics and Photonics, pp. 85310B-85310B-9.
Foody, G.M., Boyd, D.S. and Cutler, M.E.J., 2003. Predictive relations of tropical forest biomass from LANDSAT TM data and their transferability between regions. Remote Sensing of Environment, 85(4): 463-474.
Gioia, D., Sabato, L., Spalluto, L. and Tropeano, M., 2011. Fluvial landforms in relation to the geological setting in the “Murge Basse” karst of Apulia (Bari Metropolitan Area, Southern Italy). Journal of Maps, 7(1): 148-155.
Hooke, J., 2007. Monitoring morphological and vegetation changes and flow events in dryland river channels. Environmental monitoring and assessment, 127(1): 445-457.
ITT Visual Information Solutions. ENVI - Environment for Visualizing Images, Version 4.7, 2009.
JavaNNS, Java Neural Network Simulator, 2001. Available inhttp://www.ra.cs.uni-tuebingen.de/software/JavaNNS/ Accessed in Feb 2012.
Joshi, C., Leeuw, J.D., Skidmore, A.K., Duren, I.C. and Van Oosten, H., 2006. Remotely sensed estimation of forest canopy density: a comparison of the performance of four methods. International Journal of Applied Earth Observation and Geoinformation, 8(2): 84-95.
Kavzoglu, T. and Mather, P., 2003. The use of backpropagating artificial neural networks in land cover classification. International Journal of remote sensing, 24(23): 4907-4938.
Li, X. and Yeh, A.G.O., 2002. Neural-network-based cellular automata for simulating multiple land use changes using GIS. International Journal of Geographical Information Science, 16(4): 323-343.
Mather, P.M., 2005. Computer Processing of Remotely-Sensed Images: An Introduction. Wiley.
Mishra, S.K. and Singh, V.P., 2006. A relook at NEH‐4 curve number data and antecedent moisture condition criteria. Hydrological processes, 20(13): 2755-2768.
Nemmour, H. and Chibani, Y., 2006. Multiple support vector machines for land cover change detection: An application for mapping urban extensions. ISPRS journal of photogrammetry and remote sensing, 61(2): 125-133.
Paola, J. and Schowengerdt, R., 1995. A review and analysis of backpropagation neural networks for classification of remotely-sensed multi-spectral imagery. International Journal of remote sensing, 16(16): 3033-3058.
Pirotti, F., Guarnieri, A., Vettore, A., 2013. State of the art of ground and aerial laser scanning technologies for high-resolution topography of the earth surface.European Journal of Remote Sensing. 46: 66-78. Prisloe, M., Giannotti, L. and Sleavin, W., 2000. Determining impervious surfaces for watershed modeling applications, Proceedings of the 8th National Nonpoint Source Monitoring Workshop, pp. 10-14. The International Archives of the Photogrammetry, Remote Sensing and Spatial Information Sciences, Volume XL-5/W3, 2013
Roy, D.P. et al., 2010. Web-enabled LANDSAT Data (WELD): LANDSAT ETM+ composited mosaics of the conterminous United States. Remote Sensing of Environment, 114(1): 35-49.
Sofia, G., Pirotti, F., Tarolli, P., 2013. Variations in multiscale curvature distribution and signatures of LiDAR DTM errors. Earth Surface Processes and Landforms.
Weng, Q., 2009. Remote sensing and GIS integration: Theories, methods, and applications. McGraw-Hill Professional.
Weng, Q., Hu, X. and Lu, D., 2008. Extracting impervious surfaces from medium spatial resolution multispectral and hyperspectral imagery: a comparison. International Journal of remote sensing, 29(11): 3209-3232.
Zhang, J. and Foody, G., 2001. Fully-fuzzy supervised classification of sub-urban land cover from remotely sensed imagery: statistical and artificial neural network approaches. International Journal of remote sensing, 22(4): 615-628.