PREDICTORS OF SUCCESS IN
UNDERGRADUATE HUMAN PHY SIOLOGY
Vikki L. McCleary, Gayle Aasen, and Henry B. Slotnick
Depa rtm ents of Physiology a nd Neuroscience, University of North Da k ota School of Medica l Hea lth Sciences, Gra nd Fork s, North Da k ota 58202
T
his study tested the hypothesis that measurable attributes in students’ back-grounds are related to their successful completion of an undergraduate human physiology course. Demographic, general academic performance, and science achievement data were obtained from student records for students enrolled during the 1995–1996 academic year, and additional demographic data were obtained from students enrolled during the 1996–1998 academic years. A hierarchical logistic regres-sion analysis explored the relationship of these variables to the percentage of students passing the human physiology course. Predicted passing versus failing showed a sensitivity of 85.5% and specificity of 69.7%. Two independent validations of the logistical regression equation correctly predicted the performance of subsequent groups of students 75.9% and 77.6% of the time.AM. J. PHYSIOL. 277 (ADV. PHYSIOL. EDUC. 22): S119–S126, 1999.
Key words:allied health; logistic regression; sensitivity; specificity; predictors of success
This study sought factors predictive of success in an undergraduate course of human physiology designed for allied health students because identifying factors that place students at risk for failure will benefit students, physiology faculty, and allied health pro-grams. Students at risk of failure will benefit by being alerted to the increased probability of failure and by being encouraged to obtain tutoring earlier in the semester, whereas physiology faculty will benefit by knowing whom to target. The allied health programs will benefit by using the information to identify and counsel students most likely to profit from such activities.
Predictors of academic achievement have been sought in other health-related areas. Predictors identified in the nursing literature included age (10, 11), gender (10, 11), high school rank (6, 21), grade point average (GPA) in high school science courses (6), high school class size (11), Scholastic Achievement Test (SAT) scores (3, 4, 14, 16), preprofessional collegiate GPA
(3, 11, 14, 16), and preprofessional biological sciences GPA [biology, anatomy, physiology, and microbiology (6, 9, 11)]. In addition, anatomy and physiology grades (5–7, 17), SAT verbal scores (3, 4, 6, 14, 17), and nursing course GPAs (10, 12, 14, 16) were recognized as correlating strongly with success on the National Council Licensure Exam for Registered Nurses (NCLEX-RN) and/or completion of the nursing programs, whereas noncognitive and demographic factors were weak predictors of success (1, 3, 14). Studies of predictors of success on the NCLEX-RN exam pro-duced sensitivities ranging from 62.9% to 83.4% and specificity ranging from 57.9% to 84.2% (11, 12, 15–17).
GPA (13), SAT scores (2), and nonacademic factors such as manual dexterity, goals, interview scores, and interpersonal scores (2, 18).
No predictors of success in undergraduate human physiology were found in the literature, so we under-took the study reported here to identify variables predictive of success in undergraduate human physiol-ogy and to begin a national conversation about the use of such predictors among physiology educators.
The University of North Dakota School of Medicine and Health Sciences offers a junior-level undergradu-ate human physiology service course to ,350
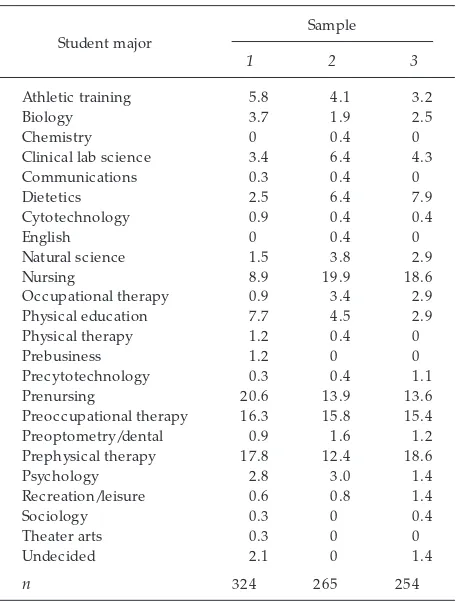
stu-dents per year. Tutoring services were available to all enrolled students. Prerequisites for the course are two introductory courses in the following: anatomy, biol-ogy, or chemistry. Undergraduate human physiology is a prerequisite for a variety of programs that expect the course to be a foundation on which students will build discipline-specific knowledge (Table 1).
MATERIALS AND METHODS
Sample. Subjects were students enrolled during the 1995–1998 academic years. Data for students insa m -ple 1 were retrospectively obtained from the Regis-trar’s list of students having received a grade in undergraduate physiology during the 1995–1996 aca-demic year. A total of 324 students was enrolled during these three semesters. Students receiving an ‘‘incomplete’’ grade were omitted from the study, as were students who had dropped the course. The first analysis reported here was a regression of demograph-ics, prephysiology GPAs, and type and number of college science courses onto passing undergraduate human physiology (Table 2).
Five hundred nineteen students enrolled in the 1996– 1998 academic years completed a questionnaire and consent form on the first day of class each semester. These students were randomly assigned to two groups (sa m ples 2and3) for the purpose of this study (Table 2). Each student was given his or her own secure random identification number and assured that only group results would be reported, as approved by the University of North Dakota Institutional Review Board. Information in Tables 1 and 3–5 presents summarized data from all completed questionnaires. Students who
dropped the course or received an incomplete grade (50 students) were omitted from the subsequent calculations. Only data for students receiving a grade of A, B, C, D, or F were retained to examine the relationship among the variables described and perfor-mance in human physiology using logistic regression and producingEq. II.
Variables.The dichotomous criterion variable ‘‘pass’’ vs. ‘‘fail’’ was the student’s final grade in undergradu-ate human physiology, coded as 0 for D or F (fail) and 1 for A, B, or C (pass). In the analysis of data from sa m ple 1, the predictor variables were student’s major program of study, marital status, gender, age, class level (sophomore, junior, or senior), GPA at the time of enrollment in undergraduate human
physiol-TABLE 1
Under graduate physiology demographics for 1995–1998 academic years
Student major
Sample
1 2 3
Athletic training 5.8 4.1 3.2
Biology 3.7 1.9 2.5
Chemistry 0 0.4 0
Clinical lab science 3.4 6.4 4.3 Communications 0.3 0.4 0 Dietetics 2.5 6.4 7.9 Cytotechnology 0.9 0.4 0.4
English 0 0.4 0
Natural science 1.5 3.8 2.9 Nursing 8.9 19.9 18.6 Occupational therapy 0.9 3.4 2.9 Physical education 7.7 4.5 2.9 Physical therapy 1.2 0.4 0 Prebusiness 1.2 0 0 Precytotechnology 0.3 0.4 1.1 Prenursing 20.6 13.9 13.6 Preoccupational therapy 16.3 15.8 15.4 Preoptometry/dental 0.9 1.6 1.2 Prephysical therapy 17.8 12.4 18.6 Psychology 2.8 3.0 1.4 Recreation/leisure 0.6 0.8 1.4
Sociology 0.3 0 0.4
Theater arts 0.3 0 0
Undecided 2.1 0 1.4
n 324 265 254
Data are percentages of students in each major within samples;n5
ogy, college science achievement (number of com-pleted courses in anatomy, biology, chemistry, and physics), and number of college mathematics courses taken. In analysis of data from sa m ples 2 and 3, additional predictor variables obtained from the ques-tionnaire included birth order, the state in which the student was a legal resident, population of the town or city of residence, size of high school graduating class, number of high school science courses taken (anatomy and physiology, biology, physical science, chemistry, and physics), and high school math courses taken (algebra II and calculus).
Statistical analyses.Exploratory data analysis proce-dures were used to examine the variables and their interrelationships before hypothesis testing began. In the analysis of data from sa m ple 1, hierarchical logistic regression examined the relationship of the predictor variables to successful completion of the course with predictor variables categorized into sets labeled ‘‘demographic,’’ ‘‘academic achievement,’’ and ‘‘college science background.’’ Predictors and first-order interactions among predictors in each set that did not contribute to the criterion measure were eliminated in a stepwise backward manner within each predictor variable set. An alpha level of 0.10 was used in eliminating predictors so that the resulting equations would err in the direction of identifying too
many students at risk of failure rather than identifying too few. The analysis producedEq. I, which identified students anticipated to pass the course among stu-dents fromsa m ples 2and3 (Table 2). This equation was used prospectively with students insa m ple 3to determine shrinkage (i.e., decrease in the equation’s ability to predict due to being used with a different sample).
Data collected from sa m ple 2 were examined in another hierarchical logistic regression that produced Eq. II (Table 2) as described earlier. This analysis determined how much additional predictive ability resulted from inclusion of the high school informa-tion.
RESULTS
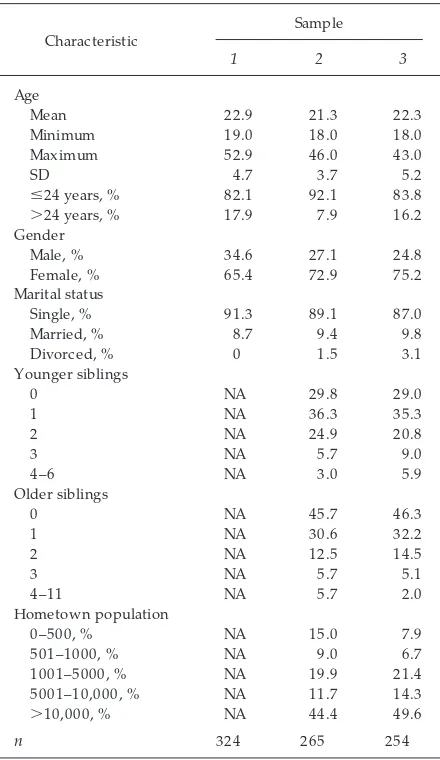
Descriptive statistics are presented in Tables 1 and 3–5. The typical student enrolled in undergraduate human physiology was single, 22 6 4.4 years old (mean6SD; distribution postively skewed), a sopho-more, female, and c arried a 3.3 6 0.4 pre-physiology GPA. The student was most likely to have been either in a prenursing program or admitted into the nursing program. She typically had taken three college science courses before enrollment and came from a North Dakota city with a population.10,001.
TABLE 2
Schedule of data collection and manipulation
Records obtained Academic
year Sample Manipulation Equation Purpose Outcome
From Registrar 1995–1996 1 Hierarchical logistic regression yielded:
I Predict performance Desired a 75% accuracy
Questionnaires from stu-dents
1996–1998 2 Run data using: I Validate predictability of Eq. I
Hierarchical logistic regression produced using demographic data:
II Validate predictability of Eq. Ionsa m ple 2
No significant difference in predictability
3 Run data using: I Validate predictability of Eq. I
Run data using: II Compare accuracy with sa m ples 1and2
No significant difference in predictability
Equa tion I Oddspassing5e21.9011.00(GP A)22.87(Science Courses)10.92(GPA)(Science Courses)
Her high school graduating class had.251 students, and she had taken high school biology, chemistry, physical science, and algebra II.
The initial hierarchical logistic regression produced equations with only one variable predictive of perfor-mance in physiology remaining in the demographic, general academic achievement, and science achieve-ment categories.
Age, categorized as young adults #24 years old and adults.24 years old (19), was the significant predic-tor retained from the set of demographic variables. However, when this variable was introduced into the regression equation with GPA (the variable retained from the academic achievement set) and the number of preprofessional science courses taken (the variable retained from the science background set), it was dropped from the equation because it and its first-order interactions with these variables did not contrib-ute to the statistical prediction of passing physiology.
Interestingly, there was an interaction between the number of science courses taken before physiology
TABLE 3
Under graduate physiology demographics for 1995–1998 academic years
Characteristic
Sample
1 2 3
Age
Mean 22.9 21.3 22.3 Minimum 19.0 18.0 18.0 Maximum 52.9 46.0 43.0
SD 4.7 3.7 5.2
#24 years, % 82.1 92.1 83.8
.24 years, % 17.9 7.9 16.2 Gender
Male, % 34.6 27.1 24.8 Female, % 65.4 72.9 75.2 Marital status
Single, % 91.3 89.1 87.0 Married, % 8.7 9.4 9.8 1001–5000, % NA 19.9 21.4 5001–10,000, % NA 11.7 14.3
.10,000, % NA 44.4 49.6
n 324 265 254
NA, not available; n, no. of students. Students in sa m ple 1 matriculated in 1995; students in sa m ples 2 and3 enrolled in 1996–1998. Precollege demographic data were not obtainable for sa m ple 1.Students were randomly assigned tosa m ples 2and3.
TABLE 4
Under graduate physiology high school demographics for 1996–1998 academic years
Characteristic
Sample
1 2 3
Residence
North Dakota 63.8 61.9 63.8 Minnesota 23.2 27.5 30.7
Canada 2.2 3.0 3.9
Other 10.8 7.5 3.9
Hometown population
0–500 NA 15.0 7.9
501–1000 NA 9.0 6.7
1001–5000 NA 19.9 21.4 5001–10,000 NA 11.7 14.3
.10,000 NA 44.4 49.6 High school course taken
Anatomy NA 18.4 19.6 Anatomy/physiology NA 27.8 24.7 Biology NA 94.4 95.7 Calculus NA 30.5 33.3 Chemistry NA 91.4 90.2
Math NA 89.5 89.8
Physiology NA 6.4 5.5 Physical science NA 77.1 74.5 Physics NA 54.1 54.5 High school graduating class size
0–10 NA 3.1 1.2
11–50 NA 27.5 20.5
51–100 NA 12.1 15.7
101–250 NA 18.1 26.4
.251 NA 39.2 36.2
and prephysiology GPA such that the probability of physiology success increased with the number of science courses taken for students with a GPA.3.0, whereas it decreased with those with a GPA,3.0 (see Fig. 1).
Using a predicted probability of passing of 50% as the cutoff,Eq. Ihad associated sensitivity and specificity as shown in Table 6; the correct prediction rate was 82.4%. Cross-validation results (i.e., use of Eq. I to predict performance of students insa m ples 2 and3) showed a shrinkage of 6.5% and 4.8%; the percentages of correct classification of students were 75.9% and 77.6%.
A second hierarchical logistic regression considered additional demographic data including where the student was in his or her family’s birth order. These new variables were introduced into the equation after those from Eq. I, and the resulting formula (Eq. II) did not increase the predictability of passing beyond
what was possible usingEq. I. Thus the new variables were dropped from consideration. The variables con-sidered in each group are displayed in Tables 2–5.
DISCUSSION
The predictor variables in this study have been used with mixed success in other studies (4, 7, 11, 12, 16, 17). Not surprisingly, the predictor variables most strongly associated with passing physiology were prephysiology GPA and the number of college science courses taken before enrollment in physiology, demon-strating that past academic performance predicts future academic performance.
This study also found an interaction between prephysi-ology GPA and the number of college science courses taken before enrollment that had not been previously noted, possibly because the interaction had never been investigated. The interaction shows that a ‘‘B’’ average is roughly the cutoff for students whose success increases with the number of science courses taken versus those for whom additional science courses predispose toward failure. We suspect that students who do not maintain this average are ‘‘washed out,’’ i.e., less able students leave their programs of study early, whereas marginal students remain in their programs longer.
Our data suggest that students’ ages are inversely related to performance. However, once the number of science courses completed and GPA appeared in the equation, age failed to make an additional contribu-tion to the equacontribu-tion’s ability to predict success or failure. This finding is supported by Mills et al. (15), who found that the odds of students failing NCLEX-RN increased almost twofold for every decade increase in age, although this predisposition vanished by the end of the third year. At the University of North Dakota, students take physiology as a prerequisite for admis-sion to their major program; thus they should have class ranking similar to the data obtained from stu-dents at the end of the freshman and/or sophomore year. We suspect, in the absence of rigorously col-lected data, that older students may use memorization techniques as opposed to application techniques. In addition, we wonder whether disuse has diminished their math and science recall. The allied health
pro-TABLE 5
Under graduate physiology demographics for 1995–1997 academic years
Sophomore, % 46.4 42.5 40.5 Junior, % 38.9 39.1 36.4 Senior, % 14.5 18.4 22.8 GPA at enrollment
(05F, 45A)
Mean 3.2 3.3 3.4
Minimum 1.6 2.0 2.3
Maximum 4.0 4.0 4.0
SD 0.5 0.4 0.4
No. of college science courses taken
One, % 6.8 1.5 1.2
grams should be alerted to this age factor so that appropriate intervention strategies may be developed.
The sensitivity derived fromEq. I(85.7%) was higher than previously reported in the nursing literature (62.96–84.96%), whereas the specificity reported from our study (70.5%) fell within the range reported in other studies (57.9–91.2%) (11, 12, 15–17), even though we selected an alpha level that predisposed the equation to overestimate the number of students at risk.
Suggestions for further r esear ch.The use of learn-ing styles as a predictor of success in physiology has been reported in the literature with conflicting results (8, 9, 20). A student’s learning style is believed to influence the methods by which each student learns, and if it is not congruent with the instructional methods used in class, the student’s ability to learn may be hindered. If learning styles of the physiology
students could be assessed, faculty would then better understand how their students learn and appropriate instructional formats could be identified and imple-mented. Students could also be counseled in terms of how best to learn in class and study on their own.
Application to teaching physiology.With the use of the present data and mathematical model, collabora-tion with the allied health programs to develop strategies to assist students identified at risk of failure is recommended. Also, additional collaboration is rec ommended to determine whether suc c essful completion of human physiology is predictive of students’ successful completion of allied health pro-grams.
In conclusion, the results of the study indicate that it is possible to accurately predict whether any given student will pass physiology given their prephysiology GPA and number of science courses completed before
FIG. 1.
Graphic description of observed equation for pr edicting success. The r elationship of grade point average (GPA) and science courses completed to the pr obability of passing is displayed using the Eq. 1 [Oddspassing5
e21.9011.00(GPA)22.87(Science Courses)10.92(GPA)(Science Courses)]. The horizontal ax is
enrollment. Early identification of students at risk for failure is important because it may allow time for early and appropriate intervention (tutors, faculty assis-tance, increased study time, etc.), thus improving the likelihood of students’ learning more and so success-fully completing the course.
We thank Alice Poehls, Registrar, for help in data retrieval, Carol Winkels and Kathleen Call for secretarial assistance, and Biomedical Communications for technical assistance.
Address for reprint requests and other correspondence: V. L. McCleary, Dept. of Physiology, Univ. North Dakota School of Medicine and Health Sciences, 501 N. Columbia Rd., Grand Forks, ND 58202 (E-mail: [email protected]).
Received 15 March 1999; accepted in final form 24 August 1999.
Refer ences
1. Allen, C. B., Z. R. Higgs, and J. R. Holloway. Identifying students at risk for academic difficulty. J. Prof. Nurs. 4: 113–118, 1988.
2. Blaisdell, E. A., and D. Gor don. Selection of occupational therapy students.Am . J. Occup. Ther. 33: 223–229, 1979. 3. Dell, M. S., and W. J. Valine. Explaining differences in
NCLEX-RN scores with certain cognitive and non-cognitive factors for new baccalaureate nurse graduates. J. Nurs. Educ. 29: 158–162, 1990.
4. Foti, I., and S. DeYoung.Predicting success on the National Council Licensure Examination-Registered Nurse: another piece of the puzzle.J. Prof. Nurs. 7: 99–104, 1991.
5. Fowles, E. R.Predictors of success on NCLEX-RN and within the nursing curriculum: implications for early intervention.J. Nurs. Educ. 31: 53–57, 1992.
6. Glick, O. J., E. McClelland, and J. C. Yang. NCLEX-RN: predicting the performance of graduates of an integrated baccalaureate-nursing program.J. Prof. Nurs. 2: 98–103, 1986. 7. Griffiths, M. J., C. A. Bevil, P. C. O’Conner, and D. M. Wieland.Anatomy and physiology as a predictor of success in baccalaureate nursing students.J. Nurs. Educ. 34: 61–66, 1995. 8. Harasym, P. H., E. J. Leong, B. B. Juschka, G. E. Lucier, and F. L. Lorscheider.Myers-Briggs psychological type and achieve-ment in anatomy and physiology. Am . J. Physiol. 268 (Adv. Physiol. Educ. 13): S61–S65, 1995.
9. Harasym, P. H., E. J. Leong, G. E. Lucier, and F. L. Lorscheider. Gregorc learning styles and achievement in anatomy and physiology. Am . J. Physiol. 268 (Adv. Physiol. Educ. 13): S56–S60, 1995.
10. Hor ns, P. N., P. O’Sullivan, and R. Goodman.The use of progressive indicators as predictors of success and perfor-mance of BSN graduates.J. Nurs. Educ. 30: 9–13, 1991. 11. Jenks, J., J. Selekman, T. Br oss, and M. Paquet.Success in
NCLEX-RN: identifying predictors and optimal timing for inter-vention.J. Nurs. Educ. 28: 112–118, 1989.
12. Krupa, K., M. Quick, and T. Whitley.The effectiveness of nursing grades in predicting performance on the NCLEX-RN.J. Prof. Nurs. 4: 294–298, 1988.
13. Levine, S. B., H. G. Knecht, and R. G. Eisen.Selection of physical therapy students: interview methods and academic predictors.J. Allied Hea lth15: 143–151, 1983.
14. McKinney, J., S. Small, N. O’Dell, and B. A. Coonr od.
Identification of predictors of success for the NCLEX and students at risk for NCLEX failure in a baccalaureate nursing program.J. Prof. Nurs. 4: 55–59, 1988.
15. Mills, A. C., M. E. Sampel, V. C. Pohlman, and A. M. Becker.
The odds of success on NCLEX-RN by nurse candidates form a four-year baccalaureate-nursing program. J. Nurs. Educ. 31: 403–408, 1992.
16. Payne, M. A., and M. A. Duffey. An investigation of the predictability of NCLEX scores of BSN graduates using aca-demic predictors.J. Prof. Nurs. 2: 326–332, 1986.
17. Quick, M. M., K. C. Krupa, and T. W. Whitley. Using admission data to predict success on the NCLEX-RN in a baccalaureate program.J. Prof. Nurs. 1: 364–368, 1985.
TABLE 6
Under graduate physiology sensitivity and specificity for 1995–1998 academic years
Sample
1 2 3
Predicted pass 258 235 210 Observed pass 241 177 194 Correct predicted pass 221 147 161 Sensitivity, % 85.7 86.0 88.0
Predicted fail 66 53 62 Observed fail 83 47 51 Correct predicted fail 46 23 29 Specificity, % 69.7 43.9 46.8
Total predicted correct 267 170 190
n 324 224 245
% Total predicted correct 82.4 75.9 77.6
18. Rifken, S. M., A. Matur en, J. J. Bradna, L. Brace, and M. Jacobs.Uniform admissions system for a clinical laboratory sciences program.Am . J. Med. Technol. 47: 489–495, 1981. 19. Slotnick, H. B., M. H. Pelton, M. L. Fuller, and L. Tabor.
Adult Lea rners on Ca m pus. Washington, DC: Falmer, 1993, p. 5.
20. Tharp, G. D. Relationship between personality type and achievement in an undergraduate physiology course. Am . J. Physiol. 262 (Adv. Physiol. Educ. 7): S1–S3, 1992.