EDGE-BASED REGISTRATION FOR AIRBORNE IMAGERY AND LIDAR DATA
L.C. Chen a, *, C.Y. Lo b
a
Center for Space and Remote Sensing, National Central University, Taiwan - [email protected]
bDept. of Civil Engineering, National Central University, Taiwan - [email protected]
Commission III, WG III/4
KEY WORDS: Aerial Imagery, Building, Detection, LIDAR, Model, Registration
ABSTRACT:
Aerial imagery and LIDAR points are two important data sources for building reconstruction in a geospatial area. Aerial imagery implies building contours with planimetric features; LIDAR data explicitly represent building geometries using three-dimensional discrete point clouds. Data integration may take advantage of merits from two data sources in building reconstruction and change detection. However, heterogeneous data may contain a relative displacement because of different sensors and the capture time. To reduce this displacement, data registration should be an essential step. Therefore, this investigation proposes an edge-based approach to register these two data sets in three parts: (1) data preprocessing; (2) feature detection; and (3) data registration. The first step rasterizes laser point clouds into a pseudo-grid digital surface model (PDSM), which describes the relief with the original elevation information. The second step implements topological analyses to detect image edges and three-dimensional structure lines from the aerial image and PDSM. These detected features provide the initial positions of building shapes for registration. The third part registers these two data sets in Hough space to compensate for the displacement. Because each building may have prominent geometric structures, the proposed scheme transforms these two groups of edges, and estimates the correspondence by the Hough distribution. The following procedure then iteratively compares two groups of Hough patterns, which are from an aerial image and LIDAR data. This iterative procedure stops when the displacement is within a threshold. The test area is located in Taipei City, Taiwan. DMC system captured the aerial image with 18-cm spatial resolution. The LIDAR data were scanned with a 10-point density per square meter using the Leica ALS50 system. This study proposed a 50 cm spatial resolution of PDSM, which is slightly larger than the point spacing. The experiment selected two buildings to evaluate the performance of the proposed scheme. The manually edited building boundaries from the stereo aerial images are the reference data for validation. Comparisons indicated that the registration procedure could adjust the displacement within 50 cm, which relates to PDSM resolution. These preliminary results also demonstrated the possibility of providing locations for building reconstruction.
* Corresponding author
1. INTRODUCTION
Buildings are essential objectives in a geospatial area. To achieve building modeling, the detection and reconstruction of building models comprise two major steps. Within the literature, three common data sets are used frequently. These include topomaps, aerial images, and LIDAR data. These three data sets represent building geometries in different phases. Topomaps describe existing building shapes with polylines or polygons, so that the locations are well known in a single time point. These vector data can generate models directly with accurate contour lines. However, topomaps may lack structure lines on rooftops. In certain places, even topomaps do not contain the elevation information. For the reconstruction of new buildings, changed structures, and detailed buildings, topomaps are insufficient for building reconstruction. Aerial images and LIDAR data then become two important data sources.
Aerial images implicitly exhibit building geometries by edges and corners. Building extraction thus becomes a necessary step. The stereo pairs provide a basis to manually measure corners (Gruen and Wang, 2001) or structure lines (Rau and Chen, 2003) for building reconstruction with semiautomatic processes. By improving modeling automation, matching and positioning techniques generate the digital surface model (DSM) to compare with the designed primitives and reconstructed
building models by using the model-based concept (Hammoudi and Dornaika, 2011) or extract building areas by image classification (Zebedin et al., 2006). Although these approaches can enhance the modeling ability, the quality of generated DSM restricts the details of focused buildings directly.
Conversely, the laser scanning system can provide dense point clouds to illustrate relief. This device blindly collects three-dimensional information of all objects along flight strips with discrete points (Ackermann, 1999). Building extraction is thus a high priority. In comparison with aerial imagery, the distribution of point clouds is helpful to identify building locations by using the elevation constraint. However, using this unorganized format may be difficult to delineate building boundaries directly by using image processing. Additional processes are necessary. Accordingly, numerous studies have proposed varied strategies to estimate three-dimensional lines from LIDAR data (Sohn and Dowman, 2007; Pu and Vosselman, 2009; Wang and Tseng, 2010). The major concept is the segmentation to derive point clouds of building facades and intersect lines for model reconstruction. The segmentation results depend on the selected mathematical models for point collection.
Based on the combination of merits from heterogeneous data sets, data integration may be helpful to improve the degree of International Archives of the Photogrammetry, Remote Sensing and Spatial Information Sciences, Volume XXXIX-B3, 2012
XXII ISPRS Congress, 25 August – 01 September 2012, Melbourne, Australia
automation. Many studies on building reconstruction have been performed using integrating topomaps with LIDAR data (Chen et al., 2008) or by aerial images (Suveg and Vosselman, 2004). Because topomaps only describe precise building locations and contours, the data may lack inner structure lines that represent building diversity. The detection of structure lines thus becomes a necessary step to identify building geometries. However, the revision of topomaps is time-consuming, the information in the maps may not be timely. That means, new buildings do not exist in topomaps, and other data sources are necessary for detection in the reconstruction procedure. Accordingly, related studies focused on the integration of images and LIDAR data for further procedures (Wendt, 2007; Palenichka and Zaremba, 2010; Habib et al., 2010; Cheng et al., 2011). In their studies, they performed point detection (Wendt, 2007; Palenichka and Zaremba, 2010) or edge detection (Awrangjeb et al., 2010; Habib et al., 2010) with both data sets to identify the correspondence. Under the modeling consideration, edges can provide additional linear information than corner features. However, these detected edges from LIDAR data are constrained by used thresholds. Therefore, some edges may be discontinuous and piecewise. These candidates must be modified.
To improve data registration, this study proposed a topological analysis to detect linear features simultaneously from aerial imagery and LIDAR data. The proposed scheme can derive detailed linear features and analyze the correspondence between these two data sets in Hough space. The preliminary results indicated that this structure-based concept could assist in the modification of data displacements, instead of registration with local edges.
2. METHODOLOGY
This study proposes a raster-based approach to register the aerial image and LIDAR data automatically by using feature edges. The scheme contains three parts: (1) preprocessing; (2) feature detection; and (3) registration. The workflow is shown in Fig. 1.
Figure 1. Workflow
2.1 Preprocessing
Because the laser scanning data contain three-dimensional discrete points, it is difficult to describe the spatial relation of each point with its neighboring points. For further detection procedures, this step rasterizes LIDAR points to generate grid data, enabling facile estimation of each grid in eight directions. In addition, the traditional rasterization process may be used to recalculate and change the elevations by mathematical
interpolation. To preserve the original values, this step involves comparing LIDAR points within each grid and extracting the highest point to generate a pseudo-DSM (PDSM).
2.2 Feature Detection
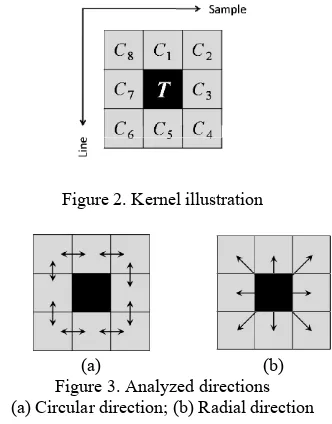
The second step implements the topological analysis to detect edges and structure lines independently from the aerial image and LIDAR data. The objective is to detect feature lines of buildings without threshold selection. The major concept is to estimate the topological permutations of numerical differences and locate feature candidates. This step assumes that each feature can be separated into several parts with many 3 x 3 squares. The basic unit that is formed is shown in Fig. 2. According to the common characteristics between image edges and structure lines, the numerical differences of circular direction are greater than the differences of radial direction on each grid (shown in Fig. 3) (Lo and Chen, 2011). Therefore, the formulas for the proposed scheme on this phenomenon in Eqs. (2) and (3) represent the relationship between the nucleus and the surrounding grids.
where RCi is the elevation differences in the radial direction, and CCi is the elevation differences in the circular direction.
Figure 2. Kernel illustration
(a) (b) Figure 3. Analyzed directions
(a) Circular direction; (b) Radial direction
After this computation, this step then involves collecting two series differences in dual directions (shown in Eqs. (4) and (5)).
1, 2, ,
1~8where
RC
'
is the set of differences of radial direction in the basic unit, andCC
'
is the set of differences of the circular direction in the basic unit. Following these feature characteristics, feature lines exist in the intersection of two directions. This step then extracts candidates by determining the intersections of the minimum radial elevation differences and the maximum circular elevation differences.International Archives of the Photogrammetry, Remote Sensing and Spatial Information Sciences, Volume XXXIX-B3, 2012 XXII ISPRS Congress, 25 August – 01 September 2012, Melbourne, Australia
Topologically, these candidates are also compared with designed patterns to identify possible pieces of the feature lines. Therefore, this study designed 12 patterns (shown in Fig. 4) to compare with detected candidates and to extract possible pieces of the feature lines. In Fig. 4, the gray grids present possible locations of a section of one line. If certain grids do not match these patterns, the proposed process then directly considers them isolated noises and removes them.
Figure 4. Designed patterns
2.3 Registration
After line detection, feature lines are extracted from the aerial image and LIDAR data for data registration. To estimate the correspondence between these two data sets, structure lines from the LIDAR data are back-projected onto the aerial image. The following step then transforms these two groups of feature lines into the Hough space. Because each building has a unique geometric orientation in the local area, this investigation considers the complete building structural lines to estimate data displacement. An illustrated example is displayed in Fig. 5, which shows the differences of parametric distributions between two buildings. This step is an iterative process for modifying the positions of projected structure lines and stopping the iteration when the displacement is smaller than the threshold.
(a) (b)
(c) (d) Figure 5. The difference of parametric patterns
(a) Building I; (b) Building II; (c) Hough pattern I; (d) Hough pattern II
3. EXPERIMENTAL RESULTS
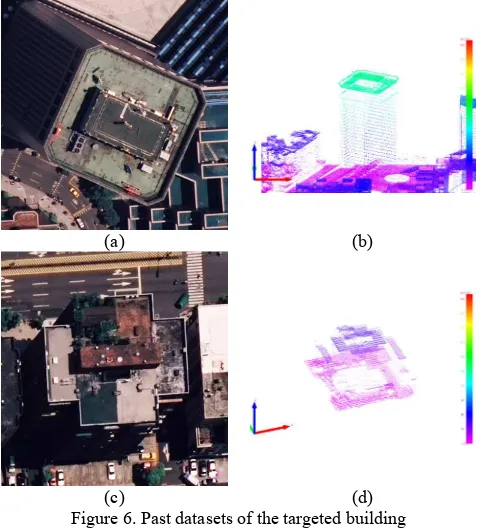
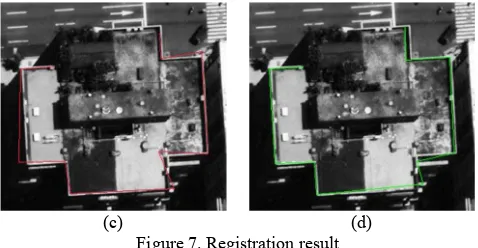
This study selected the test area in Taipei City, Taiwan. In 2008, the LIDAR data were scanned with 10 points per square meter by using the Leica ALS 50. The original point spacing reached 30 cm; therefore, the spatial resolution of PDSM is designed to reach 40 cm. The aerial image was captured in 2008 by a DMC camera. The spatial resolution of past images is approximately 17 cm. Figure 6 shows the aerial image and LIDAR points of two targeted buildings. Figure 7 shows the building boundaries before and after registration in the image space. For validation, the manually plotted corners were used to estimate the registration quality by root mean squared errors (RMSEs). The RMSEs in the directions of the sample and line reach 3-4 pixels.
(a) (b)
(c) (d) Figure 6. Past datasets of the targeted building
(a) Aerial image in Case I, (b) LIDAR data in Case I, (c) Aerial image in Case II, (d) LIDAR data in Case II
(a) (b) International Archives of the Photogrammetry, Remote Sensing and Spatial Information Sciences, Volume XXXIX-B3, 2012
XXII ISPRS Congress, 25 August – 01 September 2012, Melbourne, Australia
(c) (d) Figure 7. Registration result
(a)(c) Projected lines from LIDAR data before registration, (b)(d) Projected lines from LIDAR data after registration
Unit: pixel RMSE-sample RMSE-line
Case I 3.946 2.671
Case II 3.701 3.211
Table 1. Comparison results
4. CONCLUSIONS
This investigation proposed an edge-based scheme to register the correspondence between a single aerial image and airborne LIDAR data. The registered quality reached 3-4 pixels in the image space because of several factors. These include PDSM resolution, shadow areas, and occlusions. These factors may cause certain redundant lines and interfere with the current registration procedure. Future work will improve the registration ability with local modification to reduce the influence of these redundant lines.
5. ACKNOWLEDGMENT
This study was partially supported by the National Science Council, Taiwan, under project number 99-2221-E-008-079-MY3. The authors would like to thank the Department of Land Administration, M.O.I., for the aerial imagery and LIDAR data.
References
Ackermann, F., 1999. Airborne laser scanning—present status and future expectations. ISPRS Journal of Photogrammetry and Remote Sensing, 54, pp. 64–67.
Awrangjeb, M., Ravanbakhsh, M., and Fraser, C. S., 2010. Automatic detection of residential buildings using LIDAR data and multispectral imagery. ISPRS Journal of Photogrammetry and Remote Sensing, 65(5), pp. 457-467.
Chen, L.C., Teo, T.A., Kuo, C.Y., and Rau, J.Y., 2008. Shaping Polyhedral Buildings by the Fusion of Vector Maps and LIDAR Point Clouds. Photogrammetric Engineering and Remote Sensing, 74(5), pp. 1147-1157.
Cheng, L., Gong, J.Y., Li, M.C., and Liu, Y.X, 2011. 3D Building Model Reconstruction from Multi-view Aerial Imagery and Lidar Data. Photogrammetric Engineering and Remote Sensing, 77(2), pp. 125-139.
Gruen, A., and X. Wang, 2001. News from CyberCity-Modeler. Automatic Extraction of Man-Made Objects from Aerial and Space Images (III), Centro Stefano Franscini, Monte Verita, Ascona, Switzerland, pp. 93–102.
Habib, A.F., Zhai, R.F., and Kim, C.J., 2010. Generation of Complex Polyhedral Building Models by Integrating Stereo-Aerial Imagery and Lidar Data. Photogrammetric Engineering and Remote Sensing, 76(5), pp. 609-623.
Lo, C.Y., and Chen, L.C., 2011. Building Boundary Detection Using Topological Gradient Analysis. Proceedings of the 32th Asian Conference on Remote Sensing, Oct. 3-7, Taipei, Taiwan, CD-ROM.
Palenichka, R.M., and Zaremba, M.B., 2010. Automatic Extraction of Control Points for the Registration of Optical Satellite and LiDAR Images. IEEE Transactions on Geoscience and Remote Sensing, 48(7), pp. 2864-2879.
Pu, S., and Vosselman, G., 2009. Knowledge based reconstruction of building models from terrestrial laser scanning data. ISPRS Journal of Photogrammetry and Remote Sensing, 64, pp. 575-584.
Rau, J. Y., and Chen, L. C., 2003. Robust Reconstruction of Building Models from Three-Dimensional Line Segments. Photogrammetric Engineering and Remote Sensing, 69(2), pp. 181-188.
Sohn, G., and Dowman, I., 2007. Data fusion of high-resolution satellite imagery and LiDAR data for automatic building extraction. ISPRS Journal of Photogrammetry and Remote Sensing, 62, pp. 43–63.
Suveg, I., and Vosselman, G., 2004. Reconstruction of 3D building models from aerial images and maps. ISPRS Journal of Photogrammetry and Remote Sensing, 58, pp. 202–224. Wang, M., and Tseng, Y.-H., 2010. Incremental segmentation of lidar pointclouds with an octree-structured voxelspace. The Photogrammetric Record, 26(133), pp. 32-57.
Wendt, A., 2007. A concept for feature based data registration by simultaneous consideration of laser scanner data and photogrammetric images. ISPRS Journal of Photogrammetry and Remote Sensing, 62, pp. 122–134.
Zebedin, L., Klaus, A., Gruber-Geymayer, B., and Karner, K., 2006. Towards 3D map generation from digital aerial images. ISPRS Journal of Photogrammetry and Remote Sensing, 60, pp. 413–427.
International Archives of the Photogrammetry, Remote Sensing and Spatial Information Sciences, Volume XXXIX-B3, 2012 XXII ISPRS Congress, 25 August – 01 September 2012, Melbourne, Australia