APPLIED GEOSPATIAL EDUCATION: ACQUISITION AND PROCESSING OF HIGH
RESOLUTION AIRBORNE LIDAR AND ORTHOIMAGES FOR THE GREAT SMOKY
MOUNTAINS NATIONAL PARK, SOUTHEASTERN UNITED STATES
T.R. Jordan
a *, M. Madden
a, J. B. Sharma
b, S.S. Panda
ba
Center for Remote Sensing and Mapping Science (CRMS), Dept. of Geography, University of Georgia, Athens, Georgia 30602 USA - (tombob, mmadden) @uga.edu
b
GIS/Environmental Science, Institute of Environmental Spatial Analysis, Gainesville State College, Gainesville, GA 30503 USA - (jbsharma, spanda) @gsc.edu
Working Group VI/5
KEY WORDS: LIDAR, Education, Geography, Acquisition, Processing, Training, Orthoimage Submitted to the WG VI/5 - Promotion of the Profession to Young People
ABSTRACT:
In an innovative collaboration between government, university and private industry, researchers at the University of Georgia and Gainesville State College are collaborating with Photo Science, Inc. to acquire, process and quality control check lidar and or-thoimages of forest areas in the Southern Appalachian Mountains of the United States. Funded by the U.S. Geological Survey, this project meets the objectives of the ARRA initiative by creating jobs, preserving jobs and training students for high skill positions in geospatial technology. Leaf-off lidar data were acquired at 1-m resolution of the Tennessee portion of the Great Smoky Mountain National Park (GRSM) and adjacent Foothills Parkway. This 1400-sq. km. area is of high priority for national/global interests due to biodiversity, rare and endangered species and protection of some of the last remaining virgin forest in the U.S. High spatial resolution (30 cm) leaf-off 4-band multispectral orthoimages also were acquired for both the Chattahoochee National Forest in north Georgia and the entire GRSM. The data are intended to augment the National Elevation Dataset and orthoimage database of The National Map with information that can be used by many researchers in applications of LiDAR point clouds, high resolution DEMs and or-thoimage mosaics. Graduate and undergraduate students were involved at every stage of the workflow in order to provide then with high level technical educational and professional experience in preparation for entering the geospatial workforce. This paper will present geospatial workflow strategies, multi-team coordination, distance-learning training and industry-academia partnership.
INTRODUCTION
The acquisition of approximately 1400 sq. km (540 sq miles) of LiDAR data for the Tennessee portion of the Great Smoky Mountains National Park (GRSM) and adjacent Foothills Parkway was completed by The Center for Remote Sensing and Mapping Science (CRMS), Department of Geography, Univer-sity of Georgia (UGA) and Photo Science, Inc (PSI).
The aim of this project was to collect and process high resolu-tion LiDAR elevaresolu-tion data to complete the coverage of the Great Smoky Mountains National Park (GRSM). Previous to this project, high resolution LiDAR elevation data were only available for the North Carolina portion of the Park (971 sq km). Those data were acquired as part of the North Carolina Floodplain Mapping Project. The newly-acquired LiDAR data set includes leaf-off LiDAR data of the Tennessee portion of the GRSM and adjacent Foothills Parkway, acquired in the Feb-ruary-April, 2011 timeframe. This is a high priority area for national/global interests because: 1) it is one of the most bio-diverse areas of the world; 2) it contains some of the most rare and endangered species in the world; 3) the parks protect some of the last remaining virgin forest in the U.S.; 4) the area is threatened by invasive exotic plants and animals, air pollution, overuse by park visitors and surrounding development; and 5) it is at high risk for flooding, fire and earthquake hazards.
Deliverables include 1) Classified LAS Point Cloud Data in LAS 1.2 format, organized as 1500x1500m tiles; 2) DEM bare earth grids in ERDAS Imagine (IMG) format, organized as
1500x1500m tiles; 3) Raw Unclassified LiDAR Point Clouds in LAS 1.2 format, organized by flight line; and 4) metadata. In all, there are 724 tiles covering 1399 sq. km (540 sq. miles) with 3.8 billion total points. Overall vertical accuracy was as-sessed to + 16.5 cm for LiDAR points with an average point spacing of 0.62 m. LiDAR classes include 1 (unclassified), 2 (ground), 7 (noise) and 12 (overlap). All data sets were refer-enced to the UTM NAD83, Zone 17 North coordinate system and the NAVD88 Vertical Datum.
In a unique public/private partnership, Photo Science, Inc. (Norcross, GA and Lexington, KY, USA) was contracted to ac-quire, process and classify the LiDAR data. Ground control and accuracy assessments points were surveyed by a ground crew supervised by a professional surveyor from Photo Science with support from UGA faculty and students. Data quality as-surance and quality control (QA/QC), data inventory and metadata creation was conducted by a team of researchers, stu-dents, interns and employees at UGA. Overall supervision of the project was conducted by UGA faculty. In this way, the U.S. workforce was strengthened via new jobs, continuity of existing jobs and the training of undergraduate and graduate students at two institutions for high skilled geospatial jobs.
PROJECT OVERVIEW
The overall goal of this project with the U.S. Geological Survey was to collect and process high resolution LiDAR data for the Tennessee portion of the Great Smoky Mountains National Park (GRSM) and adjacent Foothills Parkway. Faculty and
students from the University of Georgia Center for Remote Sensing and Mapping Science (UGA-CRMS) coordinated with Photo Science, Inc. (Norcross, GA and Lexington, KY), with cooperation from the National Park Service, to develop the flight plans, collect ground control, coordinate flight timing with weather conditions, process and classify the LiDAR, per-form QA/QC and accuracy analysis, write metadata and prepare the data for delivery.
Great Smoky Mountains National Park was established in 1934 in an attempt to halt the damage to forests caused by erosion and fires associated with logging activities of the 1800s and early 1900s. By the 1920s, nearly two-thirds of the lands that would become GRSM had been logged or burned (Walker, 1991). The Park now protects 2000 sq. km of forestland within the southern Appalachian Mountains – among the oldest moun-tain ranges on earth (Moore, 1988). Elevations in GRSM range from approximately 250 m along the outside boundary of the
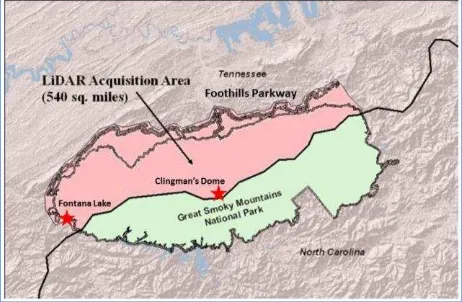
Park to 2,025 m at Clingman’s Dome (Figure 1). Rock fo r-mations in the region are sedimentary, the result of silt, sand and gravel deposits into a shallow sea that covered the area be-tween 900 and 600 million years ago. More than 900 km of streams and rivers that flow within the Park are replenished by over 200 cm of rain per year. As of 2004, 1,637 species (1,293 native and 344 exotic) of flowering plants, 10 percent of which are considered rare, and over 4,000 species of non-flowering plants are found in GRSM (Walker, 1991) The forestlands in-clude over 100 different species of trees and contain the most extensive virgin hardwood forest in the eastern United States (Whittaker, 1956; Kemp, 1993; Houk, 2000). Scientists esti-mate that the flora and fauna currently identified in the Park represent only 10 percent of the total species that are likely pre-sent (Kaiser, 1999). Due to the range of relief, rugged terrain and extensive tree cover, the GRSM is an extremely difficult area to map (Welch, et al., 2000; Jordan, 2002; Welch et al., 2002). The acquisition of high resolution LiDAR will greatly enhance the existing map resources for this rich and valuable region.
Figure 1: The Great Smoky Mountains National Park (GRSM) straddles the border of North Carolina and Tennessee in the Blue Ridge Mountains. LiDAR data were acquired for the Tennessee portion of GRSM and the adjacent Foothills Park-way, a total area of 1400 sq. km. (540 sq. miles).
DATA ACQUISITION
The project contract was signed on 4 February, 2010 and scheduled to extend until 30 April, 2011. Initial flights were conducted in April, 2010 and data covering approximately 25 to 30% of the westernmost (lower elevation) portion of the GRSM LiDAR study area in Tennessee was flown on 22/23 April, 2010. However, flights were suspended and the mission was aborted due to continued snow cover at high elevations when leaf-out occurred.
The LiDAR data acquisition was then postponed. Based on ex-perience with GRSM vegetation mapping and input from the GRSM Supervisory Biologist and Ecologist, we knew the leaves typically begin to fall at the highest elevations in late October and at the lower elevations leaves should be down by the end of November. The plan was to refly the entire LiDAR study area in late November – first of December as soon as the leaves fell at the lower elevations. On 30 November, we were informed that there was no snow in the Smokies and leaves were considered down at all elevations. However there were
severe winds described as “an intermittent mountain wave”
wind event on 29 November with top wind speeds at Cove Mountain tower recorded at 150 kmph and predicted 95 to 145 kmph gusts predicted through the evening of 30November. On 1 December there was snow at the higher elevations and by 6 December there was 5 to 10 cm at the high elevations. It was hoped that this snow would melt and allow another window of LiDAR data collection, but unfortunately due to unusually se-vere weather of cold temperatures and winds, this window did not materialize. As of 20 December there were 12-17 cm of snow accumulation at higher elevations with drifts over 120 cm and 5-10 cm at lower elevations.
We advised the USGS of this delay and requested a telephone conference call on 22 December, 2010 with USGS experts in LiDAR acquisition, representatives of Photo Science and UGA. As a result of this conference call, it was decided that the LiDAR should not be flown with snow on the ground, although a small amount of leaf coverage would be acceptable, if not op-timal. Plans were made to continue to watch the weather and snow conditions in the Smokies so that data could be acquired at the earliest possible date in 2011.
Weather conditions cooperated and snow melted early due to a warming trend in the region. Thus, flights commenced in Feb-ruary and continued through April 2011, when data collection was completed. The final data collection included reflying the entire area originally acquired in April 2010. A total of 2653 flight kilometers of data were collected.
Two LiDAR instruments were employed for the data collection, an Optech Gemini ALTM, and a Leica ALS60, both owned and operated by Photo Science, Inc. (Lexington, KY, USA). In both cases, four multiple discrete returns per pulse were col-lected at rates of 20.2 Hz. There was overlap of 40-50% be-tween adjacent flight lines for a nominal flying height of 1981.2 m AGL. Scan angles were +/- 16 degrees for a swath width of 1134.7 m. Elevations in the project area ranged from 254 m to 2005 m AMSL.
STUDENT TRAINING
During the course of the project, students were provided ad-vanced training by both university faculty and by PSI profes-sionals. Video conferences produced by PSI and held at both UGA and GSC provided students with workflow strategies, equipment overviews and detailed training on data evaluation and QA/QC procedures. Ground surveys for photo control and accuracy assessment points were conducted by UGA students under supervision by PSI surveyors using professional grade DGPS units and total stations. Software employed by students included QCoherent LP360, Applied Imagery QT Modeler, ESRI ArcGIS and Erdas Imagine. Training on the software was provided directly by the developers using video conferenc-ing and site visits. Finally, two formal UGA classes on LiDAR were held during the project period: one graduate-level seminar exploring applications and uses of LiDAR (GEOG8350), and a second upper level undergraduate/graduate class on LiDAR and photogrammetry (GEOG4350/6350).
DATA PROCESSING
The project manager at UGA coordinated with PSI to ac-quire/process the LiDAR, while data post-processing, assess-ment, quality control assurance and the creation of useful prod-ucts were conducted by a team of researchers, students, interns and employees at UGA and PSI. The following pre- and post-processing steps were conducted for the LiDAR data.
Data Acquisition
LiDAR data were acquired by PSI during a series of airborne LiDAR flights considering positioning, orientation, and laser point ranges. Differential Global Positioning System (DGPS) and Inertial Measurement Units (IMU) on-board the aircraft recorded precise position and orientation of the aircraft at all times.
Data Calibration
The airborne LiDAR instruments were calibrated before and af-ter each flight day in order to both calibrate and boresight the LiDAR sensor. The approach included flying both horizontally and perpendicular to established ground control points, usually adjacent to or on-site at any regional airport near Frankfort, KY. This process permitted the LiDAR data to be precisely georeferenced.
Data Classification
PSI personnel classified the LiDAR data using GeoCue Ter-rascan software. In this process, LiDAR points were identified as being members of one of the specified classes, including Un-classified (1), Ground (2), Noise (7) and Overlap (12) (Table 3). The LiDAR data were then split up into 1500x1500m adja-cent and non-overlapping tiles according to the predetermined tiling scheme.
QA/QC
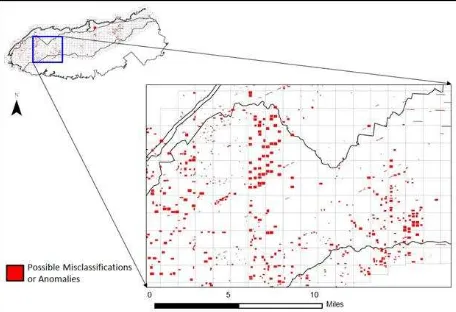
Students and faculty at UGA examined each tile at high resolu-tion using the QA/QC workflow incorporated into the QCoher-ent LP360 software package. The points classified as Ground were used to create a Triangular Irregular Network (TIN) that was displayed in shaded relief with the individual points over-laid. This procedure was designed to identify points that were not correctly classified as Ground. A total of 2603 regions were identified as possible misclassifications or anomalies
(Figure 2). Those points were returned to PSI, examined and reclassified if needed. No points were deleted from the point cloud at any time, as required by the LAS format specification.
Figure 2: QA/QC points of interest. Possible misclassifications or anomalies are marked in red. A total of 2603 regions were identified as possible misclassifications or anomalies.
Final Data Sets
After the QA/QC was completed, the classified point clouds were employed to create a bare-earth raster surface. A 32-bit floating point DEM with a spatial resolution of 1.5 m was cre-ated using ESRI ArcGIS software in order to maintain the detail provided by the very high resolution LiDAR point cloud. The 1500x1500-m tile scheme was enforced for the grid for con-sistency with the classified point cloud tiles. The DEM post-spacing of 1.5x1.5 m satisfies the USGS requirement for high resolution 1/9 arc-second (or better) bare-earth DEMs.
Deliverables
The deliverables for this project were created and assembled, including: Raw Point Cloud, a Classified Point Cloud, a Bare-Earth Surface (Raster DEM) and metadata.
Metadata
Metadata files for each data type (one file for each RAW Li-DAR, Classified LAS Tiles, Bare Earth DEM tiles) were creat-ed in the National Geospatial Data Committee (NGDC) Content Standard for Geospatial Metadata using metadata tools in ESRI ArcCatalog.
ACCURACY ASSESSMENT
Field Survey
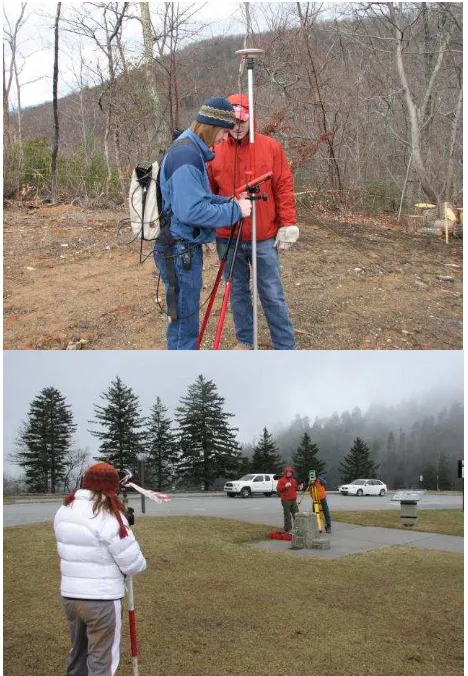
In February, 2011, personnel from PSI and UGA surveyed a to-tal of 299 ground control points (GCPs) organized in 11 clus-ters distributed throughout the LiDAR project area (Figures 3 and 4). A combination of DGPS (real-time kinematic and stat-ic) coupled with total station survey methods was used to measured X, Y, and Z coordinates of the points in a variety of land cover conditions to be used to assess the accuracy of the LiDAR point cloud and raster DEM.
Figure 3: Ground survey was conducted using a combination of DGPS and total station survey methods.
Figure 4: Distribution of points used for accuracy assessment of the LiDAR data. Each location (shown in red) represents a cluster of points measured by DGPS and total station survey. Each cluster averages 27 points for a total of 299 Accuracy As-sessment (AA) points. The grid shows the data tiling scheme.
Accuracy Analysis
Using the 299 check points, the ground-classified points in the LiDAR data were evaluated in terms of elevation accuracy for the general categories of ground cover listed below.
1. Bare earth and low grass (plowed fields, lawns, golf courses)
2. High grass and crops (hay fields, corn fields, wheat fields)
3. Brush lands and low trees
4. Fully covered by trees (hardwoods, evergreens, mixed forests)
5. Urban areas (high, dense, manmade structures)
Overall accuracy was found to have a National Standard for Spatial Data Accuracy (NSSDA) RMSEZ of +0.161 m, which
exceeds the target accuracy of +0.185 m (FGDC, 1998). The minimum and maximum errors are -0.32 and +0.51 m, respec-tively. Finally, accuracy in the land cover sub-classes ranged from +0.12 to +0.20 m. Details are provided in Table 1.
Table 1: Vertical Accuracy of the LiDAR Point Cloud
Statistical Analysis Value
Average Dz 0 m
Minimum Dz -0.32 m Maximum Dz 0.51 m
RMSEz +0.161 m
Standard Deviation 0.162 m
Cover Class RMSE
Overall Accuracy +0.161 m Class 1 - Bare Earth +0.17 m Class 2 - High grass and crops +0.12 m Class 3 - Brush lands and low trees +0.16 m Class 4 - Fully covered by trees +0.20 m Class 5 - Urban areas +0.15 m
DELIVERABLE PRODUCTS
The following elevation data products were created as delivera-bles for this project. The final datasets were shipped to USGS on a portable hard drive on 13 September, 2011. All horizontal data are referenced to the NAD83 UTM Coordinate System, Zone 17, while vertical coordinates are referenced to NAVD88, Geoid09.
1.Raw LiDAR Point Clouds in LAS 1.2 format organized ac-cording to flight line (Base LiDAR Specification, Section IV, Outline 2). No wave form data were included in the collec-tion.
2.Classified LiDAR Point Clouds in LAS 1.2 format organized in 1500x1500m tiles, with no overlap between tiles (Base LiDAR Specification, Section IV, Outline 3). The following classes were used: 1 – Unclassified; 2 – Ground; 7 – Noise; and 12 – Overlap.
3.Bare-Earth Surface (Raster DEMs) in 32-bit floating point ERDAS Imagine format, 1.5 m resolution, organized in 1500x1500m tiles, with no overlap between tiles (Base Li-DAR Specification, Section IV, Outline 4). Georeferencing information is included in the header of each file. The Bare-Earth DEM was created from the Ground-classified LiDAR points to interpolate a regular grid. A 1.5-m grid spacing was employed so as to best represent the resolution of the LiDAR data without generalization.
4.Metadata for each data type (one file for each RAW LiDAR, Classified LAS Tiles, Bare Earth DEM tiles) are provided ac-cording to the NGDC Content Standard for Geospatial Metadata.
5.Supporting documentation, including control points, accura-cy assessment table, study area shapefiles, tile layout index shapefile, LAS analysis and flight logs, deliverable listing
Tile Referencing Scheme
All tiles are referenced to the NAD83, UTM Coordinate Sys-tem, Zone 17, and are uniquely identified using a labelling sys-tem derived from the Military Grid Reference Syssys-tem (MGRS) at the 100-m level of precision for the lower-left corner of the tile.
The tile, 17SKV505540, is described as follows:
17S Grid Zone designator, in this case, UTM Zone 17S KV The 100,000-m square MGRS identifier
505 The three digits of the easting coordinate of the lower-left corner of the tile. The last two digits (representing 100) of the coordinate are truncated. In this case, the full UTM Zone 17 easting coordinate would be 250,500.
540 The three digits of the northing coordinate of the lower-left corner of the tile. The last two digits (representing 100) of the coordinate are truncated. In this case, the full UTM Zone 17 northing coordinate would be 3,954,000.
CONCLUSION
The acquisition of approximately 1400 sq. km (540 sq miles) of LiDAR data for the Tennessee portion of the Great Smoky Mountains National Park and adjacent Foothills Parkway was completed by a unique public/private partnership that included the University of Georgia (UGA) and Photo Science, Inc. (PSI), with cooperation from Gainesville State College (GSC) and the National Park Service (NPS). This project provided students with advanced training in a large data production project using state-of-the-art instruments and software. The students learned how to manage large datasets, geospatial workflows, QA/QC procedures, project and staff management, ground survey tech-niques, reporting and data delivery. Of the total of eight UGA students, involved in this project, five have since graduated and found employment in the geospatial industry. This is a firm testament to the quality of training they received while under-taking this project.
REFERENCES
FGDC,1998. Geospatial Positioning Accuracy Standards. Part 3: National Standard for Spatial Data Accuracy. Federal Geo-graphic Data Committee, Report # FGDC-STD-007.3-1998, 28 pp.
Houk, R., 2000. Great Smoky Mountains National Park: The Range of Life, Great Smoky Mountains Natural History Associ-ation, Gatlinburg, TN. 47 pp.
Jordan, T.R., 2002. Softcopy Photogrammetric Techniques for Mapping Mountainous Terrain: Great Smoky Mountains
Na-tional Park. Doctoral Dissertation, The University of Georgia, Athens, Georgia, 193 pages.
Kaiser, J., 1999. Great Smokies species census under way. Sci-ence, 284 (5421): 1747-1748.
Kemp, S., 1993. Trees and Familiar Shrubs of the Smokies. Great Smoky Mountains Natural History Association, Gat-linburg, TN. 126 pp.
Moore, H.L.A., 1988. A Roadside Guide to the Geology of the Great Smoky Mountains National Park, University of Tennes-see Press, Knoxville, TennesTennes-see. 178 pp.
Walker, S.L., 1991. Great Smoky Mountains: The Splendor of the Southern Appalachians. Elan Publishing, Charlottesville, Virginia, 63 p.
Welch, R., T. Jordan and M. Madden, 2000. GPS surveys, DEMs and scanned aerial photographs for GIS database con-struction and thematic mapping of Great Smoky Mountains Na-tional Park, InternaNa-tional Archives of Photogrammetry and Remote Sensing, Vol. 33, Part B4/3: 1181-1183.
Welch, R., M. Madden and T. Jordan, 2002. Photogrammetric and GIS techniques for the development of vegetation data-bases of mountainous areas: Great Smoky Mountains National Park, ISPRS Journal of Photogrammetry and Remote Sensing, 57(1-2): 53-68.
Whittaker, R., 1956. Vegetation of the Great Smoky Moun-tains. Ecolological Monographs, 26:1-80.
ACKNOWLEDGEMENTS
This LiDAR acquisition project was funded by the U.S. Geo-logical Survey (USGS) through the American Recovery and Reinvestment Act (ARRA) of 2009, Contract #G10AC0015. The LiDAR data acquired, processed and compiled in this pro-ject adheres to the specifications of the USGS Grant Program Announcement No.10HQPA0014 for Proposal #NM-ARRA-0073. The authors would like to acknowledge with gratitude the contributions of the following organizations and individuals to the successful completion of this project.
University of Georgia: Carey Burda, Woo Jang, Nicholas Kruskamp, Andrew Parker, Andrea Presotto, Shadrock Roberts, Thomas Spear, Byungyun Yang and Jane Worley. Photo Science, Inc.: John Bender, Paul Bishop, Byron Freeman, Forrest Godby, Michael Martin, Mark Meade, and Jeff Simmons. Gainesville State College: William Banick, Karen Burry, James Fitzgerald, Dr. Sudanshu Panda, Debra Pilgrim, Dr. JB Sharma, and Christopher Strother. US Geological Survey: Teresa Dean, Margaret Eastman, Karl Heidemann, and Tim Saultz. National Park Service (Great Smoky Mountains National Park): Joshua Albritton, Dr. Tom Colson, Keith Langdon, and Tom Remaley.