HYPERSPECTRAL REMOTE SENSING OF PADDY CROP
USING IN-SITU MEASUREMENT AND CLUSTERING TECHNIQUE
Shreedevi Moharana a, *, Subashisa Dutta b
a Department of Civil Engineering, PhD. Research Scholar, Indian Institute of Technology, Guwahati - [email protected]
b Department of Civil Engineering, Professor, Indian Institute of Technology, Guwahati - [email protected]
KEY WORDS: Spectroradiometer, Hyperspectal measurements, Waveform, Clustering, Nitrogen application, Rice genotypes
ABSTRACT:
Rice Agriculture, mainly cultivated in South Asia regions, is being monitored for extracting crop parameter, crop area, crop growth profile, crop yield using both optical and microwave remote sensing. Hyperspectral data provide more detailed information of rice agriculture. The present study was carried out at the experimental station of the Regional Rainfed Low land Rice Research Station, Assam, India (26.1400°N, 91.7700°E) and the overall climate of the study area comes under Lower Brahmaputra Valley (LBV) Agro Climatic Zones. The hyperspectral measurements were made in the year 2009 from 72 plots that include eight rice varieties along with three different level of nitrogen treatments (50, 100, 150 kg/ha) covering rice transplanting to the crop harvesting period. With an emphasis to varieties, hyperspectral measurements were taken in the year 2014 from 24 plots having 24 rice genotypes with different crop developmental ages. All the measurements were performed using a spectroradiometer with a spectral range of 350-1050 nm under direct sunlight of a cloud free sky and stable condition of the atmosphere covering more than 95% canopy. In this study, reflectance collected from canopy of rice were expressed in terms of waveforms. Furthermore, generated waveforms were analysed for all combinations of nitrogen applications and varieties. A hierarchical clustering technique was employed to classify these waveforms into different groups. By help of agglomerative clustering algorithm a few number of clusters were finalized for different rice varieties along with nitrogen treatments. By this clustering approach, observational error in spectroradiometer reflectance was also nullified. From this hierarchical clustering, appropriate spectral signature for rice canopy were identified and will help to create rice crop classification accurately and therefore have a prospect to make improved information on rice agriculture at both local and regional scales. From this hierarchical clustering, spectral signature library for rice canopy were identified which will help to create rice crop classification maps and critical wave bands like green (519,559 nm), red (649 nm), red edge (729 nm) and NIR region (779,819 nm) were marked sensitive to nitrogen which will further help in nitrogen mapping of paddy agriculture over therefore have the prospect to make improved informed decisions.
1. INTRODUCTION
1.1 General Introduction
Rice has been cultivated for over 10,000 years, mostly in Asia but highly increased in developed country like India. Most of the cultivated area are under rice agriculture in India. Nitrogen (N) fertilizer is one of the most important nutrient for rice production in the world. By increasing the supply of nitrogen in the form of fertilizer to rice plants does not always give high yield (Zhou et al., 2010). To optimize rice yields supply of adequate N is much
essential avoiding the wastage of N fertilizer as plant doesn’t
more than its requirement. Thus excess N application goes as waste also creates environmental problems and become a cause for ground water contamination (Jain et al., 2007; Jaynes et al., 2001). Therefore to reduce water quality degradation, environmental pollution, optimization the N application it is necessary and it can be possible only when one have a primary knowledge on crop species.
1.2 Rice from a remote sensing view point
Now a days, reliable and temporally updated information on rice agriculture is made possible by using remote sensing technology. Several studies has made on to get information regarding crop area, phenology, status, and yield. Spaceborne remote sensing incorporated with crop modeling offers an effective alternative
* Corresponding author. This is useful to know for communication with the appropriate person in cases with more than one author.
that is capable of replacing the traditional methods which are time consuming as well as expensive. Remote sensing on agriculture also offers good which result in production and area statistics that are highly appreciated. Various important information on rice area, start of season, phenological stages, and flood/drought, damages, leaf area index can be extracted from multi-temporal (multi-year, annual, seasonal) multi-sensor data (Holecz et al., 2013). But in some extent the optical broadband remote sensing based on crop services are limited because of single sensor, restriction to time, data acquiring problem and maintenance. The very well known SAR data accessibility is made recently difficult due to the recent failure of the ENVISAT, ASAR and ALOS PALSAR-1 systems (Holecz et al., 2013). Hence, the current use of hyperspectral remote sensing has the potential to sustain the rice agriculture in India as well as in the world.
1.3 Hyperspectral remote sensing perspective
al., 2007). It is revealed that narrow bands reflectance characteristics are correlated with plant parameters like photosynthetically active radiation, Leaf Area Index, biomass (Wiegand et al., 1989, Inoue et al., 1998; Xue et al., 2004). In recent years image acquired from space platform namely Airborne Visible/Infrared Imaging Spectrometer (AVIRIS), hyperspectral Hyperion image acquired by the Earth-Observing (EO-1), Hyperspectral digital airborne imaging spectrometer (DAIS) are used for improving agricultural productivity and economy. Not only this, ground truth hyperspectral data from spectroradiometer has also been used to achieve significant improvement in land cover classification (Janetos and Justice, 2000), different types of forest classification (Newnham et al., 2012), plants under stress (Carter, 1998 ), identification of different crop (Zhang et al., 2012), detecting changes in species composition over time and characterizing biodiversity (Nidamanuri and Zbell, 2011) and finding potential surface soil organic matter areas (Alemie, 2005). Use of hand held hyperspectral devices or space borne images is made possible to distinguish crops in an effective way but it needs rigorous analysis of narrow bands and also a tedious jobs.
Several studies has made on crop separability using hyperspectral data to manage the agriculture field crop in a better way. To find out the relation between different crops types and hyperspectral data various methods like discriminant analysis, principal components analysis, partial least square regression analysis are used. The significant wave bands vary location to location and crop species however red edge and NIR region of spectra plays a major role in crop species discrimination as noticed by Jeffrey et al., 2014 and Zhang et al., 2012.
The studies have concentrated on identifying cultivar levels or strands of a crop like cotton, wheat (Zhang Mahesh, 2008) and overall mixture of these crop species (Rao et al., 2008). However these studies are often constricted to limited observations for a
certain growth stage through out the growing season and didn’t
take care of chances of noise which couldn’t be ignored. Crop classification can be altered due to noisy hyperspectral data and also rapid changes in plant structure in their later growth stages of the growing season (Jeffrey et al., 2014).
With the above concerned issues, an attempt has made to separate rice species with different nitrogen applications using waveform classification approach. More precisely, the objectives of this present study are to discriminate the different species of paddy combined with different nitrogen applications and rice genotypes subjected to without varying nitrogen application. Besides this, to find out noise free spectral library for the crop by using clustering algorithm with the help of ground based hyperspectral measurements taking into consideration. Also and to finding the significant wavebands (in the 350–1050 nm range) in separating rice genotypes and sensitive to nitrogen.
2. MATERIALS AND METHODS
2.1 Study Area
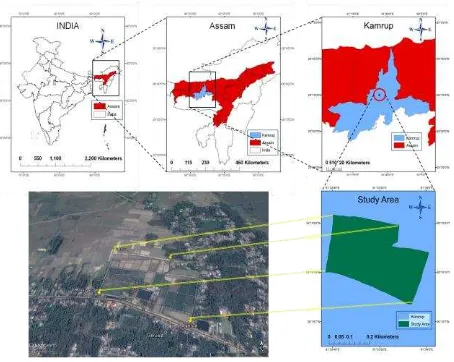
A field experiment was carried out in two years for this research (Figure 1). The study site was an experimental farm of Regional Rainfed Low land Rice Research Station, Geruwa, Assam, India (latitude 26.14°N and longitude 91.77°E). The present study was carried out from January to May in the year 2009 and from April to August in the year 2014. The climate of the study area comes under Lower Brahmaputra Valley (LBV) Agro Climatic Zones. During the monsoon season it receives about 1000-3100 mm of rain fall. The rice developmental age ranges from December to
June in the year 2009 and March to August in the year 2014 during the summer season. The average minimum and maximum temperature ranges from 100C to 320C during these period. The soil type of the experimental site varies from Sandy loam to Silty loam. In the year 2009, the farm was divided into 72 plots each plot of size 3.3 m × 3.4 m in which only eight rice varieties namely Gautam, IR-64, IET-18558, IET-19601, K.Hansa, Chandrama, IET-19600 and IET-20166 were addressed for the observations and the paddy crops was applied to three different levels of nitrogen treatments like low (50kg/ha) medium (100kg/ha) and high (150kg/ha). Fertilizers were applied in three different splits. In the year 2014, the paddy field was divided into 24 plots which comprised of 24 varieties of rice and standard fertilizer dozes were applied to these 24 varieties in three splits. The 24 rice varieties were the mostly cultivated paddy crops in India namely Jaya, Parijat, Luit, Abhishek, Chandrama, Shabhagi Dhan, Ranjit, Baismuthi, CR Dhan 601, Akshya Dhan, Chandan, Mahsuri, Tni, Nilanjana, Anjali, BPT5204, IR64, Tapaswini, Disang, Joymati, Vandana, Kolong, Naveen and no.15.
Figure 1. Experimental site for the research, Assam, India
2.2 Data Used
Dates of
Table 1. Details of hyperspectral measurements from experimental site
2.3 Methodology
2.3.1 Waveform classification approach: The rice genotypes were tried to separate based on their reflectance characteristics. Here an attempt has made to discriminate the rice varieties on the basis of waveform classification approach. The aim of waveform classification procedure is splitting or classifying automatically each data set into different consistent groups. This basically can be done in the setting of supervised classification, corresponding to situations when the different groups of waveforms are identified before the beginning of the classification. However, as waveforms show different patterns over different rice varieties, identifying the groups of waveforms might leads to neglecting a group of unexpected waveforms. In fact, classification with good performance should extract any of existing consistent waveforms as a separate group. Then Hierarchical clustering are used to classify waveforms in different groups. Hierarchical algorithms create a hierarchical decomposition of data set. The hierarchical decomposition is represented by a tree structure which splits a data set into small subsets. The leaves of the tree comprise single objects. The clustering methods basically follow distance measures for finding similarity or dissimilarity between the pairs of entities. The distance between the two entities can be measured using the Minkowski metric (Han and Kamber, 2001) and is given by
1/
when g = 2, distance between two objects is the Euclidean distance.
To avoid the effect of measurement unit in clustering the data should be standardized. Standardizing easurements attempts to give all variables an equal weight. However, if each variable is assigned with a weight according to its importance, then the
2.3.2 Significant Wavebands: The significant wavebands were those that possessed minimum correlation coefficient between them and fairly differentiated the treatments (Jain et al., 2007). This can be done band–band r2 (BBR2) analysis and gives more information of vegetation characteristics by excluding the redundant bands. The correlation between one spectral band with another spectral band was expressed in terms of r2. If a high correlation coefficient exists between any two spectral bands then it signifies they have similar characteristics. In other words the lower correlation between any two bands shows redundant information between the species also carries some of its distinctive features (Jain et al., 2004, Thenkabail et al., 2004).
3. RESULTS AND DISCUSSION
3.1 Spectral reflectance characteristics
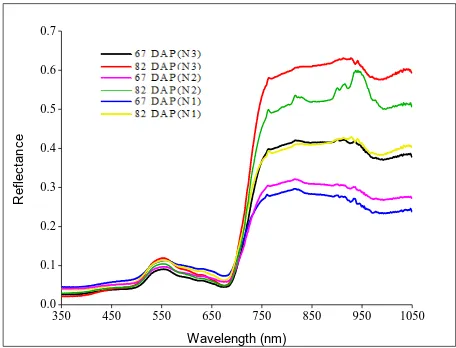
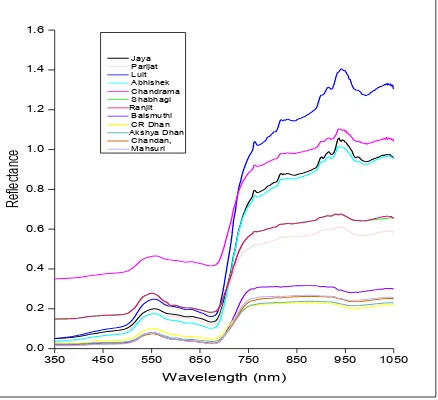
The hyperspectral measurements in the range of 350 to 1050 nm were collected from the experimental site for eight rice varieties with three N application (50, 100, 150 kg/ha) and twenty four rice varieties without varying nitrogen application. The effect of different nitrogen applications of rice varieties at 67 DAP and 82 DAP were found remarkable and for a single variety it was shown below (Figure 2). From the Figure 2, it was clearly observed that the nitrogen application N3 has more impact on crop growth than the other two application both at 67 and 82 DAP where as N1 behaviour was found just opposite to it. By application of N1, growth was less as compared to N2 and N3 application. At 82 DAP crop growth was found to be significant than at 62 DAP. The spectral profiles for different twenty rice varieties with no variation in nitrogen application was derived. The spectral signatures for some of the typical rice varieties at 62 DAP (Figure 3) and at 72 DAP (Figure 4) were shown here. From the Figure 3, it was observed that the spectral response for all the varieties were similar in nature at 62 DAP. From Figure 4, the spectral signatures found quite different for some of the varieties at 82 DAP. From these above figures, it was noticed that the reflectance was high in green region and the transition phase where the reflectance changes from red to NIR called red edge. It slightly varies (680-710 nm) from variety to variety.
Figure 2. Variation of Nitrogen treatments at 67 DAP and 82 DAP
350 450 550 650 750 850 950 1050
350 450 550 650 750 850 950 1050 0.0
0.1 0.2 0.3 0.4 0.5 0.6 0.7
R
e
fl
e
ct
a
n
ce
Wavelength (nm)
Jaya Parijat Luit Abhishek Chandrama Shabhagi Ranjit Baismuthi CR Dhan Akshya Dhan Chandan Mahsuri
Figure 3. Spectral signature of Rice genotypes at 62 DAP
350 450 550 650 750 850 950 1050
0.0 0.2 0.4 0.6 0.8 1.0 1.2 1.4 1.6
R
ef
le
ct
an
ce
Wavelength (nm) Jaya
Parijat Luit Abhishek Chandrama Shabhagi Ranjit Baismuthi CR Dhan Akshya Dhan Chandan, Mahsuri
Figure 4. Spectral signature of Rice genotypes at 72 DAP
There was high reflectance behaviour achieved in near NIR region mostly >720 nm and the water absorption band appeared approximately in region of 940-960 nm. By observing the paddy crop signature behaviour, clustering technique was attempted to discriminate the rice varieties at an easy level.
3.2 Cluster Analysis of rice
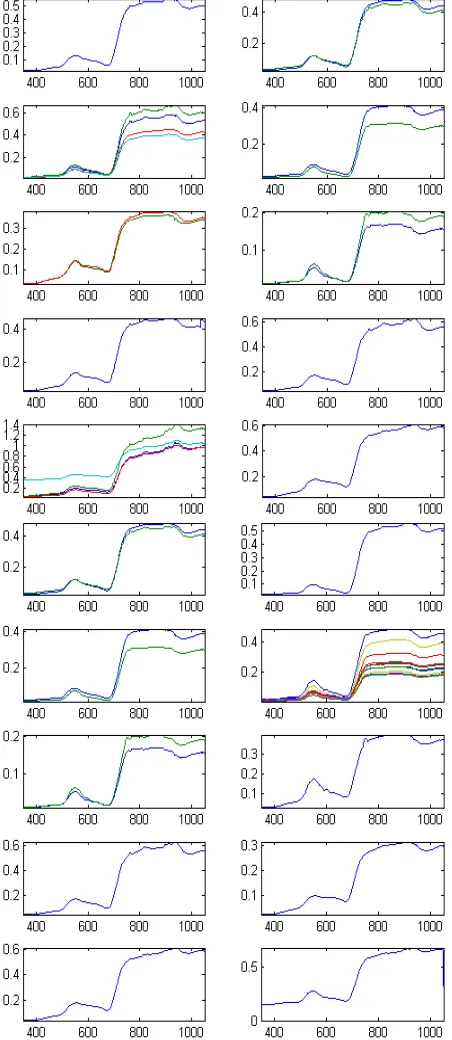
Waveform classification was carried out on the data from each of the plots comprising eight rice varieties namely Gautam, IR-64, IET-18558, IET-19601, K.Hansa, Chandrama, IET-19600 and IET-20166 with three different rates of N applications and also for the data collected twenty four plots comprising twenty four varieties without varying nitrogen application. The waveform was function of wavelength and reflectance in the present study. The number of waveforms were 701 comprising full range of spectral bands (350-1050 nm). By employing hierarchical agglomerative clustering technique, rice varieties were separated into different groups based on three nitrogen applications: N1 (50kg/ha), N2 (100kg/ha), N3 (150 kg/ha) (Figure.5). From Figure 5, we have seen, it also taken care of noise that were acquired during capturing hyperspectral data. Then by neglecting the noisy waveforms accurate spectral signatures for the rice
genotypes were achieved.By comparing the clusters of spectral signatures any two N applications, some of the rice varieties were found separated from each other whereas some of the varieties were not distinguished via three clusters represented two varieties and one cluster represented three varieties with N3 and N2 application respectively in comparison to N1.
(a) N1 application (50kg/ha)
(b) N2 application (100kg/ha)
(c) N3 application (150kg/ha)
By following this hierarchical agglomerative clustering technique, twenty four rice varieties were clustered and formed into different groups (Figure 6). From Figure 6, it was clearly shown the noise were nullified thus resulting in very good spectral library for different twenty four rice genotypes. Also some of the varieties were grouped and represented single variety. Therefore we did not get all the twenty four varieties to be well separated. But some were found different from variety to variety even without varying the nitrogen applications and some were mixed together thus by formed single groups. The details of this information was given in Table 2.
Clusters Discriminated Varieties
Clusters Mixed Varieties
C1 Mahsuri C2 Joymati, Vandana
C7 Chandan C3 Chandrama, CR
Dhan, Vandana
C8 BPT5204 C4 Ranjit, IR64,
Shabhagi
C10 no.15 C5 AkshyaDhan,
Mahsuri, Chandan
C12 Tni C6 CR Dhan601,
AkshyaDhan, Chandan
C16 Naveen C9 Ranjit, Baismuthi,
Tni
C17 Parijat C11 Tapaswini, Disang, Joymati
C18 Shabhagi C13 Vandana, Kolong
C19 Luit C14 AkshyaDhan,
Chandan, Mahsuri, Tni, Nilanjana, Anjali, Naveen and
no.15.
C20 Baismuthi C15 CR Dhan601,
BPT5204
Table 2. Discriminated and mixed rice genotypes from clustering
3.3 Critical wave bands
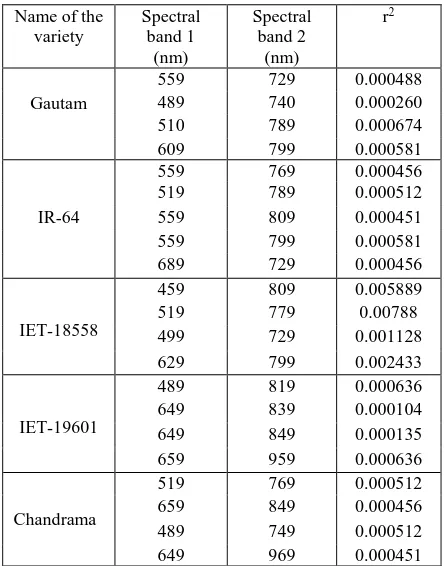
By employing band-band correlation significant wavebands were selected for the above discriminated varieties. For this analysis the wavelengths were reduced to 70 numbers of spectral wavelengths. The neighbourhood wavelengths gives similar information and thus averaged the reflectance of spectra over 10 nm (Jain et al., 2007; Thenkabail et al., 2004) which resulted in giving all total 70 bands ranging from 359-1049 nm. Here significant waveband combinations were selected by considering the hyperspectral measurements of above varieties and nitrogen applications. Finally we got 70 × 69 band-band combination for the study. From these combinations, the band combination having least correlation and hence indicating least redundancy of information are given in Table 3.
Name of the
Table 3. Waveband combinations with least correlation between their reflectance
The significant spectral wavebands were found in between Green, Red, NIR spectral range for discriminating the rice genotypes with N applications (Table.4). Our findings revealed that wavelengths in green region (519,559 nm) showed high reflectance in green region due to heavy chlorophyll absorption. The pre-maxima absorption band (650 nm) cited by Jain et al., 2007 and the red edge centred in the range of 700–720 nm reported by Daughtry et al., 2000, were found similar to the results (649,729 nm) obtained in our study. Our study showed, the reflectance characteristics at wavelengths (779,819 nm) has the potential to discriminate the rice species in an effective way. This significant wavelengths were observed sensitive to nitrogen. These wavelengths were found significant in discriminating the rice genotypes prior to nitrogen applications. These wavelengths were used for developing three or four band indices that will help to distinguish the rice varieties prior to nitrogen applications. The wavebands found in NIR region quite close to findings of Inoue et al., 2008.
Table 4. Significant waveband selected for discrimination of rice varieties prior to N application
4. CONCLUSION
The hyperspectral measurements were taken from eight rice species that were subjected to three nitrogen treatments. It was attempted to discriminate the rice genotypes along with their treatments and it was revealed that a few varieties were mixed
represented one cluster that cloud not be discriminated well and some of the varieties were significantly distinguished. Also by using clustering technique, noise in the hyperspectral data were eliminated resulting in accurate spectral signature. Thus a better spectral library for the rice genotypes prior to varying nitrogen applications and without varying nitrogen application were achieved. The significant wavelengths for this discrimination were found in green (519,559 nm), red (649 nm), red edge (729 nm) and NIR region (779,819 nm). The critical wavebands (779,819 nm) in the NIR spectral range is sensitive to nitrogen of the paddy crop. By considering these critical wavelengths three band or four band indices could be developed that will add more potential to distinguish the rice varieties from one another in an easy manner.
ACKNOWLEDGEMENTS
The work was carried out under the project supported from Department of Science and Technology, India. We are very grateful to all the member of DST associated to this project as well as the head of DST for their help and support to carry out this research.
REFERENCES
[1] Alemie, B. K., 2005. Spectral unmixing of hyperspectral and multispectral images for predictive mapping of surface soil organic matter. MSc. Thesis, pp.1-94.
[2] Carter, G. A., 1998. Reflectance bands and indices for remote estimation of photosynthesis and stomatal conductance in pine canopies. Remote Sensing of Environment, 63, pp.61-72.
[3] Daughtry, C. H. T., Walthall, C. L., Kim, M. S., de Colstoun, E. B., Mc-Murtrey, J. E., 2000. Estimating corn leaf chlorophyll concentration from leaf and canopy reflectance. Remote Sensing of Environment, 74, pp. 229-239.
[4] Han, J., Kamber, M., 2001. Data Mining: Concepts and Techniques. Morgan Kaufmann Publisher.
[5] Holecz, F., Barbieri, M., Collivignarelli, F., Gatt, L., 2013 An operational remote sensing based service for rice production estimation at national scale. Proceeding of ESA Living Planet Symposium, pp.1-11.
[6] Inoue, Y., Moran, M. S., Horie, T., 1998. Analysis of spectral measurements in paddy field for predicting rice growth and yield based on simple crop simulation model. Plant Production Science, 1, pp. 269-279.
[7] Inoue, Y., Peñuelas, J., Miyata, A., and Mano, M., 2008. Normalized difference spectral indices for estimating photosynthetic efficiency and capacity at a canopy scale derived from hyperspectral and CO2 flux measurements in rice. Remote Sensing of Environment, 112, pp. 156-172.
[8] Jain, N., Ray, S. S., Jain, N., Singh, J. P., Panigrahy, S., 2007. Use of hyperspectral data to assess the effects of different nitrogen applications on a potato crop. Precision Agric. 8, pp. 225-239.
[9] Janetos, A. C., Justice, C. O., 2000. Land cover and global productivity: A measurement strategy for the NASA Spectral range Wavelengths (nm)
Green 519,559
red 649
Red edge 729
programme. International Journal of Remote Sensing, 21, pp. 1491-1512.
[10]Jaynes, D. B., Colvin, T. S., Karlen, D. L., Cambardella, C. A., Meek, D. W., 2001. Nitrate loss in subsurface drainage as affected by nitrogen fertilizer rate. Journal of Environment Quality, 30, pp. 1305-1314.
[11]Jeffrey H. W., Chunhua Z., John M. K., 2014. Separating Crop Species in Northeastern Ontario Using Hyperspectral Data. Remote Sens., 6, pp. 925-945.
[12]Kumar, L., Schmidt, K. S., Dury, S., Skidmore, A. K., 2001. Review of hyperspectral remote sensing and vegetation science. In F. Van Der Meer (Ed.), Hyperspectral remote sensing. Dordrecht: Kluwer Academic Press.
[13]Liu, Z.Y., Huang, J.F., Wu, X.H., Dong, Y.P., 2007. Comparison of vegetation indices and red-edge parameters for estimating grassland cover from canopy reflectance data. J. Integr. Plant Biol, 49(3), pp. 299-306.
[14]Mahesh, S., Manickavasagan, A., Jayas, D.S., Paliwal, J., White, N.D.G., 2008. Feasibility of near-infrared hyperspectral imaging to differentiate Canadian wheat classes. Biosyst. Eng., 101, pp. 50-57.
[15]Newnham, G. J., Lazaridis, D., Sims, N. C., Robinson, A. P., Culvenor, D. S., 2012. Assessing the significance of hyperion spectral bands in forest classification. International Archives of the Photogrammetry, Remote Sensing and Spatial Information Sciences, vol (XXXIX-B7), pp. 147-149.
[16]Nidamanuri, R. R., Zbell, B., 2011. Use of field reflectance data for crop mapping using airborne hyperspectral image. ISPRS Journal of Photogrammetry and Remote Sensing 66, pp. 683-691.
[17]Oded Z., Maimon, Lior R., 2005. Data Mining and Knowledge Genre: Computer Science.
[18]Rao, N.R., 2008. Development of a crop-specific spectral library and discrimination of various agricultural crop varieties using hyperspectral imagery. Int. J. Remote Sens., 29, pp. 131-144.
[19]Tang, Y.L, Wang, R.C., Huang, J.F., 2004. Relations between red edge characteristics and agronomic parameters of crops. Pedosphere 14(4), pp. 467-474.
[20]Thenkabail, P.S., Enclona, E.A., Ashton, M.S., van Der Meer, B., 2004. Accuracy assessments of hyperspectral waveband performance for vegetation analysis applications. Remote Sens. Environ. 91, pp. 345-376.
[21]Wang, Y., Wang, F., Huang, J., Wang, X.; Liu, Z., 2009. Validation of artificial neural network techniques in the estimation of nitrogen concentration in rape using canopy hyperspectral reflectance data. Int. J. Remote Sens., 30, pp. 4493-4505.
[22]Wiegand C., Shibayama M., Yamagata Y., Akiyama T., 1989. Spectral observations for estimating the growth and yield of rice. Jpn. J. Crop Sci. 58, pp. 673-683.
[23]Xue, L., Cao, W., Luo, W., Dai, T., Zhu, Y., 2004. Monitoring leaf nitrogen status in rice with canopy spectral reflectance. Journal of Argon, American Society of Agronomy, 96, pp.135-142.
[24]Zhang, H., Hinze, L.L., Lan, Y., Westbrook, J.K., Hoffmann, W.C., 2012. Discriminating among cotton cultivars with varying leaf characteristics using hyperspectral radiometry. Trans. ASABE, 55, pp. 275-280.
[25]Zhang, H., Lan, Y., Suh, C.P., Westbrook, J.K., Lacey, R., Hoffmann, W.C., 2012. Differentiation of cotton from other crops at different growth stages using spectral properties and discriminant analysis. Trans. ASABE, 55, pp.1623-1630.