LANDSAT-BASED WOODY VEGETATION COVER MONITORING IN SOUTHERN
AFRICAN SAVANNAHS
E. Symeonakis*, K. Petroulaki, T. Higginbottom
School of Science and the Environment, Manchester Metropolitan University, Chester Street, Manchester, UK, M15 GD – (E.Symeonakis, T.Higginbottom)@mmu.ac.uk, [email protected]
Commission VII, WG VII/5
KEY WORDS: Land degradation, woody vegetation cover, bush encroachment monitoring, South Africa, Landsat, random forests
ABSTRACT:
Mapping woody cover over large areas can only be effectively achieved using remote sensing data and techniques. The longest continuously operating Earth-observation program, the Landsat series, is now freely-available as an atmospherically corrected, cloud masked surface reflectance product. The availability and length of the Landsat archive is thus an unparalleled Earth-observation resource, particularly for long-term change detection and monitoring. Here, we map and monitor woody vegetation cover in the Northwest Province of South Africa, an area of more than 100,000km2 covered by 11 Landsat scenes. We employ a multi-temporal approach with dry-season data from 7 epochs between 1990 to 2015. We use 0.5m-pixel colour aerial photography to collect >15,000 point samples for training and validating Random Forest classifications of (i) woody vegetation cover, (ii) other vegetation types (including grasses and agricultural land), and (iii) non-vegetated areas (i.e. urban areas and bare land). Overall accuracies for all years are around 80% and overall kappa between 0.45 and 0.66. Woody vegetation covers a quarter of the Province and is the most accurately mapped class (balanced accuracies between 0.74-0.84 for the 7 epochs). There is a steady increase in woody vegetation cover over the 25-year-long period of study in the expense of the other vegetation types. We identify potential woody vegetation encroachment ‘hot -spots’ where mitigation measures might be required and thus provide a management tool for the prioritisation of such measures in degraded and food-insecure areas.
1. INTRODUCTION
Drought, land degradation and desertification (DLDD) are serious global threats to humans and the environment. Globally, 10-20% of drylands and 24% of the world’s productive lands are potentially degraded, which affects 1.5 billion people and reduces GDP by €3.4 billion. In Africa, DLDD processes affect up to a third of savannahs, leading to a decline in the ecosystem services provided to some of the continent’s poorest and most vulnerable communities. Indirectly, DLDD can be monitored using relevant indicators. The encroachment of woody plants into grasslands, and the subsequent conversion of savannahs and open woodlands into shrublands, has attracted a lot of attention over the last decades and has been identified as an indicator of DLDD. According to some assessments, bush encroachment has rendered 1.1 million ha of South African savanna unusable, threatens another 27 million ha (~17% of the country), and has reduced the grazing capacity throughout the region by up to 50%.
The only viable method of mapping and monitoring woody vegetation cover over large areas is via the use of Earth Observation (EO) technologies. The Landsat programme, especially, offers an unparalleled achieve of free, radiometrically corrected, high-resolution data that date back to the early 1970s. A number of studies have employed optical Landsat data to map the extent of woody cover and/or to monitor its change through time (Symeonakis and Higginbottom, 2014; Yang and Prince, 2000). Although pixel-based Bayesian approaches (e.g. maximum likelihood) were the most commonly applied land cover classification techniques until recently, the majority of studies currently employ machine learning algorithms, such as random forests, support vector machines, etc. which have been shown to be more efficient (Rodriguez-Galiano and Chica-Rivas, 2015). In African environments, random forest classification and
* Corresponding author
multitemporal Landsat imagery have been successfully employed to map land cover in Zanzibar (Knudby, et al., 2014), Madagascar (Grinand, et al., 2013) and South Africa (Symeonakis and Higginbottom, 2014).
The aim of this study is, therefore, to employ random forests classification to map and monitor woody vegetation cover in the Northwest Province of South Africa over the last decades. Specific objectives include: (i) the mapping of woody cover, other vegetated areas and non-vegetated areas every 4-to-5 years over the last 25 years, and (ii) the identification of areas where woody cover is increasing over time. The latter would then allow potential bush encroachment to be identified in the field, mitigation measures to be prioritised and the effectiveness of existing control measures to be assessed.
2. MATERIALS AND METHODS 2.1 Study area
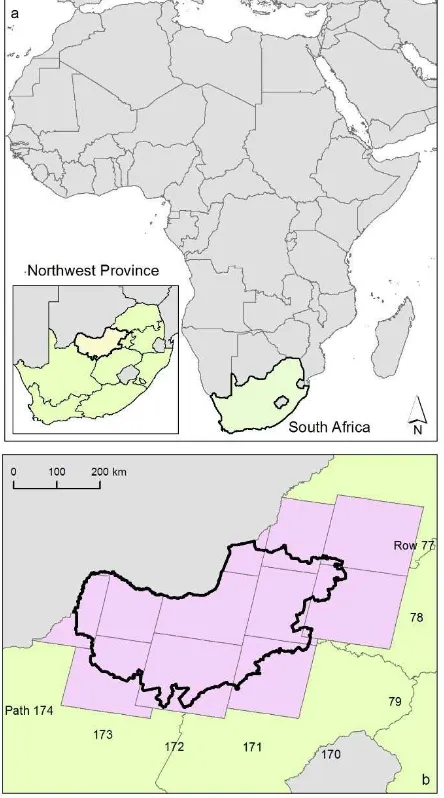
The study area is the Northwest Province (NWP) of South Africa. It covers an area of 104,882 km2. Temperatures range from 17° to 31 °C in the summer and from 3° to 21 °C in the winter. Annual rainfall is ~360 mm (~14 in), with nearly all of it falling during the summer wet months, between October and April (Wikipedia, 2016).
With the east-west variation in climate and rainfall, there is a corresponding gradation in the vegetation types. In the western part of the province, which are arid/semi-arid, Kalahari thornveld and shrub bushveld are more common. The central region is dominated by dry cymbopogon-themeda veld while the eastern region by a number of mixed bushveld types (Walmsley and Walmsley, 2002).
Bush thickening and encroachment is a serious problem in the Northwest Province. In a number of districts the land is no longer reclaimable by farmers. The most important bush encroachment and alien invader species are Acacia, Mesquite, Syringa and Eucalyptus (Walmsley and Walmsley, 2002).
Figure 1. (a) Location of the study area of the Northwest Province, South Africa. (b) The 11 Landsat scenes making up
the mosaic of the study area.
2.2 Datasets
Seven dry-season mosaics were created from the following epochs: 1990, 1994, 2002, 2007, 2011 and 2015. The Landsat imagery employed to create these mosaics are shown in Table 1. In a limited number of cases, where cloud free, good quality imagery without geometric errors were not available on the United Stated Geological Survey (USGS) Earthexplorer website (earthexplorer.usgs.gov), data from the previous dry season had to be used (e.g. in the case of the mosaic for the year 2007 and
Path/Row 174/78). Also, where ETM+ SLC-off data had to be used, the gaps were filled in using the Gapfill plug-in for ENVI 5.2 (Exelis, 2014; Gapfill is available online from https://docs.google.com/file/d/0B3e_wo8OTO47b3c4ZHNyV0 NmUkk/edit?pli=1– accessed 31/03/2016).
2.3 Sample collection
Sampling was carried out using 0.5m-pixel colour aerial photography available for free for the year 2008 onwards by the South African National Geospatial Information (NGI) mapping agency. More than 15,000 point samples of three land cover types were selected: woody vegetation cover (VC), other VC (including grasses and crops) and no VC (urban areas and bare areas). These samples were considered appropriate for the years 2007 and 2011. For the years before 2007 and for 2015, the samples were checked superimposed on the Landsat imagery. Where there was doubt regarding the cover type in the sample locations in these years, the samples were excluded from the classification process. This led to a reduction of the samples to almost half of those collected from the aerial imagery.
Path/Row Julian day & Sensor
174/78 234(TM), 245(TM), 192(TM), 227(TM), 182(TM, 2006), 188+236*(ETM+), 223(OLI)
173/78 243(TM), 238(TM), 185 (TM), 204(TM), 191(TM, 2006), 197+213*(ETM+), 216(OLI)
173/79 243(TM), 238(TM), 185(TM), 204(TM), 223 (TM, 2006), 197+213*(ETM+), 232(OLI)
172/77 204(TM), 263(TM), 178(TM), 197(TM), 200 (TM, 2006), 222*+238(ETM+), 225(OLI) 172/78 204 (TM), 263(TM), 178(TM), 197(TM), 184
(TM, 2006), 222*+238(ETM+), 225(OLI) 172/79 204 (TM), 263(TM), 178(TM), 197(TM),
187(TM), 222*+238(ETM+), 225(OLI) 171/77 261(TM), 272(TM), 187, 206, 228,
263+295*(ETM+), 234 (OLI)
171/78 261(TM), 272(TM), 187(TM), 206(TM), 228(TM), 247*+295(ETM+), 234(OLI) 171/79 261(TM), 272(TM), 187(TM), 206(TM),
228(TM), 247*+263(ETM+), 250(OLI) 170/77 206(TM), 265(TM), 196(TM), 215(TM),
173(TM), 224*+256(ETM+), 227(OLI) 170/78 206(TM), 265(TM), 196(TM), 215(TM),
221(TM), 224*+256(ETM+), 227(OLI) Table 1. Landsat data used in the study in ascending chronological order: 1990, 1994, 1998, 2002, 2007, 2011, 2015.
When ETM+ SLC-off data were used, an asterisk denotes the chosen date while no asterisk the dates used to fill the gaps with
the Gapfill plug-in of ENVI (Exelis, 2014).
2.4 Classification
Initially, random forest regressions were carried out using the open source R statistical language. Random forests have been shown to produce highly accurate models, whilst reducing the occurrence of overfitting (Symeonakis and Higginbottom., 2014; Higginbottom et al., subm.). For more details on Random Forest and its implementation in R, see Breiman (2001) and Liaw and Wiener (2002).
3. RESULTS & DISCUSSION
A sample of the accuracy statistics estimated by the random forest regressions for the seven time slots are summarised in Table 2.
Overall Statistics Balanced Accuracy Year Accuracy kappa Woody
VC
Other VC
No VC
1990 0.76 0.50 0.76 0.74 0.60
1994 0.74 0.45 0.74 0.72 0.56
1998 0.81 0.60 0.81 0.78 0.65
2002 0.83 0.66 0.84 0.82 0.67
2007 0.80 0.59 0.81 0.79 0.61
2011 0.82 0.63 0.82 0.81 0.69
2015 0.81 0.61 0.82 0.79 0.65
Table 2. Accuracy of random forest regressions
Overall accuracies around 80% were achieved which compare favourably with other similar classification attempts in drylands (Lucas et al., 2006). Overall kappa statistics varied from 0.45 for 1994 to 0.66 for 2002. According to the individual class statistics, for all seven dates, the class that was more accurately identified was the woody class, while the class which is more difficult to map is the no-vegetation class.
According to our results, woody vegetation covers a quarter of the area of the Northwest Province. It appears to be increasing slightly over the course of the 25 years of the study period (Figure 2). Other vegetation cover types, including grasses and crops, cover ~65% of the area and appear to be on the decrease while urban areas and bare land are expanding -together they cover ~10% of the Province.
Figure 2. Fluctuations of the area covered by each land cover class as a percentage of the total area of the Northwest Province
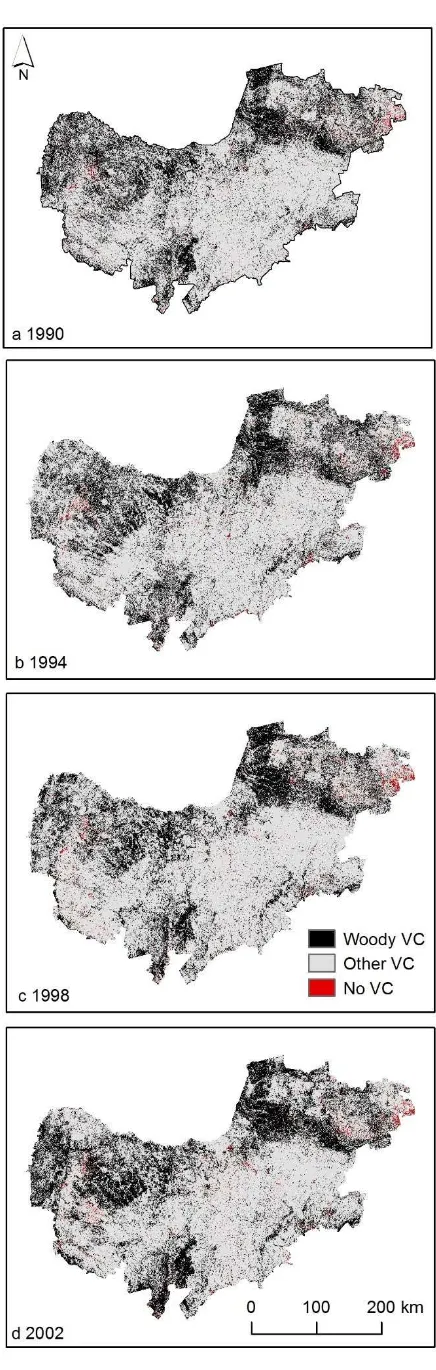
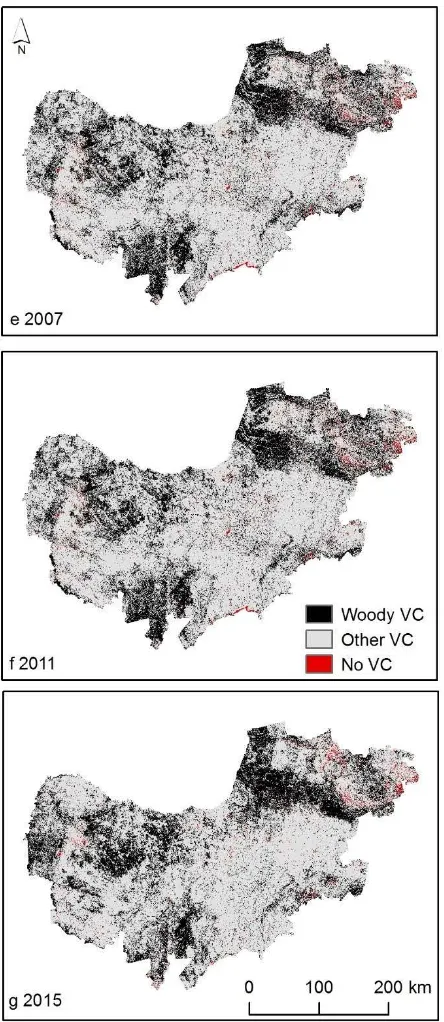
Figure 3 includes the land cover maps produced for the seven time steps of the 25-year-long study period. The extent of woody cover is mostly concentrated northwest of the city of Vryburg, around the towns of Zeerust, Ramatswa and Koster in the northeastern part of the Province and in some parts of the south around Kameelputs and southeast of Vryburg. Overall, the spatial extent of the land cover types in question are in agreement with the 1:250,000 land cover map developed by a consortium
between the Agricultural Research Council (ARC) and the
y = 0.0019x + 0.2454 R² = 0.093 y = -0.0069x + 0.6628
R² = 0.4824
y = 0.005x + 0.0917 R² = 0.6007
0.00 0.10 0.20 0.30 0.40 0.50 0.60 0.70
1990 1994 1998 2002 2007 2011 2015
Figure 3. Woody cover, other vegetation and no vegetation cover for the years 1990 to 2015.
Council for Scientific and Industrial Research (CSIR) for 1994, 2000, 2005 and 2013 using Landsat data (Fairbanks et al., 2000; Ngcofe and Thompson, 2015; Van der Berg et al., 2008). However, the mapped changes in the extent of woody cover cannot be directly linked with land degradation, as Eldridge et al. (2011) and Wessels et al. (2007) point out. The connection between the expansion of woody cover and the changes in climatic conditions needs to be investigated prior to drawing any conclusions regarding the state of land in the areas of increased woody cover. Moreover, the methodology presented here does not distinguish between certain types of bushes that are considered to be encroaching in the study area and are believed to be an indicator of accelerated land degradation and other
woody species, including trees, that are beneficial to the local communities.
Figure 4 shows the spatial distribution of the changes that have occurred between the three land cover types in the last 25 years. The areas in brown are those that, through the years, have changed from the other two types to woody and are currently, (i.e. in the year 2015), woody. The vast majority of these areas are concentrated around two parts of the Province: northeast of Vryburg and northeast of Mbabatho. A large number of areas, in different parts of the study area, have experienced a shift to other vegetation land cover types, including grasses and crops. Finally, the largest conversion to urban or other non-vegetated land cover has occurred in the eastern border of the Province with the province of Gauteng, due to the expansion of urban areas (e.g. Moumong, Ga-Kwate, etc.) and the opening of new quarry sites (e.g. south of Damonsville).
The identified changes are in agreement with other studies in the Northwest Province (Shoeman et al., 2010). The areas where woody cover is steadily increasing over the last 25 years should be prioritised for further in-situ verifications. These are potentially the areas where bush encroachment might be occurring and where mitigation actions should be considered. If the latter are already in place, such as aeroplane treatment, hand control and/or rotational grazing, their effectiveness should be investigated. Ideally, mitigation actions should accelerate and assist in the regeneration of open savannas with a balanced co‐ existence of grass and woody plants (Harmse et al., 2013).
Figure 4. Changes in the three land cover types (i.e. woody, other vegetation and no vegetation cover) that occurred in the
last 25 years in the Northwest Province.
4. CONCLUSIONS
the presented methodology to existing or future mitigation actions will also be investigated.
ACKNOWLEDGEMENTS
Elias Symeonakis is supported by an EU FP7 Marie Curie Career Integration Grant (PCIG12-GA-2012-3374327). Kyriaki Petroulaki is funded by a Manchester Metropolitan University (MMU) ESRC grant. Thomas Higginbottom is funded by an MMU Research Fellowship. We are grateful to the USGS and the South African National Geospatial Information (NGI) of the Department of Rural Development and Land Reform for the provision of the data.
REFERENCES
Eldridge, D.J., Bowker, M.A., Maestre, F.T., Roger, E., Reynolds, J.F., Whitford, W.G., 2011. Impacts of shrub encroachment on ecosystem structure and functioning: towards a global synthesis. Ecology Letters, 14, pp.709–722.
Exelis, 2014. ENVI 5.2 [Classic]. Exelis Visual Information Solutions.
Fairbanks, D.H.K., Thompson, M.W., Vink, D.E., Newby, T.S., Van den Berg, H.M and Everard, D.A., 2000, The South African Land-Cover Characteristics Database: A synopsis of the landscape. South African Journal of Science, 96(2), pp. 69-82.
Grinand, C., Rakotomalala, F., Gond, V., Vaudry, R., Bernoux, M., Vieilledent, G., 2013. Estimating deforestation in tropical humid and dry forests in Madagascar from 2000 to 2010 using multi-date Landsat satellite images and the random forests classifier. Remote Sensing of Environment, 139, pp. 68-80.
Harmse, C. J., Dreber, N., and Kellner, K., 2013. Bush encroachment and related mitigation actions in the Molopo savanna of South Africa: implications for grass composition, forage production and grazing capacity. AZEF Congress, 3-5 September 2013, Potschefstroom, South Africa. (Available online: Predictive modelling of fractional woody cover in semi-arid savannahs using multi-sensor and multi-seasonal data Remote Sensing of Environment.
Knudby, A., Nordlund, L.M., Palmqvist, G., Wikström, K., Koliji, A, Lindborg, R., Gullström, M., 2014. Using multiple Landsat scenes in an ensemble classifier reduces classification error in a stable nearshore environment. International Journal of Applied Earth Observation and Geoinformation, 28(1), pp. 90-101.
Lucas, R.M., Cronin, N., Moghaddam, M., Lee, A., Armston, J., Bunting, P., Witte, C., 2006. Integration of radar and Landsat-derived foliage projected cover for woody regrowth mapping, Queensland, Australia. Remote Sensing of Environment, 100(3), pp.388-406.
Ngcofe, L., Thompson, M., 2015. The status of land cover mapping in South Africa: 1994-2015. EE publishers (Available online: http://www.ee.co.za/article/status-land-cover-mapping-south-africa-1994-2015.html, accessed: 30/3/2016).
Richter, C.G.F., Snyman, H.A., Smit, G.N. 2001. The influence of tree density on the grass layer of three semiarid savanna types of southern Africa. African Journal of Range and Forage Science, 18: 103‐109.
Rodriguez-Galiano, V.F., Chica-rivas, 2015. Document Evaluation of different machine learning methods for land cover mapping of a Mediterranean area using multi-seasonal Landsat images and Digital Terrain Models. International Journal of Digital Earth, DOI: 10.1080/17538947.2012.748848
Schoeman, F. Newby, T.S., Thompson, M.W., Van den Berg, E.C., 2010. South African National Land Cover Change Map, Unpublished Report No GW/A/2010/47, ARC-ISCW, Pretoria
Symeonakis, E., Higginbottom, T. P. 2014. Bush encroachment monitoring using multi-temporal Landsat data and random forests. Int. Arch. Photogramm. Remote Sens. Spatial Inf. Sci., XL-2, 29-35. doi:10.5194/isprsarchives-XL-2-29-2014.
Van den Berg, EC., Plarre, C., Van den Berg, HM & Thompson, MW 2008, The South African National Land-Cover 2000. Agricultural Research Council-Institute for Soil, Climate and Water, Unpublished Report No. GW/A/2008/86.
Walmsley, D. and Walmsley, J., 2002. North West Province State of the Environment Report – Overview 2002. Available online encroachment in African savannas? African Journal of Range & Forage Science, 22 (2): 101‐105.
Wessels, K.J., Prince, S.D., Malherbe, J., Small, J., Frost, P.E., VanZyl, D., 2007. Can human-induced land degradation be distinguished from the effects of rainfall variability? A case study in South Africa. Journal of Arid Environments, 68(2), pp.271-297.
Wikipedia, 2016. (Available at:
https://en.wikipedia.org/wiki/North_West_%28South_African_ province%29, accessed: 31/03/2016)