ASSESSMENT OF FLOODED AREAS PROJECTIONS AND FLOODS POTENTIAL
IMPACTS APPLYING REMOTE SENSING IMAGERY AND DEMOGRAPHIC DATA
D. A. Rodriguez a*, F. Carriello b, P. J. F. Fernandes b, L. Garofolo Lopes a, J. L. Siqueira Júnior a a
Earth System Science Center, National Institute for Space Research, 12630-000 Cachoeira Paulista, São Paulo, Brazil - (daniel.andres, lucas.garofolo, jose.lazaro)@inpe.br
b
Geosciences Institute, Universidade Federal Fluminense, Av. Litorânea s/n, 24030-346, Niterói, Rio de Janeiro, Brazil – ( [email protected], [email protected])
Commission VIII, WG VIII/1
KEY WORDS: Floods, Climate Change Impacts, Climate Change Vulnerability
ABSTRACT:
Assessing vulnerability and potential impacts associated with extreme discharges requires an accurate topographic description in order to estimate the extension of flooded areas. However, in most populated regions, topographic data obtained by in-situ measurements is not available. In this case, digital elevation models derived from remote sensing date are usually applied. Moreover, this digital elevation models have intrinsic errors that introduce bigger uncertainty in results than the associated to hydrological projections. On the other hand, estimations of flooded areas through remote sensing images provide accurate information, which could be used for the construction of river level-flooded area relationships regarding vulnerability assessment. In this work, this approach is applied for the city of Porto Velho in the Brazilian Amazonia to assess potential vulnerability to floods associated with climate change projections. The approach is validated using census data, provided by the Brazilian Institute of Geography and Statistics, and information about socio-economical injuries associated to historical floods, provided by the Brazilian Civil Defence. Hydrological projections under climate change are carried out using several downscaling of climate projections as inputs in a hydrological model. Results show more accurate estimation of flood impacts than the obtained using digital elevation models derivate from remote sensing data. This reduces uncertainties in the assessment of vulnerability to floods associated with climate change in the region.
* Corresponding author
1. TRODUCTION
With a mean discharge of 31704 m3 s-1 and a drainage area of 1420000 km2, the Madeira River is one of the most important tributary of the Amazon River. The Madeira River born in the Bolivian and Peruvian Andes and flows in the SW-NE direction across Brazil, where it met the Amazon. During the last years, several extreme events, with 100 years of time recurrence, impacted the basin: 2005 and 2010 droughts (Tomasella et al. 2010), and floods in 2009, 2012 (Marengo et al. 2013), besides the major historical flood in 2014 (Ovando et al 2015).
The city of Porto Velho, capital of Rondônia State, located in the Madeira main-stem is frequently affected by floods. These events completely disrupt the livelihood of local population. Mitigation actions during extreme events include economic assistant and moving affected families to flood shelters. Climate projection indicates that such extreme events might become more frequent in the future. In this context, mitigation and adaptation become crucial for reducing the risk of disasters associated to climate-change.
Assessing vulnerability and potential impacts associated with extreme discharges requires an accurate topographic description in order to estimate the extension of flooded areas. However, in most populated regions, topographic data obtained by in-situ measurements is not available. In this case, digital elevation models derived from remote sensing date are usually applied. Moreover, this digital elevation models have intrinsic errors that introduce bigger uncertainty in results than the associated to hydrological projections. On the other hand, estimations of
flooded areas through remote sensing images provide accurate information, which could be used for the construction of river level-flooded area relationships regarding vulnerability assessment.
2. DATA AND METHODS
2.1 Remote Sensing Imagery
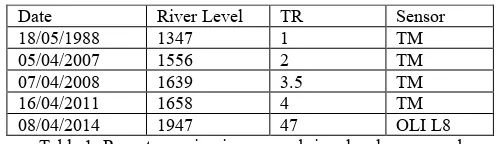
Landsat imagery (TM and ETM sensors) available from the Brazilian National Institute for Space Research repository were used to assess the extension of flooded area for some critical events. Table 1 describes the images used, the river level measured at the time and the recurrence time (TR) for this flood.
Images were geo-referenced and classified by visual interpretation using bands 543 (TM) and 654 (OLI L8) RGB. Flooded areas were estimated based on this classification.
Date River Level TR Sensor
18/05/1988 1347 1 TM
05/04/2007 1556 2 TM
07/04/2008 1639 3.5 TM
16/04/2011 1658 4 TM
08/04/2014 1947 47 OLI L8
Table 1: Remote sensing images and river levels measured
2.2 Digital Elevation Model
The International Archives of the Photogrammetry, Remote Sensing and Spatial Information Sciences, Volume XLI-B8, 2016 XXIII ISPRS Congress, 12–19 July 2016, Prague, Czech Republic
This contribution has been peer-reviewed.
Digital Elevation Model was obtained from the Shuttle Radar Topography Mission, SRTM (Farr et al. 2007), available at 90 meters resolution. The Paz and Collischonn (2007) approach was applied to eliminate sinks form the SRTM data and to obtain the local drain direction network.
2.3 Hydrologic projections
Hydrological projections were obtained with the MHD-INPE hydrological model (Rodriguez and Tomasella 2015) applied to the Madeira Basin (Siqueira Junior et al. 2015). Climate projections, from 5 global models; MIROC (WATANABE, 2010), CSIRO-MK 3.6.0 (COLLIER et al.,2011), IPSL-CM5B (DUFRESNE 2011) e HadGEM2 (COLLINS et al., 2011) were used as inputs for the hydrological model. The chosen global climate models are part of the Coupled Model Intercomparison Project Phase 5 (CMIP5) (Taylor et al., 2012). All climate projections were bias corrected thorough the quantil-quanitl methodology of Bárdossy e Pegram (2011).
.
2.4 Census and Disasters data
Data about population were obtained from the last demographic census carried out by the Brazilian Institute of Geography and Statistics (IBGE). Information become form the XII Demographic Census carried out during 2010. Demographic data is presented in 200 x 200 meters grade, over urban areas, and 1 x 1 kilometre, over rural areas (IBGE 2016). For this work were considered only the urban areas of Porto Velho Municipality.
Information about the impacts of the last extreme flood in Porto Velho, on March 2014, were collected from the Integrated System of Disasters Information of the Brazilian Civil Defence (Ministry of Integration 2016).
3. RESULTS AND DISCUSSION
The hydrological model MHD-INPE (Rodriguez and Tomasella 2015) was calibrated for the historical period 1970-1990 using observed hidrometorological data (Siqueira Junior et al. 2015). Model simulation has a good performance in represent the historical series of daily discharges in Porto Velho gauge station, reaching a Nash-Sutcliff performance coefficient of 0.83.
Figure 1: Maximum river levels estimated for different return times using measured gauge station data and hydrological
simulation based on several climate models data for the historical period (1970-1990).
Both simulated and observed annual maxima discharges series were analysed using the General Extreme Values approach. The experiments using several atmospheric model data as input for
the hydrological model show a large variability between their results (Figure 1). Experiments using MIROC and HADGEM2 data fit better to the observed extreme values for the different recurrence times. Meteorological data from CSIRO and IPSL result in the overestimation of extreme discharges in the simulations of the historical period. Dispersion between experiments is enhanced in the future projections of river levels under climate change effects (Figure 2).
Figure 2: Dispersion of the maximum river levels estimated for different return times using hydrological simulation based on
several climate models projections (2011-2100).
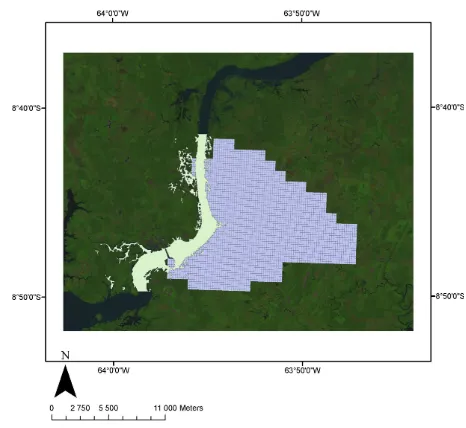
The amount of potential affected people for different river levels were obtained by crossing the Digital Elevation Model (DEM), obtained from SRTM data, with the census information from IBGE (Figure 3). The wide dispersion between experiments showed by river levels projections is also transferred to the number of affected people estimation (Figure 4).
Figure 3: Flooded area classification from Landsat image of 08/04/2014 overlapping census gridded data from IBGE
Information about number of affected people was also obtained using estimation of flooded area obtained from remote sensing imagery (Figure 4). Return Time associated to the river levels at the days when images were obtained, were estimated based in the historical series at the gauge station and are comparable with the return times estimated for the historical period based in SRTM data. When compared with estimations obtained using The International Archives of the Photogrammetry, Remote Sensing and Spatial Information Sciences, Volume XLI-B8, 2016
XXIII ISPRS Congress, 12–19 July 2016, Prague, Czech Republic
This contribution has been peer-reviewed.
SRTM data, there is an evident underestimation of the number of people affected obtained using the former approach (Figure 3), mainly associated with differences in the estimation of the flooded area due to bias in the topography derived form SRTM.
Figure 4: Estimated number of affected population based on SRTM data, for historical extreme values (black line) and future
projections (red line), and remote sensing imagery (blue dots). Return times for SRTM historical extreme values and remote sensing imagery are calculates based on the historical river level
series.
When both result are compared with the available information from the Brazilian Civil Defence about the impacts described during the last extreme flood in the region, on March of 2014, it is noted that remote sensing imagery based approach result is closer to related damages than the values obtained from SRTM.
Differences between the numbers of affected people estimated based in SRTM and in remote sensing imagery show that uncertainty in the assessment of impacts of extreme floods associated to topography estimations is as large as the one due to inter-model variability. Errors in topography elevation of Aster’s DEM has been reported to be around 26 meters (Oliveira et al, 2009), which is large enough to introduce large uncertainty in flooded area estimations and, then, in the estimated number of affected people. In addition to the uncertainties of climate change scenarios generated from different model, it is clear that the absence of an accurate digital elevation model could introduce similar or bigger uncertainty than climate scenarios in the results.
ACKNOWLEDGEMENTS
This research has been partially founded by the National Council of Technological and Scientific Development (CNPq - Brazil), Process number 442890/2014-1 and EU- Amazalert Grant agreement no:282664.
REFERENCES
Bárdossy, A., and G. Pegram, 2011: Downscaling precipitation using regional climate models and circulation patterns toward hydrology. Water Resources Research, 47, 1-18.
Collier et al., 2011:The CSIRO Mk 3-6-0 Atmosphere-Ocean GCM: participation in CMIP5 and data publication, 19th International Congress on Modelling and Simulation,2011.
Collins et al., W.j., 2011: Development and evaluation of an Earth-System model – HadGEM2.Met Office Hadley Centre, Exeter, UK, 2011.
Dufresne, J. L. et a, 2013.Climate change projections using the IPSL-CM5 Earth System Model: from CMIP3 to CMIP5. Spingerlink, p.2125, 2013.
Farr, T.G., Rosen, P.A., Caro, E., et al., 2007. The shuttle radar topography mission. Reviews of Geophysics. doi:1029/2005RG000183
IBGE 2016 : Censo 2010: Grade Estatísitca 2010 (In Portuguese).
http://mapasinterativos.ibge.gov.br/grade/default.html. (30 March 2016).
Marengo, J. A., L. M. Alves, W. R. Soares, D. A. Rodriguez, H. Camargo, M. P. Riveros, and A. D. Pabló, 2013: Two Contrasting Severe Seasonal Extremes in Tropical South America in 2012: Flood in Amazonia and Drought in Northeast Brazil. J. Clim., 26, 9137-9154.
Ministry of Integration 2016: Sistema integrado de informações sobre desastres – S2ID (In Portuguese).
http://www.mi.gov.br/defesa-civil/s2id. ( 10 October 2015).
Oliveira, C. G., and W. R. Paradella. 2009. “Evaluating the Quality of the Digital Elevation Models Produced from ASTER Stereoscopy for Topographic Mapping in the Brazilian Amazon Region.” Annals of the Brazilian Academy of Sciences 81: 217– 25
Ovando, A., Tomasella, J., Rodriguez, D. A., Martinez, J. M., Siqueira-Junior, J. L., Pinto, G. L. N., ... & von Randow, C. (2015). Extreme flood events in the Bolivian Amazon wetlands.
Journal of Hydrology: Regional Studies.
Paz, A.R. da, Collischonn, W., 2007. River reach length and slope estimates for large-scale hydrological models based on a relatively high-resolution digital elevation model. J. Hydrol. doi:10.1016/j.jhydrol.2007.06.006
Rodriguez, D. A; Tomasella, J. 2015: On the ability of large-scale hydrological models to simulate land use and land cover change impacts in Amazonian basins. Hydrological Sciences Journal 2015
Siqueira-Júnior, J. L. S., Tomasella, J., and Rodriguez, D. A. 2015: Impacts of future climatic and land cover changes on the hydrological regime of the Madeira River basin, Climatic Change, 129, 117- 129, doi: 10.1007/s10584-015-1338-x.
Taylor, K.E., Stouffer, R.J., Meehl, G.A., 2012. An overview of CMIP5 and the experimental design. B. Am. Meteorol.Soc. 93, 485-498.
Tomasella, J., Borma, L. S., Marengo, J. A., Rodriguez, D. A., Cuartas, L. A., A. Nobre, C., and Prado, M. C. R. 2010: The droughts of 1996–1997 and 2004–2005 in Amazonia: hydrological response in the river main-stem, Hydrological Processes, 25, 1228-1242, doi: 10.1002/hyp.7889.
Watanabe, M., et al., 2010. Improved Climate Simulation by MIROC5: Mean States, Variability, and Climate Sensitivity. J. Climate. doi:10.1175/2010JCLI3679.1
The International Archives of the Photogrammetry, Remote Sensing and Spatial Information Sciences, Volume XLI-B8, 2016 XXIII ISPRS Congress, 12–19 July 2016, Prague, Czech Republic
This contribution has been peer-reviewed.