BRIDGE CRACK DETECTION USING MULTI-ROTARY UAV AND OBJECT-BASE
IMAGE ANALYSIS
J. Y. Rau a, *, K. W. Hsiaoa, J. P. Jhana, S. H. Wanga, W. C. Fanga, J. L. Wang b aDepartment of Geomatics, National Cheng Kung University, 701 Tainan, Taiwan –
[email protected]; [email protected]; [email protected]; [email protected]; [email protected]
ᵇ China Engineering Consultants, 106 Taipei, Taiwan - [email protected]
Commission VI, WG VI/4
KEY WORDS: Bridge inspection, Crack Detection, OBIA, UAV
ABSTRACT:
Bridge is an important infrastructure for human life. Thus, the bridge safety monitoring and maintaining is an important issue to the government. Conventionally, bridge inspection were conducted by human in-situ visual examination. This procedure sometimes require under bridge inspection vehicle or climbing under the bridge personally. Thus, its cost and risk is high as well as labor intensive and time consuming. Particularly, its documentation procedure is subjective without 3D spatial information. In order cope with these challenges, this paper propose the use of a multi-rotary UAV that equipped with a SONY A7r2 high resolution digital camera, 50 mm fixed focus length lens, 135 degrees up-down rotating gimbal. The target bridge contains three spans with a total of 60 meters long, 20 meters width and 8 meters height above the water level. In the end, we took about 10,000 images, but some of them were acquired by hand held method taken on the ground using a pole with 2-8 meters long. Those images were processed by Agisoft PhotoscanPro to obtain exterior and interior orientation parameters. A local coordinate system was defined by using 12 ground control points measured by a total station. After triangulation and camera self-calibration, the RMS of control points is less than 3 cm. A 3D CAD model that describe the bridge surface geometry was manually measured by PhotoscanPro. They were composed of planar polygons and will be used for searching related UAV images. Additionally, a photorealistic 3D model can be produced for 3D visualization. In order to detect cracks on the bridge surface, we utilize object-based image analysis (OBIA) technique to segment the image into objects. Later, we derive several object features, such as density, area/bounding box ratio, length/width ratio, length, etc. Then, we can setup a classification rule set to distinguish cracks. Further, we apply semi-global-matching (SGM) to obtain 3D crack information and based on image scale we can calculate the width of a crack object. For spalling volume calculation, we also apply SGM to obtain dense surface geometry. Assuming the background is a planar surface, we can fit a planar function and convert the surface geometry into a DSM. Thus, for spalling area its height will be lower than the plane and its value will be negative. We can thus apply several image processing technique to segment the spalling area and calculate the spalling volume as well. For bridge inspection and UAV image management within a laboratory, we develop a graphic user interface. The major functions include crack auto-detection using OBIA, crack editing, i.e. delete and add cracks, crack attributing, 3D crack visualization, spalling area/volume calculation, bridge defects documentation, etc.
1. INTRODUCTION
Bridge is an important traffic infrastructure owing to the geographical properties that many rivers are cross the land. Since Taiwan is located at the boundary of Philippine Sea plate and Eurasian plate, thus dramatic earthquakes induced by the movement of Philippine Sea plate toward to the Eurasian plate have happened every year. Meanwhile, Taiwan is located at the west side of the Pacific Ocean, thus the Typhoon will bring heavy rainfall and strong wind that will cause damage to the bridge. Sometimes the induced water may cause flooding or break the bridge. It will cause huge property loss and inconvenience to the public transportation and communication. Since the mountainous area has occupied 2/3 of the whole Taiwan Island, there are more than 20,000 bridges in Taiwan. Therefore, the bridge safety monitoring is very important to the government.
For the purpose of monitoring bridge safety, the crack and concrete spalling are important indicators reflecting the safety status of infrastructures. The conventional way to inspect the crack and concrete spalling has some drawbacks. In Figure 1, the inspector is suspended or takes the engineering vehicles under the bridge to inspect the deficiency, which is dangerous and time-consuming. In the meantime, the judgement and measurement of
crack are subjective due to the human visual inspection is adopted and not three-dimensional information were recorded for future comparisons and change analysis.
Several literatures used image processing technique for crack detection. For example, Talab et al.(2016) utilized Otsu algorithm (Otsu, 1979) for the determination of threshold for crack detection, but due to noise it is suggest to apply Sobel filter to remove noise effect in advance. Zhang et al.(2014) perform noise removal as well, but conduct machine learning for crack detection. The authors have evaluate several techniques, such as Extreme Learning Machine (ELM), radial basis function neural network (RBF), Support Vector Machine (SVM), and K Nearest Neighbours algorithm (KNN). However, in the end, they have learned that too many sensitive parameters are needed and a fully automatic approach is not available. Gavilán et al.(2011) adopted two line scanner to acquire road pavement image and suggest linear SVM for the recognition of crack. Abdel-Qader et al.(2003) utilize Fast Haar Transform (FHT), Fast Fourier Transform, Sobel, and Canny for crack detection. The compare these four method on fifty dataset. Finally, they conclude that FHT method is the best and its overall accuracy is 86%.
In this research, we propose to use a multi-rotary UAV and hand held pole to take images of bridge surface. The image preprocessing is done to enhance the contrast and decrease the effect of external factors. Then the crack can be detected through the objected-based image analysis (OBIA) (Blaschke, 2010; Lang et al., 2011) method. Further, we utilize semi-global-matching (SGM) (Hirschmuller, 2008) to obtain 3D crack information. In the other part of concrete spalling, some of photogrammetry techniques are used to calculate the spatial information such as the length, width, area and volume.
Figure 1. The traditional method for bridge inspection
©CHINA ENGINEERING CONSULTANTS, INC
1.1 Equipment
1.1.1 Camera
The adopted consumer grade digital camera is SONY α7R2 with 50 mm fixed focal length, figure 2. The image resolution is 7952×5304 with 4.5 μm pixel size. The weight is only 582 gram so it is possible to be carried by a multi-rotary UAV.
Figure 2. The exterior of SONY A7RII
1.1.2 UAV
The UAV was assembled by ourselves. It is in Y shape with 6 propellers as shown in figure 3. The gimbal, which can rotate 135 degrees from up to 45 degrees down, is equipped in the front of UAV. Surround the camera lens are several LED bulbs in order to increase illumination. It is suitable for inspecting the bridge bottom because the gimbal can make the camera to take images vertically upwards when the UAV is under the bridge. However, in such condition there is no GNSS signal available, so the control of UAV manoeuvre is all dependent on the operator.
Figure 3. The appearance of the used UAV
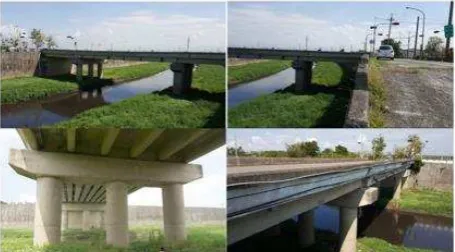
1.2 Study site
The study site is Chia-nan Bridge #2, figure 4. The length and width of this bridge is 50 meters and 10 meters, respectively. The height is about 8 meters above water. The middle part of the riverbed is water body, while the other two sides are lands where
are covered with weeds. There are some cracks on the surface of two abutments and bottom of beams.
Figure 4. The outward appearance of Chia-Nan Bridge#2
2. METHDOLOGY
In this research, the crack and concrete spalling are two main targets for inspection, thus in the following sections we describe their detail workflow individually.
2.1 Crack
Figure 5 is the proposed workflow for crack detection using UAV imagery. Detail procedure will be discussed in the following.
Figure 5. The workflow of automatic crack detection
2.1.1 Image acquisition
During image acquisition, a continuous drive mode is made to obtain high overlap ratio and the operator try to maintain the UAV with a distance of 2 meters to the bridge surface. It is estimate that the images will have a spatial resolution around 0.2 mm.However, due to manual controlling without GNSS signal, the UAV is not easy to keep stable and the acquired image spatial resolution may varied from 0.2-0.5 mm. After acquiring the images, the Agisoft PhotoscanPro software is used for aerial triangulation to obtain the exterior orientation parameter of each images and to perform camera self-calibration.
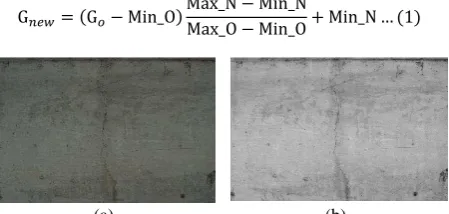
2.1.2 Linear stretch
Sometimes, the acquired images are dark owing to the shortage of shine when taking images under the bridge. The linear stretch can increase the range of grey level that will enhance the contrast. The formula (1) can transform the original grey level [Min_O, Max_O] to new range [Min_N, Max_N]. G �� is the new grey level and G is the original grey level. The value of Min_N will be 0 and Max_N will be 255 in general. In Figure 6 (a), the whole image is dark. However, contrast of result after linear stretch is enhanced that the crack is dark but the background is brighter.
G ��= G − Min_O Max_N − Min_NMax_O − Min_O + Min_N … 1
(a) (b)
Figure 6 (a) original image (b) after linear stretch
2.1.3 Background subtraction
The result of crack detection may be interfered by uneven illumination, shadow and the dirt on the bridge surface. The rolling ball background subtraction algorithm (Sternberg, 1983) is suggested to decrease this effect. The theory of this algorithm is that the image grey level is treated as elevation profile. A ball with a pre-defined radius will roll over all the image pixels and those pixels that the ball have touched will be used to interpolate as a background grey level image. The result that is not affected by uneven illumination can be derived by using the grey level of the original image to subtract the background image.As shown in Figure 5 (a), the original image is affected by uneven illumination so the detection of dark dot is difficulty by using a global threshold. Nevertheless, after performing background subtraction, as shown inFigure 5(b), the determination of above-mentioned threshold becomes easier.
(a) (b)
Figure 5(a) original image (b) after background subtract (Sternberg, 1983)
2.1.4 Local contrast enhancement
For the purpose to enhance the contrast between background and cracks, the local contrast enhancement is used. First, a window is moving the whole image and calculate the mean grey level of each window. The difference of each window can be derived by the original grey level minus the mean. The difference is negative at crack part and positive at background. Then the processed image is the original grey level plus the difference so the grey level of crack will become smaller and the grey level of background will become higher. This processing method can improve the accuracy of crack detection by increasing the contrast of crack and background. Figure 7shows that a black
graph is the original grey level profile and a green curve is the result after performing local contrast enhancement. The contrast between crack and background has increased.
Figure 7 The effect of local contrast enhancement (black
is the original and green is the contrast enhanced result)
2.1.5 Object-based image analysis (OBIA)
The feature of OBIA (Blaschke, 2010; Lang et al., 2011) is that the image will be segmented into different image objects. Then, we can calculate different object features, such as length, area, mean grey level, etc., and all image objects will be classified into different classes through the rules developed in this study.
(1)Multiresolution segmentation
Multi-resolution image segmentation (Baatz, 2000), which is a hierarchically bottom-up method, is the fundamental process in OBIA. It starts from one pixel to merge another similar pixels to become an object until a predefined criteria has achieved, such as the scale and heterogeneity.
(2) Object feature
Each image object has its own object features. We can set a rule set to classify the image objects according to the calculated object features. The object feature of crack is that the grey level is low and its shape is zigzag line not straight. The used object features are explained in the following paragraphs.
Brightness
Brightness is the mean grey level of an object. The mean grey level of crack is apparently lower than its background. Therefore, the first step is to utilize the brightness try to exclude the background objects.
Density
Density describes the shape of an object. If the shape of an object is close to a straight line, the density will become lower. In the previous steps, the objects with lower grey level is retained but there are many non-crack objects such as weeds, drainage hole, stains, and so on. The density can exclude these objects, which are not in linear and straight shape.
Area/Bounding box area
The ratio between area and bounding box area is another object feature that can distinguish the straight lines from zigzag lines. Area is the sum of pixels in an objects and the bounding box area is the sum of all pixels in the bounding box. In Figure 7,the red box is the bounding box and the blue one is the objects. If the object is straight-like, the area of bounding box will be close to the object area. Therefore, if the object is a zigzag line, the feature of area/”bounding box area” is often lower than 0.5. The difference between crack and non-crack (water pipes, line objects) is that the crack is irregular. Then, the objects that are too straight will be considered as non-crack objects.
(a) (b)
Figure 7. The comparison between a straight line and a zigzag line.
Length/width
The ratio between bounding box length and bounding box width can assist the feature of Area/Bounding box area to distinguish the straight line and zigzag line. The value of length/width in straight line will be larger than the zigzag.
Length
After previous-mentioned processes, the object that are similar to crack will be kept and the other irrelevant objects will be removed. However, there are still some small objects whose shape is similar to crack. The threshold of length is used to exclude these objects.
2.1.6 Forward intersection of stereo pair images
With the interior and exterior orientation of images, the images can be transformed to epipolar images to perform dense matching. We can use SGM (Hirschmuller, 2008) to find the conjugate point in the stereo-pair and conduct space forward intersection to get three-dimensional coordinate of each pixels which is detected as crack.
Figure 8. Forward intersection of stereo pair images
2.2 Concrete spalling
Figure 9 is the proposed workflow for the spatial information calculation of concrete spalling using UAV imagery. Detail will be discussed in the following paragraphs.
Manual selection
Figure 9. The workflow of concrete spalling volume
calculation
2.2.1 Manual selection and Back projection
The users need to identify the approximately location of concrete spalling in one image. We can back project to find other images that contain the same location of concrete spalling. Therefore, the stereo-pair will be processed in the following steps.
2.2.2 Epipolar image generation
In order to improve the efficiency of searching conjugate point, the original raw images will be transformed into epipolar images then no Y parallax will exist and the searching of conjugate point can be conduct on one dimension. We only want the spatial information of concrete spalling so the external part of this area will be avoided.
2.2.3 Dense matching
The SGM is used to search for the conjugate point. The advantage of this method is that its computation efficiency is better than the global matching and still can maintain the matching accuracy (Hirschmuller, 2008). In this research, we adopt StereoSGBM function from OpenCV for this purpose.
2.2.4 Forward intersection
With the known exterior and interior orientation of images, the conjugate point that derived from dense matching will intersect forwardly to obtain the three-dimensional coordinate.
2.2.5 Plane fitting
The concrete spalling is often in the middle of the box so we assume that the boundary of box is a plane. Therefore, the point cloud which near the boundary of box will be used for plane fitting.
2.2.6 Elevation calculation
After obtaining the fitted plane function, the elevation can be calculated via the dense point cloud and the plane. The elevation is defined as the distance of point cloud to the plane.
2.2.7 DSM generation
Owing to the sufficient density of dense point cloud, we use the nearest neighbour interpolation to obtain a regular grid elevation model, which is similar to Digital Surface Model (DSM) which treat the above mentioned plane as datum.
2.2.8 Image processing
If the elevation is lower than zero, we treat them as delaminated area and using zero value to perform thresholding to get a binary image. Thus, the location of spalling is black, but lots of them are noise. In order to obtain the main delaminated area, the largest black region is preserved by region growing. In the end, we apply morphology filter to remove salt-and-pepper noise.
2.2.9 Spatial information calculation
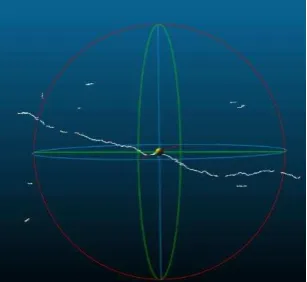
In the previous steps, the main concrete spalling region has been detected. The volume, depth, 3D polygon and area can be calculated through the main concrete spalling location and elevation model. However, in order to calculate it largest length and smallest width, we need to determine its main direction first. Assuming that there is a line passing through the centre point of the spalling area, each pixels in this area will be projected to this line. This line will rotate to find the main direction, where the length of projected line is the longest one. Figure 10 is a schematic diagram that illustrates several rotation axes and find out the solid line is the main axis of this region.
Figure 10 Schematic diagram to find the main direction
of a spalling region.
After finding the main direction of a spalling region, we can perform coordinate transformation to transfer the original one to the main direction and calculate its length and width.
3. CASE STUDY AND ANALYSIS
3.1.1 Crack detection case 1
In the case study, we demonstrate the results of each pre-processing steps and analyse crack detection result. The image used in this case was acquired by Sony A6000 with a lens of 20mm focal length. The image pre-processing will be applied to each images for decreasing the effect of external interference and enhancing the contrast. Figure 11 is the image which takes on the bridge abutment that a crack pass through it almost horizontally. The image is complexity due to many non-crack objects, such as cable, stain, pipeline, on the surface of bridge abutment. The original image appear dark due to the lack of light. The process of linear stretch can enhance the global contrast.
Figure 11. Crack image case 1
But the upper right corner is darker than other area because the overhead bridge blocks the light. This kind of uneven illumination can apparently decrease by the steps of rolling ball background subtraction method as shown in Figure 12.
Figure 12. The result after background subtract
After the process of background subtraction, some small and unclear cracks are not easy to detect. For the purpose to enhance these cracks, the local contrast enhancement is applied. The final step is to develop a rule set for crack detection using OBIA technique. As shown in the workflow, the pre-processed image will be segmented into different image objects. Then, we utilize several object features and a classification rule set to classify the image objects into crack and non-crack objects. In Figure 13, most of the cracks are detected but some parts are broken owing to the interference of stains. Compare with the original image, most of the misclassified objects are introduce by stains that have geometric shape similar to the crack. The producer accuracy is 92.6%, which is high but the user accuracy is only 77.7% because some objects similar to crack are misjudged as crack class.
Figure 13. The result of crack detection
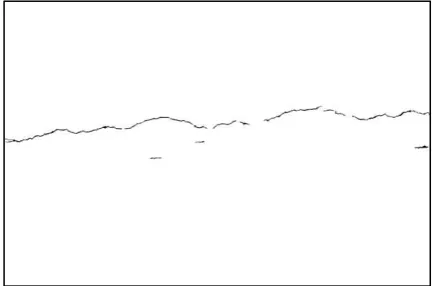
After crack detection, we transform the crack from two-dimensional image plane to three-two-dimensional object space by space intersection. In Figure 14, the white line is the location of three-dimensional crack. By comparing the three-dimensional crack in different periods, we can perform change analysis of this crack.
Figure 14. The three-dimensional crack
3.1.2 Crack detection case 2
In order to know the feasibility and reliability of the proposed workflow, we use another image to do the test. The image shown in Figure 15 was acquired by Sony A7R2 with a lens of 50 mm focal length. A black crack is shown in the middle of the image, of which the front and middle part passed through a large stain causing the contrast to the background being small. There are horizontal and vertical construction joints in the image. Due to its similarity to the crack is high, the commission error of automatic crack detection has increased.
The first step is linear stretch. After this process, the background became lighter and the crack became darker in the result image. The International Archives of the Photogrammetry, Remote Sensing and Spatial Information Sciences, Volume XLII-2/W6, 2017
Next, we used the rolling ball background subtraction to reduce the stains effect, and the crack was enhanced from the stains and background concrete. After the process of background subtraction, some small and unclear cracks are still not easy to be detected. For the purposed to enhance these cracks, the local contrast enhancement is applied.
Figure 15. Crack image case 2
Figure 16. The result after background subtract
The final step is using OBIA to remove the non-crack object and detect the crack from the image to get the result. Most of the cracks are detected but the middle section of crack is broken owing to the interference of stains. Compare with the original image, there are a few misclassified objects below the crack which is caused by the construction joint. Although we have used
the “object area/bounding box area” as a feature to filter the construction joint, which more like straight line, the boundary of construction joint is jagged that will make some misclassified results. Nevertheless, this phenomenon is not serious that most of the cracks can be successfully judged. The producer accuracy is 93.4% and the user accuracy is 90.6% in this case.
Figure 17. The result of crack detection in case 2
3.1.3 Concrete spalling
The third assessment is the concrete spalling, the user need to manually draw a region of interest (ROI) where contains the spalling area in the image and searching for a stereo pair that contains the same area. In Figure 18, one may observe a red box that contains a concrete spalling, which is manually selected by an operator.
Figure 18. Drawing an ROI with concrete spalling
Then, we generate an epipolar stereo-image and perform SGM dense image matching together with space forward intersection to generate the dense point cloud. The result is shown in Figure 19.
.
Figure 19.The dense point cloud of spalled concrete
Furthermore, the point cloud that near the boundary of box are used for plane fitting. We can thus calculate the elevation between the dense point clouds to the plane and use these elevation data to obtain a digital surface model. In Figure 20, the main concrete spalling is located in the middle, the average elevation is 9 mm and the deepest elevation is about 25 mm.
Figure 20. The elevation model presented by false colour
The International Archives of the Photogrammetry, Remote Sensing and Spatial Information Sciences, Volume XLII-2/W6, 2017In order to find the main spalling area, we set a threshold to transform it into binary image. The image processing and morphology filters are used to remove the extra part and the effect of salt-and-pepper noise. After that, the main direction was found so we can calculate its spatial information (volume, area, length and width) of this concrete spalling area. In Figure 21, the red line is the main axis and the green and orange line represent the length and width, respectively. Table 1 shows the spatial information of this concrete spalling area.
Figure 21. The main concrete spalling
Table 1. The spatial information of concrete spalling
Main direction 170 degree
Length 41.575 cm
Width 20.452 cm
Area 353.32 cm
Volume 311.493 cm
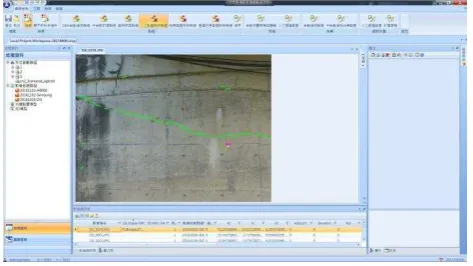
3.1.4 GUI interface design
We develop a graphic user interface (GUI) for bridge inspection and UAV image management within a laboratory. The major functionalities include automatic crack-detection using OBIA, crack editing, i.e. delete and add cracks, crack attributing, spalling area/volume calculation, and other bridge defects documentation. Figure 22 demonstrates the designed GUI interface. On the left hand side is a tree structure contains all used images and 3D bridge CAD file. The upper part is the area of all designed functions. In the middle is the image view that can overlap with the detected cracks and can be edit interactively. At the button area it can display all images, crack polygons, and 3D bridge CAD polygons. On the right-hand side, the panel can show all detail attribute of each crack record.
Figure 22. The designed GUI for bridge inspection.
Since the automatic detected cracks may not complete, as shown in Figure 23. We have developed a semi-automatic approach for crack detection. The operator can draw a ROI, as illustrated in Figure 24, then our system will crop the image for further crack
detection to complete the crack. The result is shown in Figure 25 and the new added crack will be merged with the original cracks to form a complete crack. In the end, we can estimate the total length and average width for the crack in object space.
Figure 23. A broken crack.
Figure 24. Drawing a region of interest
Figure 25. A complete crack after semi-auto crack detection
4. CONCLUSIONS
In this study, we have developed a GUI system that integrate a workflow to extract the three-dimensional information of bridge deteriorating area through imagery acquired by a multi-rotary UAV and hand-held pole. This workflow is divided into two parts, one is the crack detection and the other one is concrete spalling.
In automatic crack detection, the image pre-processing is critical in order to decrease the effect of external factors (i.e. uneven illumination, lack of light, stain, etc.). Then through OBIA and several significant object features, we have developed a rule set to detect the cracks automatically. The three-dimensional information can be calculated through the SGM and space forward intersection. The producer accuracies for two case studies are 92.6% and 93.4%, respectively. It proves that the proposed algorithm has high reliability for automatic crack detection.
In the part of concrete spalling, the operator manually draw a ROI that contain the spalling area. Then, we use the Semi-Global Matching and space forward intersection to generate the dense point cloud of spalling area surface. The point cloud which near The International Archives of the Photogrammetry, Remote Sensing and Spatial Information Sciences, Volume XLII-2/W6, 2017
the boundary of ROI will be used for plane fitting so we can calculate the elevation and use it for DSM interpolation. After the image processing, the spatial information of concrete spalling can be derived. These spatial information of monitored bridge should be preserved. In the future, these quantities can be used for change analyse when another period of UAV images were processed. This is important for bridge safety monitoring and maintenance.
ACKNOWLEDGEMENTS
The authors are grateful for the funding support from China Engineering Consultants, Inc., Taiwan
REFERENCES
Abdel-Qader, I., Abudayyeh, O., Kelly, M.E., 2003. Analysis of edge-detection techniques for crack identification in bridges. Journal of Computing in Civil Engineering 17, 255-263.
Baatz, M., 2000. Multiresolution segmentation: an optimization approach for high quality multi-scale image segmentation. Angewandte Geographische Informations verarbeitung XII, 12-23.
Blaschke, T., 2010. Object based image analysis for remote sensing. ISPRS journal of photogrammetry and remote sensing 65, 2-16.
Cho, W., Schenk, T., Madani, M., 1993. Resampling digital imagery to epipolar geometry. International Archives of Photogrammetry and Remote Sensing 29, 404-404.
Gavilán, M., Balcones, D., Marcos, O., Llorca, D.F., Sotelo, M.A., Parra, I., Ocaña, M., Aliseda, P., Yarza, P., Amírola, A., 2011. Adaptive road crack detection system by pavement classification. Sensors 11, 9628-9657.
Hirschmuller, H., 2008. Stereo processing by semiglobal matching and mutual information. IEEE Transactions on pattern analysis and machine intelligence 30, 328-341.
Lang, S., Albrecht, F., Blaschke, T.,, 2011. OBIA-Tutorial,Centre for Geoinformatics(Z_GIS). Paris-Lodron University Salzburg.
Otsu, N., 1979. A threshold selection method from gray-level histograms. IEEE transactions on systems, man, and cybernetics 9, 62-66.
Rashed, M., 2016. Rolling ball algorithm as a multitask filter for terrain conductivity measurements. Journal of Applied Geophysics 132, 17-24.
Sternberg, S.R., 1983. Biomedical image processing. Computer 16, 22-34.
Talab, A.M.A., Huang, Z., Xi, F., HaiMing, L., 2016. Detection crack in image using Otsu method and multiple filtering in image processing techniques. Optik-International Journal for Light and Electron Optics 127, 1030-1033.
Zhang, W., Zhang, Z., Qi, D., Liu, Y., 2014. Automatic crack detection and classification method for subway tunnel safety monitoring. Sensors 14, 19307-19328.