THE EFFECT OF IMAGE ENHANCEMENT METHODS DURING FEATURE
DETECTION AND MATCHING OF THERMAL IMAGES
O. Akcay a , E.O. Avsar a
a Canakkale Onsekiz Mart University, Faculty of Engineering, Department of Geomatics Engineering, 17100 Canakkale, Turkey - (akcay, ozguravsar)@comu.edu.tr
Commission VI, WG VI/4
KEY WORDS: Feature Detection, Feature Extraction, Thermal Image, Matching, Photogrammetry, Image Processing
ABSTRACT:
A successful image matching is essential to provide an automatic photogrammetric process accurately. Feature detection, extraction and matching algorithms have performed on the high resolution images perfectly. However, images of cameras, which are equipped with low-resolution thermal sensors are problematic with the current algorithms. In this paper, some digital image processing techniques were applied to the low-resolution images taken with Optris PI 450 382 x 288 pixel optical resolution lightweight thermal camera to increase extraction and matching performance. Image enhancement methods that adjust low quality digital thermal images, were used to produce more suitable images for detection and extraction. Three main digital image process techniques: histogram equalization, high pass and low pass filters were considered to increase the signal-to-noise ratio, sharpen image, remove noise, respectively. Later on, the pre-processed images were evaluated using current image detection and feature extraction methods Maximally Stable Extremal Regions (MSER) and Speeded Up Robust Features (SURF) algorithms. Obtained results showed that some enhancement methods increased number of extracted features and decreased blunder errors during image matching. Consequently, the effects of different pre-process techniques were compared in the paper.
1. INTRODUCTION
Thermal cameras offer the benefits of ease of use, relatively low-cost surveys to map 3-D structures and create digital elevation models (DEMs) using photogrammetric method (Erenoglu et al. 2017, Fonstad et al. 2013, Vilardo et al. 2015). However, thermal cameras do not maintain radiometric stabilization between images taken from different views. Moreover, features detected and matched on thermal images are generally less abundant than defined in high-resolution images (Akcay et al. 2016). Due to low spatial and radiometric resolutions, most of the matched features on the thermal images are detected as outliers.
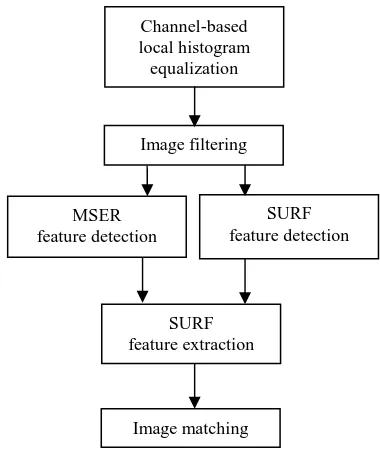
In this paper, the process flow was implemented as shown in Figure 1. First, histogram equalization including channel-based local contrast-limited adaptive enhancement were used for intensity adjustment (Zuiderveld, 1994). Each enhancement methods produce a new diverse image, depending on the parameters used in the process algorithm. For example, the Gaussian filter which defines the blur level with a chosen standard deviation and the mask size, influence feature detection, extraction and matching results. Therefore, the image filtering methods using different parameters were also analysed to acquire better matching accuracy. A high pass filter that approximates the two-dimensional Laplacian operator was used to form sharpen images. Moreover, a composite version of the Laplacian mask was also performed to produce other sharpen thermal images. Mean filters, variations of mean filter and Gaussian blur filters were considered to remove noise form thermal images. After image filtering, object features were detected using different parameters of two detection algorithms Maximally Stable Extremal Regions (MSER) and Speeded Up Robust Features (SURF) algorithms (Matas et al. 2002, Nister et al. 2008, Bay et al. 2008). Finally, image matching
performances were compared after features extraction was executed.
Histograms of the thermal images were also discussed while matching results were evaluated. Image histograms illustrated that some local image features improve feature detection and extraction quality. The paper explains that some analyses before the feature detection might contribute matching results in spite of low spatial and radiometric image resolutions.
Figure 1. Process flow Channel-based local histogram equalization
MSER feature detection
SURF feature detection
SURF feature extraction
Image matching Image filtering
The International Archives of the Photogrammetry, Remote Sensing and Spatial Information Sciences, Volume XLII-1/W1, 2017 ISPRS Hannover Workshop: HRIGI 17 – CMRT 17 – ISA 17 – EuroCOW 17, 6–9 June 2017, Hannover, Germany
This contribution has been peer-reviewed.
2. PROCESS
2.1 Local Histogram Equalization
Since thermal sensors are too sensitive to object distance and minor heat differences, considerable flaws might occur in intensity representation throughout different camera positions. Due to instabilities of thermal sensors, unnatural rapid radiometric changes at the objects images are observed during recording. Figure 2 shows two overlapping thermal images from different camera stations are seen. The reflection of sunrays afflicts pixel intensity values due to camera angles and movements. Distinguished differences, which decreases performances of matching algorithms, appear explicitly between Figure 2a and Figure 2b.
Figure 2a. Left image, 1b. Right image
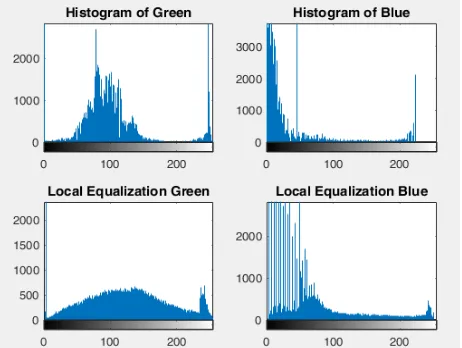
To overcome radiometric instabilities of the images, local histogram equalization called as adaptive histogram equalization were applied to the images. Before the implementation of the histogram equalization, color image representation were decomposed as Red Green and Blue channels in order to obtain more efficient equalization results. When the original histogram of the channels were inspected, Green and Blue channels were processed, Red channel was left intact due to their histogram distribution. Figure 3 and 4 show before/after histogram equalizations of the left and right images respectively. In this step, thermal images were provided more appropriate representation of the scene. Instable features of the thermal images were reduced.
Figure 3. Before/after histogram equalizations of the left image
As the histograms of Green and Blue channels intensify certain values to narrow ranges, some object features in the images were lost. After local adaptive histogram equalization was applied to poor distributed channels, hidden features were made more visible. Moreover, abrupt contrast changes occurred in the images were compensated partially. Figure 5a and 5b shows results of the enhanced left and right images, respectively.
Figure 4. Before/after histogram equalizations of the left image
Figure 5a. Enhanced left image 5b. Enhanced right image
2.2 Image Filtering
Adaptive histogram equalization does not improve the matching performance enough. The images need some more enhancement such as blurring and sharpening filters to increase number of robust matched point. In this step, image sharpening was implemented by the unsharp masking, which increases the contrast along the edges where different gray values meet. Unsharp masking makes an image sharpened by subtracting a blurred (unsharp) version of the image from itself. Standard deviation of the Gaussian lowpass filter, strength of the sharpening effect and minimum contrast required for a pixel are represented as radius, amount and contrast threshold, respectively. On the other side, blurred images were also obtained using 2-D Gaussian filtering to analyse the effect of the filtering. Standard deviation of the Gaussian distribution is used as the only blurring parameter and called as deviation in the paper.
2.3 Feature Detection
Features, which were detected in the filtered images were obtained by MSER and SURF methods. MSER and SURF have their own unique parameters that can change detection results. To understand the influences of the parameter values on feature detection, MSER and SURF algorithms were applied to the images with different parameter values. The MSER detector incrementally steps through the intensity range of the input image to detect stable regions. MSER parameters are as follows:
1. Threshold change: Represents step size between intensity threshold levels.
2. Minimum region area: Allows minimum size of the region in pixels.
The International Archives of the Photogrammetry, Remote Sensing and Spatial Information Sciences, Volume XLII-1/W1, 2017 ISPRS Hannover Workshop: HRIGI 17 – CMRT 17 – ISA 17 – EuroCOW 17, 6–9 June 2017, Hannover, Germany
This contribution has been peer-reviewed.
3. Maximum area variation: Defines maximum area variation between extremal regions at varying intensity thresholds.
Considered parameters of SURF detector are as follows:
1. Threshold: Enables strongest feature threshold that eliminates linear features.
2. Octaves: Define number of octaves that resize the original image to half size.
3. Scale: Define number of scale levels, which generate progressively blurred out images per octave
2.4 Feature Extraction and Matching
Both detected SURF and MSER features were extracted using SURF extraction algorithm. The centroid and the axes of the MSER region were used to define location and the scale of the descriptor.
Extracted features were matched using the pairwise distance between feature vectors of left and right images. However the matching results includes outliers. The outliers were excluded using the M-estimator SAmple Consensus (MSAC) algorithm (Torr et al., 2000). The MSAC algorithm is a variant of the Random Sample Consensus (RANSAC) algorithm. The algorithm is based on the estimated transformation parameters.
3. RESULTS
Due to chosen filtering and detection parameters, same image pairs demonstrate varying number of robust feature matching. Table 1 shows values of the parameters for each experiment. Table 2, 3, 4 and 5 explain differences that are occurred among the experiments.
Process Parameter Values for table #
1 2 3 4
Table 1. Implemented processes and their parameter values
Image type Match results
Detection Type outliers inliers
Original SURF 4 2
Table 2. Results of the experiment 1
Image type Match results
Detection Type outliers inliers
Original SURF 4 2
Table 3. Results of the experiment 2
Image type Match results
Detection Type outliers inliers
Original SURF 4 2
Table 4. Results of the experiment 3
Image type Match results
Detection Type outliers inliers
Original SURF 7 3
Table 5. Results of the experiment 4
4. CONCLUSIONS
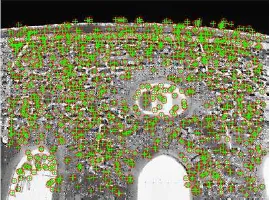
The results that were illustrated in tables, describe the effect of matching parameters explicitly. The combination of the image sharpening and SURF detector produce the best match results. Higher number of the octave and scale support matching quality. Moreover, minor threshold decreases in SURF do not yield bad outputs. Sharpening parameters also are important to get more robust matched image changing radius and amount. Figure 6 shows 1109 match features that were computed using SURF algorithm from sharpened adaptive histogram equalization images.
Figure 6. SURF algorithm applied on sharpened adaptive histogram equalization image pair
The International Archives of the Photogrammetry, Remote Sensing and Spatial Information Sciences, Volume XLII-1/W1, 2017 ISPRS Hannover Workshop: HRIGI 17 – CMRT 17 – ISA 17 – EuroCOW 17, 6–9 June 2017, Hannover, Germany
This contribution has been peer-reviewed.
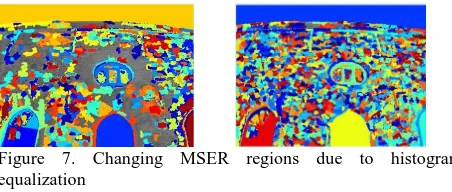
MSER detector is not as successful as the SURF detector. However, the higher performance can be also obtained with MSER parameters. Figure 7 illustrates changing region characteristics of MSER depending on image pre-processing.
Figure 7. Changing MSER regions due to histogram equalization
In the future work, photogrammetric results which is measured image coordinates methods mentioned above will be discussed. The methods which achieve higher matching accuracy will be presented.
REFERENCES
Moons, T., 1997. Report on the Joint ISPRS Commission III/IV Workshop “3D Reconstruction and Modelling of Topographic Objects”, Stuttgart, Germany http://www.radig.informatik.tu-muenchen.de/ISPRS/WG-III4-IV2-Report.html(28 Sep. 1999).
Smith, J., 1987a. Close range photogrammetry for analyzing distressed trees. Photogrammetria, 42(1), pp. 47-56.
Smith, J., 1987b. Economic printing of color orthophotos. Report KRL-01234, Kennedy Research Laboratories, Arlington, VA, USA.
Smith, J., 1989. Space Data from Earth Sciences. Elsevier, Amsterdam, pp. 321-332.
Smith, J., 2000. Remote sensing to predict volcano outbursts. In: The International Archives of the Photogrammetry, Remote Sensing and Spatial Information Sciences, Kyoto, Japan, Vol. XXVII, Part B1, pp. 456-469.
Akcay O., Erenoglu R.C., Erenoglu O., 2016. Correction and Densification of UAS-Based Photogrammetric Thermal Point Cloud, ISPRS 2016 - XXIII ISPRS Congress, III/2 16/7 16:30: III/2 - Point Cloud Processing 2, Prag, 12-19 July 2016.
Bay, H., A. Ess, T. Tuytelaars, and L. Van Gool., 2008. SURF:Speeded Up Robust Features. Computer Vision and Image Understanding. 110 (3), pp. 346–359, 2008.
Erenoglu R.C., Akçay O., Erenoğlu O., 2017. An Uas-Assisted Multi-Sensor Approach for 3D Modeling and Reconstruction of Cultural Heritage Site, DOI: 10.1016/j.culher.2017.02.007, Journal Of Cultural Heritage, 22, pp.1-12.
Fonstad, M.A., Dietrich, J.T., Courville, B.C., Jensen, J.L., Carbonneau, P.E., 2013. Topographic structure frommotion: a new development in photogrammetric measurement. Earth Surf.
Process. Landf. 38, 421–430.
http://dx.doi.org/10.1002/esp.3366.
Matas, J., Chum O., Urba M., and Pajdla T., 2002 Robust wide baseline stereo from maximally stable extremal regions. Proceedings of British Machine Vision Conference, pages 384-396.
Nister, D., and H. Stewenius, 2008. Linear Time Maximally Stable Extremal Regions, Lecture Notes in Computer Science. 10th European Conference on Computer Vision, Marseille, France, no. 5303, pp. 183–196.
Torr, P.H.S., and Zisserman, A., 2000. MLESAC: A New Robust Estimator with Application to Estimating Image Geometry. Computer Vision and Image Understanding.
Vilardo, G., Sansivero, F., Chiodini, G., 2015. Long-term TIR imagery processing for spatiotemporal monitoring of surface thermal features in volcanic environment: a case study in the Campi Flegrei (Southern Italy). J. Geophys.
Zuiderveld, K., 1994. Contrast Limited Adaptive Histograph Equalization. Graphic Gems IV. San Diego: Academic Press Professional. 474–485.
The International Archives of the Photogrammetry, Remote Sensing and Spatial Information Sciences, Volume XLII-1/W1, 2017 ISPRS Hannover Workshop: HRIGI 17 – CMRT 17 – ISA 17 – EuroCOW 17, 6–9 June 2017, Hannover, Germany
This contribution has been peer-reviewed.