INTEGRATION OF IMAGE AND RANGE-BASED TECHNIQUES FOR SURVEYING
COMPLEX ARCHITECTURES
M. Russo a, *, A. M. Manferdini b
a Dept. Design, Politecnico di Milano, 20158 Milan, Italy – [email protected] b
Dept. of Architecture, University of Bologna, 40136 Bologna, Italy - [email protected]
Commission V, WG V/2
KEY WORDS: 3D laser scanning, photogrammetry, Data comparison, Data integration
ABSTRACT:
In the last decade the Cultural Heritage field has deeply benefited from the opportunities of collecting accurate and detailed 3D information of sites and artifacts using both image- and range-based techniques. Since few years ago these technologies were not so extensively used, mainly because they were very expensive, required expertise and the pipeline and procedures related to their use were not straightforward, nor consolidated. But in the last years significant improvements in the digital survey technologies have been reached, with the principal scope of simplifying reality-based survey procedure and providing a series of different solutions that combine the automation of processes with accuracy and resolution performances. In addition to these aspects, the lowering of costs and the consequent widespread use of some survey solutions, such as, for example, range-based, as well as terrestrial and UAV image-based ones, have recently given strong impulse to the widening of use of these technologies in the Cultural Heritage field. As a consequence, this range of possibilities shows that in this field, where case studies have peculiar geometric and radiometric characteristics and survey conditions are often unique, preliminary investigations and evaluations are mandatory in order to define the most suitable solution to adopt.
In this context, this paper presents preliminary results from the Santa Maria di Pomposa survey project, with the purpose of starting a deep investigation on the integration of 3D digital technologies and how they can provide complete and multi-scalar information about complex architectures. This purpose is particularly important in case studies where analysis have to be conducted at different scales of complexity. Structural analysis are just an example of the need to easily handle complete and global information that have to be deeply and detailed analyzed, eventually showing the behavior of structures over time. Within the adopted methodology, the comparison of results obtained using different approaches represents an indispensable step in order to evaluate and select the most reliable and suitable solutions to adopt within the final integrations process.
* Corresponding author. This is useful to know for communication with the appropriate person in cases with more than one author. 1. INTRODUCTION
During the last decade several improvements in the digital technologies field, developed with the purpose of easing reality-based surveys and therefore to widen their use in different fields, have provided a series of solutions that combine the automation of different processes with accuracy and resolution. The Structure from Motion approach, for example, is an interesting and promising outcome of researches that was developed in Computer Vision with the purpose of automating some steps of data processing and therefore to ease the 3D digitization process. Since the SfM approach was originally developed for visualization aims, the metric aspects represented a minor aspect. In the last years more attention has been paid on this aspect in order to improve accuracy and resolution of survey and modeling processes. Some of the main advantages offered by latest developments rely on the possibility to automate steps such as camera calibration, homologous points detection, meshing and texturing. The possibility to use standard digital cameras and low-cost packages to process data is another important issue that has attracted much attention on these solutions. This is the reason why a series of projects have been recently promoted in different contexts, investigating the ability of these solutions to provide good quality 3D data in terms of accuracy and resolution [Hermon et al. 2010; Kersten and Lindstaedt 2012; Remondino et al. 2012; Dellepiane et al. 2013; Guidi et al. 2013; Manferdini and Galassi 2013]. Besides these improvements, in case of open and wide Cultural Heritage sites or artifacts, the possibility to integrate image acquisitions from the ground and using UAV equipments allows
to reach a more complete coverage of the surveyed data. Moreover, UAV image acquisitions often require to pre-define survey paths, with clear advantages in the full compliance of distances, resolution and overlapping areas among adjacent images. As a consequence, these captures can optimize both the automatic alignment of photographs and, in general, the whole post-processing of data, since they can avoid the management of redundant data [Nex and Remondino 2014].
In addition, nowadays range-based instruments are strengthening their potentialities in terms of resolution, accuracy and reliability, offering a wide range of solutions to acquire good quality 3D information in contexts where a multi-scalar survey and where the complete acquisition of a whole 3D scene are required.
Since in the Cultural Heritage field case studies cannot be attributed to recurrent ones and therefore it is not possible to use pre-defined technologies, nor standard procedures, these continuous advancements represent an important support for many survey projects of complex artifacts that have been proposed in the last decade and that are showing that the integration of different technologies is often the best solution to survey all the geometric and matter characteristics of complex objects. [Velios and Harrison 2002; Guidi et al. 2002; Böhler and Marbs 2004; El-Hakim et al. 2004; Guidi et al. 2006, Guidi et al. 2009; Callieri et al. 2011; Remondino 2011].
The Cultural Heritage asset analyzed in this paper refers to Santa Maria di Pomposa, a case study that is not only important for its artistic and cultural relevance, but also because it belongs to the first six Italian case studies that have been acquired using digital technologies.
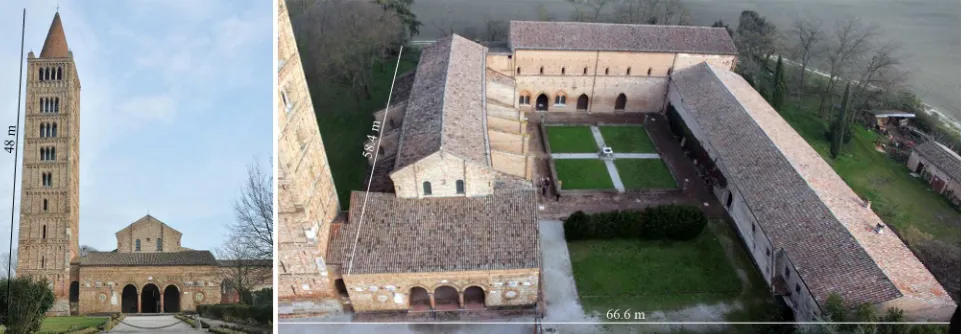
Figure 1. Images of the whole Abbey complex and its consistency.
In our project, the surveyed levels of detail allow multi-scalar investigations addressed to different kinds of analysis. From the structural point of view, for example, acquired data permit a parallel management of the whole complex and its related macro-deformations, as well as accurate analysis aimed, for example, to locate single damages or to monitor them through time.
Within the context of integrated survey techniques, the aim of the paper is to highlight on one side how 3D data acquired with different survey approaches can contribute to reach a better coverage of acquired information related to a complex and huge case study. On the other side, it shows some preliminary results obtained comparing different outputs from image- and range-based techniques that represent a key step to select the most one of the most important Abbeys of Northern Italy.
The main building of the complex is the Basilica that presents a layout that recalls the typical Ravenna style, in which the inner space is subdivided in three naves through continuous colonnades bounded with relative pulvini. The main nave ends with a hemispherical apse that corresponds to an outer pentagonal shape.
The actual layout of the whole complex is the result of different important transformations that occurred through centuries and that have basically changed the original Roman one. A detailed analysis of the historical sources and signs on the monument allowed to distinguish twelve main steps within the transformation of the church [Faccioli, 1901; Russo, 1984]. Some of these phases deeply influenced the structural behaviour of the complex in relationship with the ground on which it was built. In particular, the extension of the whole church with the addition of two bays, of the narthex, of the crypt and of the sequence of lateral chapels interrupted the original schema of the church, with evident consequences on its structural behaviour.
Besides some survey campaigns which were conducted in the past mainly for documentation aims, these structural aspects reinforce the need to acquire highly detailed information in order to monitor and preserve it from possible damages.
From 1985 to 1992, for example, a complete survey campaign was led in order to check the stability and safety of the church that presents clear deformations and cracking phenomena on its walls. These inspections verified that the main reasons of the distortions of the church is due to the presence of the huge bell-tower, that is responsible of the pulling phenomenon of the church walls and to the presence of added walls [Pavan 1984; Di Francesco, 1988; Di Francesco and Mezzadri, 1989; V.V. A.A., 1992] that, nevertheless, have never been demolished.
2.1 Historical background
The first historical proof of the existence of the Monastery is confirmed by a Pope’s letter of 874 AD.
The church was consecrated in 1026 AD while the huge bell-tower was built starting from 1063, opening the most important period for the Monastery that was reached between the XI and the XII century.
The initial role of the church within the territory was directly related to the Po river, which established its growth and relative slow decadence after the XIV century, due to the frequent floods and to the consequent increase of marshes in the fields. The ever worst climatic conditions and the general decadence of the monastic orders slowly reduced the role of the Abbey, which was suppressed in 1553 and abandoned by the monks in the 1671 [Salmi, 1966].
After the XIX century, the importance and role of the church grew again, also thanks to the progressive improvement of climatic conditions and to the reclaiming of lands. After several conservative restorations the Abbey came back to its original magnificence.
2.2 Survey background
As already mentioned, the historical and artistic importance of this case study required different survey campaigns in the past. Some of them were conducted mainly to verify its consistency and meanwhile trace the evolution of structural phenomena that interest it.
Two different survey campaigns were carried out in the last century: the first one regarded the whole complex and was completed after the restoration campaign in 1926. The graphical representations of this survey consist in orthogonal projections and related measures that were acquired using traditional technologies (Fig. 2).
The second survey campaign was carried out after those structural investigations and thanks to an agreement that was ISPRS Annals of the Photogrammetry, Remote Sensing and Spatial Information Sciences, Volume II-5, 2014
Figure 2. Lateral view of the church and vertical section of the main nave which were drawn in 1926 (data source: Archivio
Disegni della S.B.A.A. of Ravenna).
signed in 1998 between the University of Ferrara and the Visual Information Technology Department of the NRCC, in order to test some new 3D acquisition technologies as well as definition, accuracy and the whole pipeline performed on this wide and complex architecture [Addison and Gaiani 2000, Beraldin et al. 2000; El-Hakim et al., 2003].
Both surveys were not suitable to verify the global structural condition of the church. As a matter of fact, the first investigation highlighted limitations mainly due to the adopted technologies that were not suitable to obtain the required accuracy and definition. The second project was not even suitable for that purpose, since the most detailed survey campaign was limited to the main façade and narthex, whose 3D data were inserted in a simplified whole model that was built using digital photogrammetry or theodolite data and that didn’t allow to analyze the continuity of entire walls deformations. For these reasons, a new 3D survey campaign was recently planned, in order to acquire the global structure of the Church and its annexed buildings and therefore allow to highlight its structural deformations. This survey project also represents the occasion to test different approaches and technologies, aiming at finding the best solution for the high resolution documentation of a huge architectonical complex. The presented investigations show pros and cons of each approach and suggest an integration of different techniques as the best solution for the 3D acquisition of complex case studies.
Figure 3. Pictures of the survey equipment.
3. THE ADOPTED SURVEY METHODOLOGY
3.1 Equipment
The survey campaign was conducted using both image- and range-based techniques. During the survey campaign planning, one of these technologies was selected as a reference one, both for quality analysis and to provide an integration framework. In particular, the outer surface of the whole complex was acquired a ToF Leica ScanStation C10. This survey campaign was performed using targets mounted on mobile staffs in order to build a rigid polygonal grid and meanwhile collect accurate and detailed measures of the whole complex.
Contextually, two close range image acquisition campaigns were performed, a ground acquisition and a flight one. During terrestrial acquisitions, two uncalibrated digital cameras were used, a FUJIFILM FinePix HS20EXR and a NIKON D90 equipped with a AF-S DX Nikkor 18-105 mm. The flight images were acquired thanks to a S800 Evo UAV equipped with a three axes gimbal brushless on which an uncalibrated Canon Eos M mirrorless camera was mounted (Fig. 3). As far as data processing is concerned, three different packages were used: Leica Geosystem Cyclone for 3D laser scanner data management, Agisoft PhotoScan for 2D image processing and the free Cloud Compare solution for 3D data comparisons.
3.2 Survey campaign planning
The Pomposa Abbey is located in the countryside, quite far from other surrounding buildings. This condition is perfectly suitable for testing different survey techniques. Nevertheless, the presence of vegetation surrounding the complex represented an evident limitation especially for the image-based surveys. As a consequence, different portions of the whole outer surface present consistent shadowing effects or sparse data, corresponding to areas affected by occlusions (Fig. 4).
In these areas, the range-based approach performed using the laser scanner close to the external walls for the South-Eastern portion represented the best solution to integrate missing information.
Figure 4. Layout of vegetation and relative shadowing and occlusion areas.
Figure 5. Schema of the close up image-based survey campaign planning using the Nikon D90 camera. In red, photographs
related to the small scale (1:20) survey.
As far as this approach is concerned, the need to provide a rigid polygonal framework of the whole complex required a precise planning of station and targets positions.
During this step, particular attention was paid to the acquisition of the main façade of the church, the bell tower, the roof structure and its relative buttresses, in order to provide accurate and detailed information, as well as the best surface coverage acquired from the ground.
Image-based acquisitions were planned considering the environmental limitations and following two main approaches. The first one was focused on the acquisition of the main parts of the Abbey (façade and bell-tower), using few images captured far-off from the whole complex from the North-Western point of view and framing the whole monument in each single image. The second one consists in capturing more images quite near and parallel to the walls (4-5 meters) all around the monument, acquiring several vertical overlapped stripes for each horizontal position (Fig. 5).
As far as the first approach is concerned, images were captured paying attention to the 60% minimum overlap, to illumination conditions and to the capturing of the whole height of the monument in each photograph. During those acquisitions, no relation between focal length and acquisition distance was considered.
On the contrary, close distance images were captured after a careful planning of the relationship between image dimensions (4608 x 3465 pixels for Finepix and 2848 x 4288 pixel for Nikon) that determined the resolution of acquisition with respect to two scales of representation (large scale 1:50; small scale 1:20) and to the distance from the artifact. These preliminary evaluations led to the definition of horizontal sets of photographs that interested the outer walls of the buildings. The image-based survey of the bell tower was instead planned through the use of different focal length in relation to shooting distance along the height of the building [Manferdini and Russo, 2013].
Finally, the image-based survey from UAV was conducted in order to partially overdo shadowing limitations and to acquire the roof of the entire complex that was not visible from the ground. These acquisitions were planned through two different campaigns: a nadiral one devoted to acquire the roofs system, while the second one that was planned to acquire the whole complex by sloping the axe of the digital camera.
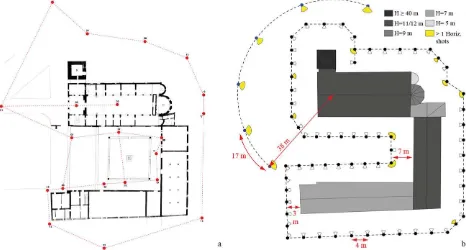
Figure 6. Range-based (a) and image-based (b) survey layouts.
3.3 Survey
The survey campaign through laser scanner was led by placing 21 station positions (Fig. 6a). Three main scanning set-ups were adopted in relation with the relevance of the architectonical element to document. For the main façade and the bell tower, an average sampling step of 0.5 cm was selected, while the other parts of the complex were acquired through an average sampling step of 2 cm in order to minimize survey timing and ease the management of point clouds. In addition, an acquisition of the surrounding area was carried out using a sampling step of 20 cm at 100 m distance.
Image-based acquisitions were carried out during laser scanning campaign in order to minimize survey time. The far-off framework acquisition was easily completed following a constant distance between shooting points. Afterwards, detailed images were acquired at pre-defined distances from the artefact. In both cases, the 60% minimum overlap was considered. Close distance images were captured considering the horizontal and vertical subdivision of façades and the related minimum overlap following image resolution and the predefined scales of representation (Fig. 6b). In both approaches, in specific positions, such as, for example in corners, several images were captured from the same position in order to enlarge the area of image acquisition and straightforward their alignment.
The UAV session consisted in two flights at 50 meters height. Flights were planned to capture on one hand vertical images following a classical flight plan with 40% horizontal and 60% vertical of overlapping, on the other hand, the second flight was planned following a rectangular path around the complex, sloping camera in order to capture the façades of the complex (Fig. 7).
Figure 7. Two UAV flight plans: a) nadiral acquisitions; b) camera sloped acquisitions.
3.4 Data process
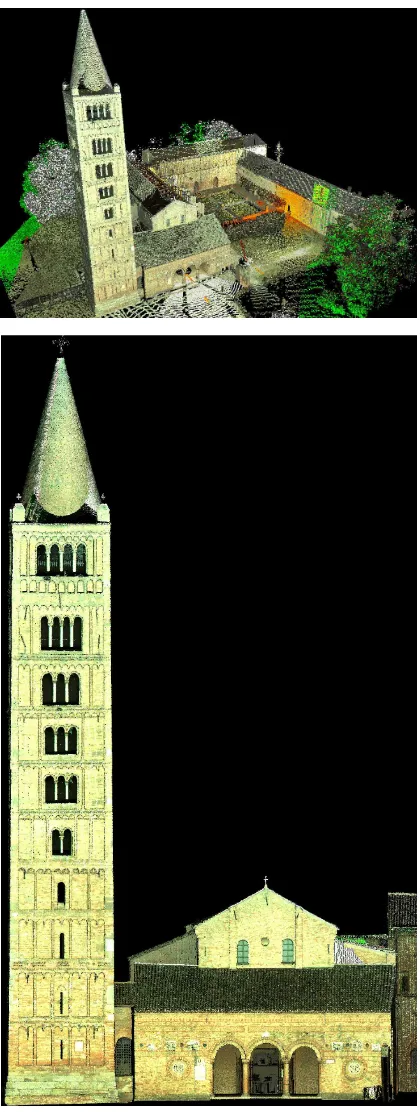
As far as the post processing of data is concerned, Leica ScanStation C10 scans were automatically aligned in the same reference system thanks to the use of a couple of targets located and captured by the scanner before and after each station position. This automatic alignment assured a Mean Absolute Error of 0.002 m for Enabled Constraints.
Following a well known pipeline, aligned data were then cleaned from useless data (trees, ground, etc,). Afterwards, two point clouds were created: the first one related to the main
Figure 8. Final aligned point cloud obtained using a Leica ScanStation C10 laser scanner.
façade of the church, which was sub-sampled at 20 mm of resolution, the second one that is related to the whole complex was sub-sampled at 50 mm. Both point clouds were decimated using the unify algorithm available in Cyclone in order to build two gold standard models and ease their management, for example, during the data comparison process (Fig. 8).
Images-based acquisitions were processed following the Structure from Motion approach implemented in Agisoft PhotoScan package.
TECHNOLOGY SURVEY DATA PROCESSING TOTAL TIME (h)
# Images/Scans Time (h) # Points (x 106) Time (h)
3D Laser scanning 21 11 161 3 14
Image-based: far-off imaging 25 0.2 3 1 1.2
Image-based: close imaging. 83 1.5 37 2 3.5
Image-based: UAV vertical imaging 47 0.1 7 1 1.1
Image-based: UAV sloped imaging 70 0.2 4 2 2.2
Table 1. 2D/3D data acquisition and processing timing.
Initially the far-off, close and UAV images (both vertical and sloped ones) were processed separately, in order to generate point clouds related to the same survey condition. Afterwards a suitable set of images captured using different digital cameras were selected in order to verify the efficiency of the processing step using an increasing number of images captured using different focal lengths, distortions and survey conditions. Each set of images was automatically aligned and a set of sparse homologous points was extracted, then the related dense point clouds were finally created. Also during this step, the quality and definition of the final point cloud was defined following the manageability of information during data comparison. For the alignment of UAV images sequences, GPC (Ground Points Control) were introduced in the process, in order to compensate for/minimize errors due to deformations. The coordinates of these points were extracted from the point clouds, choosing distributed and evident locations (Fig. 9).
At the end five different point clouds were generated and cleaned from external and spurious points, in order to minimize errors in the comparison phase. The elimination of these points required both manual and automatic procedures, this latter by means of noise reduction algorithm that was always followed by a visual check of results.
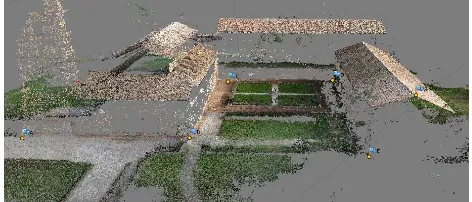
Figure 9. View of the sparse cloud of homologous points automatically recognized within nadiral photographs captured
using the UAV equipment, and related GPC.
4. DATA COMPARISION
Comparisons of data surveyed using different techniques required a preliminary step due to the fact that image-based technologies do not allow to acquire absolute dimensions of objects. For this reason, each 3D model built using this approach was scaled following selected dimensions measured through laser scanner. In order to minimize comparison errors, the scaling process was performed using the average value among three significant long distances measured on the laser scanner point cloud.
After this step, image-based models were aligned on range-based ones using the ICP algorithm. Then distances between pairs of point clouds were calculated (Fig. 10).
Table 2 reports the standard deviation values between laser scanner point cloud (gold standard) and point clouds obtained from different sets of images (far-off, close, UAV) and their integrations.
Standard Deviation slightly ranges around 0.13 and is mainly due to the fact that using terrestrial laser scanner it was not possible to survey specific portions of roofs surfaces (Fig. 10). Besides these metric evaluations, an important aspect to pay attention to is the ability of each technique to acquire the whole outer surface of the complex. Table 2 reports this information and highlights for example the lack or consistency of information on specific areas such as roofs, the bell tower or façades that are hidden from vegetation.
5. DATA INTEGRATION
Assessments on both metric reliability and on the ability of each technique to acquire different parts of the complex in different survey conditions, led to the integrated use of laser scanner and image-based acquisitions through the UAV as the best solution to build an accurate, detailed and complete 3D model of the whole architectonical complex.
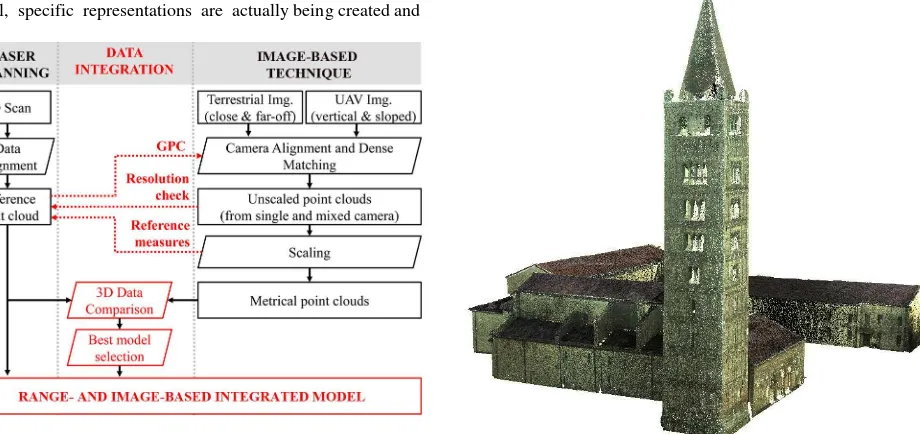
Figure 11 provides a graphic representation of the main steps of the whole process that led to the integrated final solution whose results are shown in Figure 12.
Figure 10. Examples of graphic visualization of deviations between 3D laser scanner points cloud (gold standard) and 2D images. ISPRS Annals of the Photogrammetry, Remote Sensing and Spatial Information Sciences, Volume II-5, 2014
TECHNOLOGY STD DEVIATION MEAN DISTANCE (m) MISSING AREAS
3D Laser scanning - - roofs
Image-based: far-off img. 0.134 0.077 roofs + hidden façades
Image-based: close img. 0.164 0.115 top of bell tower + roofs + hidden façades Image-based: UAV vertical img. 0.107 0.109 top of bell tower + hidden façades
Image-based: UAV sloped img. 0.123 0.109 top of bell tower + hidden façades
Image-based: close+UAV img. 0.174 0.163 top of bell tower + hidden façades
Table 2. Report of main information related to deviations among point clouds built using different approaches.
6. CONCLUSION AND FUTURE RESEARCH
The paper regards the integration between different image- and range-based survey techniques, applied to survey a complex architectural case study, Santa Maria di Pomposa Abbey, which exemplifies a wide range of characteristics that it is possible to meet in the survey of Cultural Heritage field.
The aim of this project is to suggest a possible methodology which allows to reach the better integrated results between the applied selected techniques, in order to improve their accuracy, resolution and completeness, as well as to optimize the efficiency of the whole pipeline.
In particular the image-based approach needs a preliminary experimental path to single out the more suitable solution to adopt during survey campaign. In our project such approach was followed and some first preliminary results are presented as well. In particular the comparisons led to the following consideration:
• the number of images is not directly related to the accuracy of the final model, but it is proportional to the processing time, that is often very long and close to the PC performances;
• the quality of the final model (in terms of resolution) is
related to the number of images used to cover the whole case study;
• the control of constant illumination conditions and regular image shooting can sensibly ease the alignment of images and the subsequent reduction of errors.
As a consequence of this last aspect, the survey campaign performed using UAV equipment allowed to follow more precise capturing planning, drastically shorten time and reduce the possibility of lighting changes.
As a result of the building of this complex and integrated 3D model, specific representations are actually being created and
Figure 11. Main steps of the two pipelines and their integrations.
planned, in order to provide examples of how deep investigations and analysis can profit from these graphical representations. 2D technical drawings, as well as graphic representations of out of plumb walls are just simple examples that can be used for structural analysis aims.
In the nearly future other experiments have to be faced, in order to reinforce the suggested approach and enrich the integration pipeline.
Regarding image-based techniques, a new image acquisition campaign will be planned, verifying the incidence of camera calibration in the images alignment and the improvement in the global accuracy of the final models. In addition a different flight path will be considered, in order to increase the covering of the hidden part of the Abbey, as well the capturing of vertical surfaces. The image-based survey will also be extended to the internal part of the church, exploiting the connection with 3D data acquired with laser scanner. Moreover, a second type of laser scanner will be introduced in order to cover all the internal parts of the church following a different procedure and meanwhile to enrich the integration of range-based technologies.
REFERENCES
Addison, A.C., Gaiani, M., 2000. Virtualized Architectural Heritage: New Tools and Techniques. IEEE MUltimedia, Vol. 7(2), pp.26-31.
Beraldin, J-A., Blais, F., Boulanger, P.,Cournoyer, L., Domey, J., El-Hakim, S.F., Godin, G., Rioux, M., Taylor, J., 2000. Real world modelling through high resolution digital 3D imaging of objects and structures. ISPRS Journal of Photogrammetry and
Remote Sensing, Vol. 55(4), pp. 230–250.
Figure 12. View of the integrated point cloud. ISPRS Annals of the Photogrammetry, Remote Sensing and Spatial Information Sciences, Volume II-5, 2014
Böhler, W., Marbs, A., 2004. 3d Scanning And Photogrammetry For Heritage Recording: A Comparison. In: Proceedings Of The 12th International Conference On
Geoinformatics, Gävle, Sweden, pp. 291-298.
Callieri, M., Chica, A., Dellepiane, M., Besora, I., Corsini, M., Moyés, J., Ranzuglia, G., Scopigno, R., Brunet, P., 2011. Multiscale acquisition and presentation of very large artifacts: The case of Portalada. Journal on Computing and Cultural
Heritage (JOCCH), 3(4), pp. 1-14.
Dellepiane, M., Dell’Unto, N., Callieri, M., Lindgren, S., Scopigno R., 2013. Archeological excavation monitoring using dense stereo matching techniques. Journal of Cultural
Heritage, 14(3), pp. 201-210.
Di Francesco, C., 1988. Pomposa, storia e arte dell’Abbazia. Italcards, Bologna, Italy.
Di Francesco, C., Mezzadri, G., 1989. Indagini e rilievi per interventi strutturali nella chiesa abbaziale di Santa Maria di Pomposa. In: Il Cantiere della Conoscenza, il Cantiere del
Restauro, Bressanone, Italy, pp. 53-66
El-Hakim, S.F., Beraldin, J-A., Picard, M., Godin, G., 2004. Detailed 3d Reconstruction Of Large-Scale Heritage Sites With Integrated Techniques. IEEE Computer Graphics And
Application, 24(3), pp. 21-29.
El-Hakim, S. Beraldin, J-A., Picard, M., Vettore, A., 2003. Effective 3D Modeling of Heritage Sites. In: 4th International
Conference of 3D Imaging and Modeling (3DIM'03), Banff,
Alberta, Canada. pp. 302-309.
Faccioli, R., 1901. Relazione dei lavori compiuti dall’Ufficio Regionale per la conservazione dei monumenti dell’Emilia dall’
anno 1898 al 1901, Zanichelli, Bologna, Italy.
Guidi, G., Rodríguez Navarro, P., Gonizzi Barsanti, S., Micoli, L.L., Russo, M., 2013. Quick textured mesh generation in Cultural Heritage digitization. In: Proceedings of the
International Conference on Built Heritage 2013 (BH2013),
Milan, 18-20 November, pp. 874-882.
Guidi, G., Remondino, F., Russo, M., Menna, F., Rizzi, A., Ercoli, S., 2009. A multi-resolution methodology for the 3D modeling of large and complex archeological areas.
International Journal of Architectural Computing (IJAC),
Special issue, pp. 39-55.
Guidi, G., Frischer, B., Russo, M., Spinetti, A., Carosso, L., Micoli, L. L., 2006. Three-dimensional acquisition of large and detailed cultural heritage objects. Machine Vision and
Applications, Special issue on 3D acquisition technology for
cultural heritage, Vol. 17-6, pp. 349-360.
Guidi, G., Tucci, G., Beraldin, J-A., Ciofi, S., Damato, V., Ostuni, D., Costantino, F., El Hakim, S.F., 2002. Multiscale archaeological survey based on the integration of 3D scanning and photogrammetry. In: International Workshop on Scanning
for Cultural Heritage Recording (CIPA WG/6), Korfu, Greece,
pp. 58-64.
Hermon, S., Pilides, D., Amico, N., Dšandrea, A., Iannone, G., Chamberlain, M., 2010. Arc3D and 3D laser scanning a comparison of two alternate technologies for 3D data acquisition. In: Proceedings of Conference in Computer
Applications & Quantitative Methods in Archaeology (CAA
2010), pp. 55-58.
Kersten, T. P., Lindstaedt, M., 2012. Image-Based Low-Cost Systems for Automatic 3D Recording and Modelling of Archaeological Finds and Objects. In: EuroMed 2012, Progress
In Cultural Heritage Preservation, LNCS 7616,
Springer-Verlag Berlin Heidelberg, pp. 1-10.
Manferdini A.M., Galassi M., 2013. Assessments for 3d reconstructions of Cultural Heritage using digital technologies.
In: International Archives of Photogrammetry, Remote Sensing
and Spatial Information Sciences, XL-5/W1, pp. 167-174.
Manferdini, A.M., Russo, M., 2013. Multi-scalar 3D digitization of Cultural Heritage using a low-cost integrated approach. In: Proceedings of International Conference on
Digital Heritage, Marseille, France, Vol. 1, pp. 153-160.
Nex, F., Remondino, F., 2014. UAV for 3D mapping applications: a review. Applied Geomatics, Vol. 6-1,pp. 1-15.
Pavan, G., 1984. Ricerche e lavori a Pomposa. In: L’arte sacra
nei Ducati Estensi, Sate, Ferrara. Italy.
Remondino, F., 2011. Heritage Recording and 3D Modeling with Photogrammetry and 3D Scanning. Journal on Remote
Sensing, 3, pp. 1104-1138.
Remondino, F., Del Pizzo, S., Kersten, T., Troisi, S., 2012. Low-Cost and Open-Source Solutions for Automated Image Orientation–A Critical Overview. In: EuroMed 2012, Progress
In Cultural Heritage Preservation, LNCS 7616,
Springer-Verlag Berlin Heidelberg, pp. 40-54.
Russo, E., 1984. Profilo storico-artistico della chiesa abbaziale di Pomposa. In: L’arte sacra nei Ducati Estensi, Sate, Ferrara, Italy.
Salmi, M., 1966. L’abbazia di Pomposa, Amilcare Pizzi, Milano, Italy.
Velios, A., Harrison, J.P., 2002. Laser Scanning and digital close range photogrammetry for capturing 3D archeological objects: a comparison of quality and practicality. In: Proceedings of Conference in Computer Applications &
Quantitative Methods in Archaeology (CAA 2011), Oxford, pp.
205-211.
V.V., A.A., 1992. Pomposa: la fabbrica, i restauri. Longo, Ravenna, Italy.
http://www.danielgm.net/cc/ (7 March 2014).
ACKNOWLEDGMENTS
The authors would like to thank Zenith Ingegneria S.r.l. for the instrumental and technical support in the 3D scanning acquisition. Authors would also like to thank the University of Ferrara in the person of Prof. Paolo Russo and Ing. Valentina Russo who were in charge of the UAV image acquisition, and Prof. Claudio Alessandri for supplying past researches on the case study. At last authors would also like to thank the Ministero dei Beni e delle Attività Culturali e del Turismo, Soprintendenza per i Beni Architettonici e Paesaggistici di Ravenna for having granted the use of acquired 3D data for scientific purposes.