TREE CANOPY COVER MAPPING USING LiDAR IN URBAN BARANGAYS OF CEBU
CITY, CENTRAL PHILIPPINES
J.A. Ejares a,*, R. R. Violanda a, b, A. G. Diola a, c, D. T. Dy a, c, J.B Otadoy c, R. E. S. Otadoy a,b
a USC Phil-LiDAR Research Center, Fr. Josef Baumgartner Learning Resource Center, University of San Carlos – Talamban Campus, Nasipit, Talamban, 6000 Cebu City, Philippines s – (ejaresjay, renante.violanda, usctcdream, dydt.up, juliebotadoy,
rolandotadoy2012)@gmail.com
b Theoretical and Computational Sciences and Engineering Group, Department of Physics, University of San Carlos, 6000 Cebu City, Philippines
c Department of Biology, University of San Carlos, 6000 Cebu City, Philippines
KEY WORDS: Object-Based Image Analysis, LAStools, CHM, NDSM, multi-threshold segmentation, urban forest management, urban planning.
ABSTRACT:
This paper investigates tree canopy cover mapping of urban barangays (smallest administrative division in the Philippines) in Cebu City using LiDAR (Light Detection and Ranging). Object-Based Image Analysis (OBIA) was used to extract tree canopy cover. Multi-resolution segmentation and a series of assign-class algorithm in eCognition software was also performed to extract different land features. Contextual features of tree canopies such as height, area, roundness, slope, length-width and elliptic fit were also evaluated. The results showed that at the time the LiDAR data was collected (June 24, 2014), the tree cover was around 25.11% (or 15,674,341.8 m2) of the city’s urban barangays (or 62,426,064.6 m2). Among all urban barangays in Cebu City, Barangay Busay had the highest cover (55.79%) while barangay Suba had the lowest (0.8%). The 16 barangays with less than 10% tree cover were generally located in the coastal area, presumably due to accelerated urbanization. Thirty-one barangays have tree cover ranging from 10.59-27.3%. Only 3 barangays (i.e., Lahug, Talamban, and Busay) have tree cover greater than 30%. The overall accuracyof the analysis was 96.6% with the Kappa Index of Agreement or KIA of 0.9. From the study, a grouping can be made of the city’s urban barangays with regards to tree cover. The grouping will be useful to urban planners not only in allocating budget to the tree planting program of the city but also in planning and creation of urban parks and playgrounds.
1.0INTRODUCTION
Trees are important assets providing environmental, aesthetic, cultural and economic benefits. However, one of the major effects of rapid urban growth is the decline of tree cover due to anthropogenic forces. As tree cover decline in cities, so will the associated ecosystem services and their effects on environmental quality and human health. Tree cover data can provide a baseline for developing management plans, setting tree cover goals, and longitudinal forest monitoring.
Trees, as green infrastructures, provide a wide variety of public benefits, including air and water quality improvement, storm water quantity reductions, carbon storage and pollution reduction in urban settings (McPherson et al., 2013). These benefits are referred to as ecosystem services. To maximize these benefits, an urban forest inventory is often needed for planning and management purposes.
As the growing share of population now lives in cities and their surroundings, the need to improve the quality of urban environments has become greater. According to the Philippine Statistics Authority (2010), 45.4% Filipinos (41.9M of 92.3M of the total population) live in urban areas. In 2010, 93.5% of Cebu City's total population (866,171) resided in urban barangays. Additionally, the rate of natural disasters (i.e. storms, floods, landslides, and droughts) has steadily increased which reminds us that resilience to disasters is of critical importance and that trees play an important role in protecting city environments (McPherson et al., 2013).
The fundamental measure of urban forest structure is the canopy cover, the area covered by tree canopies in an urbanized region (Nowak, 1994). Airborne LiDAR (Light Detection and Ranging), a recent sensor technology in remote sensing have allowed a rapid and efficient tool for mapping, monitoring, and assessment of forest resources (Lim et al., 2003; van Leeuwen and Nieuwenhuis, 2010; Wang et al., 2010). This technology has become an attractive alternative to field surveys in forest inventory because data can be regularly acquired due to its lower total cost and greater area coverage (Zhang and Qiu, 2012). Moreover, LiDAR is capable of accurate vertical information, including the ability to penetrate the vertical profile of a forest canopy and quantify its structure (Vaze and Teng, 2007; Wang et al. 2010; Ke and Quackenbush, 2011; NOAA, 2012). The use of airborne LiDAR in emerging economies such as the Philippines comes at a time when our country is fast-tracking its resource mapping capability for land- use planning. This technology could substantially help in conservation management, vegetation inventory and assessment of natural resources, among others.
Among the many cities in the Philippines, the urbanization of Cebu City is fast accelerating leading to the increasing use of its land for housing, commercial, industrial, institutional, and other related structures. Most of the natural forests (9.6%) of the city are found only in the rural areas / barangays (Cebu City LGU, 2011). There are, however, patches of vegetation in downtown Cebu City intersperse among buildings, streets, residential areas in a mixed urban development setting. Thus, there is a need to assess whatever remaining age-old trees thriving in downtown The International Archives of the Photogrammetry, Remote Sensing and Spatial Information Sciences, Volume XLI-B8, 2016
Cebu City. With the acquisition of LiDAR equipment and data by the Philippine government, the quantification of tree cover becomes feasible. In this paper, we use LiDAR data acquired by a one-band LiDAR system to map the vegetation cover (i.e., trees) within Cebu City. It should be noted that the current LiDAR data is insufficient for tree species identification, especially in urban forests with diverse species and high spatial heterogeneity.
2.0 MATERIALS AND METHODS
2.1 Description of the Study Area
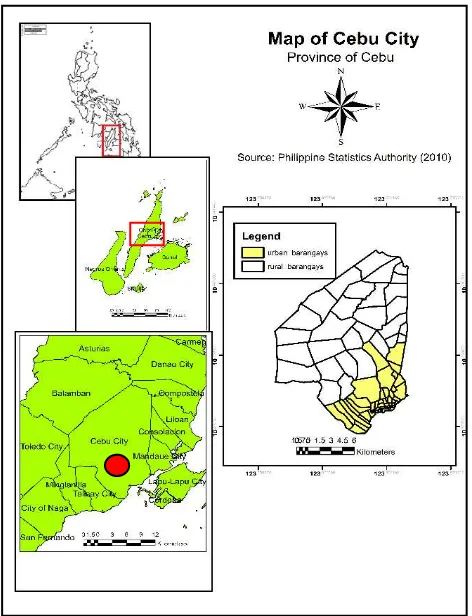
Cebu City is located on the central eastern part of Cebu Province, an island in Visayas, Central Philippines. It is 100 17' N and 1230 54' E. It is bound by Mandaue City in the North and Talisay City in the South. On the East is Mactan Channel and on the west are the Municipality of Balamban and Toledo City (Figure 1). Under the 2005 CLUP (Comprehensive Land Use Plan), Cebu City has a total land area of 29,589 ha − administratively divided into 80 barangays, 50 of which are urban. Urban barangays has a total area of approximately 62 sq. km.
Figure 1. Map of Cebu City, Central Philippines.
2.2 Acquisition of LiDAR Data
LiDAR data for Cebu City were obtained last June 24, 2014. LiDAR point cloud LAS file was from Phil-LiDAR 2 Program “Nationwide Detailed Resources Assessment Using LiDAR.” It is a national program funded by the Department of Science and Technology (DOST), Republic of the Philippines. The LiDAR technology has a pulse density of 2 pulses/m2, with vertical accuracy of less than 10cm and a horizontal resolution of 2 per
Table 1. Scanning characteristics of LiDAR Data
System Specifications Data Attributes
Scanning Period January 14, 2014 Point Density 2 pulses/square meter Scanning Device Pegasus/Gemini Average Flying Height 1600 m Field of View (DEG) 50 Laser Pulse Frequency 320
Returns per Beam 1-7
2.3 Pre-processing of LiDAR Data
Pre-processing of LiDAR data was carried out using LAStools. Pre-processing of LAS data include tile buffering, bare earth points extraction (classifying ground points and non-ground points) and classification of non-ground points into different classes. Further, buffer points were removed prior to generating LiDAR derivatives. LiDAR derivatives that were used in the processing include canopy height model (CHM), normalized digital surface model (nDSM), digital terrain model (DTM), Slope, number of returns (NumRet) and classification layer image from LAStools.
LiDAR derivatives generated from LAStools were loaded to ArcGIS 10.0 and were mosaicked into a new raster images. The mosaic raster images were loaded as input layer images in eCognition (ver. 9.0.1) software for image segmentation and classification.
2.4 Image Segmentation and Classification
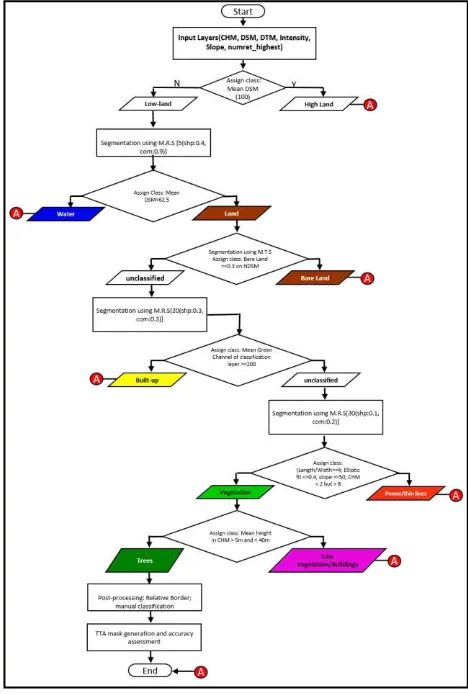
Multi-threshold segmentation algorithm was applied to the DSM layer to distinguish “Land” class from “Water” class. The threshold value used was the estimated sea level which was evaluated through visual inspection. In this study, the threshold value used was 64. Refinement of water and land classes was carried out using “Relative Border” algorithm to classify the unclassified points embedded in each class. Further, each class was merged together using “Merged Region” algorithm. Each was assigned with its corresponding class color.
Multi-threshold segmentation was applied to “Land” class to extract “Bare Land” areas. These include barren lands and agricultural fields. Areas with NDSM lesser than 0.3 m were classified as “Bare Land.” The remaining points in “Land” class were segmented using multi-resolution segmentation algorithm with a scale parameter of 20 and a shape and compactness of 0.3 in preparation for the extraction of “Built-up” features. Built-ups include houses, buildings and bridges among others. This was done using a threshold value of 200 in the classification layer’s green channel. The classification layer is a derivative based on the point classification of the LiDAR point cloud data.
The remaining points in “Land” class were further segmented using multi-resolution segmentation using a scale parameter of 30 with shape and compactness equal to 0.1 and 0.2 respectively. Finer segmentation was made to extract thin features like building edges and power lines. Points with length/width ≥ 4 and with 8 < mean CHM < 30 was considered as power lines. After all the classes were classified, it was The International Archives of the Photogrammetry, Remote Sensing and Spatial Information Sciences, Volume XLI-B8, 2016
includes tall grasses, shrubs and trees. These points were segmented using multi-resolution segmentation with scale parameter of 20 and shape and compactness equal to 0.5 and 0.3 respectively. Points with mean CHM < 5 meters were classified as “Non-Tree Vegetation” while points with mean CHM > 40 meters will be assigned as “Others”. “Tree” class was refined by eliminating obvious misclassified features using manual classification.
Figure 2. Workflow performed in eCognition software for tree
extraction in Cebu City
The features used in post-processing were the “Relative Border” algorithm, mean slope, mean elliptic fit and minimum area of the CHM. Tree class with an area < 10 pixels was assigned as “Others”. Misclassified objects were corrected using manual classification. The detailed workflow for tree canopy cover extraction is presented in Figure 2.
2.4. Accuracy Assessment
After processing using the algorithm, the accuracies of the extracted tree canopies were evaluated. Validation points were classified into different classes which include Bare Land, Built-ups, and Trees. Some of the validation points were taken from the field by taking a GPS coordinates on the actual features. After the initial classification, the first two classes were merged into one: the non-tree class. After creation of the validation points, the georeferenced tree masks were loaded into eCognition. Multi-resolution segmentation was subsequently
applied to group the pixels into objects. Test and Training Area (TTA) masks were created. Accuracy assessment was done and the confusion matrix was recorded to show the performance of the workflow. For map refinement process, ArcGIS 10.2.2 and eCognition 9 was used.
2.5 Map Refinement
Areas classified as trees were exported as object shapefiles and was loaded to ArcGIS 10.2.2 software for editing and refinement. Additional information was added to the object shapefiles such as shape length and shape area. Final refinement of the object shapefiles was carried out by removing objects with an area lesser than 4m2. Calculation of tree canopy area was carried out using the Calculate Geometry Tool of ArcGIS. Percentage canopy cover per barangay was computed to determine the percent tree cover remaining in relation to the total area of the barangay.
3.0 RESULTS AND DISCUSSION
3.1. Tree canopy cover extraction
Figure 3. Tree canopy cover map of barangay Talamban.
Showing in red is the University of San Carlos The International Archives of the Photogrammetry, Remote Sensing and Spatial Information Sciences, Volume XLI-B8, 2016
Figure 4. Tree canopy cover map of the University of San
Carlos as overlaid in Google Earth.
Based on the implementation of the above methodological procedure, the results obtained are shown as follows: [1] The (Figure 5). Barangay Busay's high tree cover can be attributed to its proximity to the Central Cebu Protected Landscape (CCPL) and having a topographic characteristic of being hilly (Cebu City LGU, 2011).
Figure 5. Urban barangays of Cebu City with its corresponding
percentage of tree canopy cover.
In addition, majority of the land use of barangay Busay is agricultural area. The 16 barangays with less than 10% tree cover were generally located in the coastal area, presumably due to accelerated urbanization; [3] Thirty-one (31) barangays have tree cover ranging from 10.59-27.34%; [4] Only 3 barangays (i.e., Lahug {31.3%}, Talamban {37.9%}, and Busay {55.8}) have tree cover greater than 30%. Barangays Lahug, Talamban, and Busay are located in residential and commercial zones, an area that represents approximately 26% of the total land area in Cebu City.
3.2. Accuracy Assessment
The overall accuracy of the analysis was 96.60% with the Kappa Index of Agreement or KIA of 0.92 (Table 2). In addition to the existing tree cover, land cover analysis estimated how much existing built-up (houses and buildings), land (open spaces), and existing (unclassified) could possibly be replaced with tree cover.
Table 2. Confusion matrix of classified pixels.
Validation Pixels
Total 387,630 1,108,022 1,513,3
48
Possible tree cover may also be under-valued slightly for areas where trees can overhang roads and buildings. This make up for some of the realistic errors. From the obtained percentage tree canopy cover, we can suggest a cost effective way to identify areas where increase in urban tree cover could be viable. This can also be used in reaching out property owners and in educating the community on tree planting programs to increase and improve the tree cover within Cebu City.
With impending road works and constructions, the remaining trees in these urban barangays are in danger of disappearing. Policy makers must take into account the vital role of trees and vegetation to the well-being of growing urbanized societies. The precise knowledge of vegetation cover in Cebu City and other key Philippine cities not only serves as a primary source for interpreting complex urban characteristics, but also provides decision makers with more realistic and multidimensional scenarios for urban forest management and development leading to a sustainable urban ecosystem in the midst of a stakeholders involved in green infrastructure development as a starting point for more detailed environmental studies, comprehensive planning, GIS analyses and targeted urban forestry implementation programs. The information will serve as the benchmark from which to measure the success of planning and urban forestry programs and to educate the public about the many benefits of trees.
ACKNOWLEDGEMENTS
This paper is an output of “Project 8. LIDAR Data Processing and Validation by HEIs for Detailed Resources Assessment in the Visayas: Central Visayas (Region 7) - FRExLS” under Phil The International Archives of the Photogrammetry, Remote Sensing and Spatial Information Sciences, Volume XLI-B8, 2016
LiDAR Program B. LiDAR Data Processing, Modelling, and Validation for Nationwide Resources Assessment headed by Dr. Ariel Blanco. We thank the Philippine Council for Industry, Energy and Emerging Technology Research and Development of the Department of Science and Technology (DOST-PCIEERD) for funding support. We also acknowledge the research programs Phil-LiDAR 1. Hazard Mapping of the Philippines Using LiDAR and DREAM headed by Dr. Enrico Paringit for the LIDAR data. Lastly, we thank the Office of Research, University of San Carlos for logistics and financial support to the Phil LIDAR 1 and 2 research programs.
REFERENCES
Cebu City Local Government Unit (LGU). (2011). About Cebu City. http://www.cebucity.gov.ph/about-cebu-city
Felicitas, P., 2013. City approved land use plan in 2005. Sun Star Cebu. Retrieved October 7, 2015, from http://archive.sunstar.com.ph/cebu/local-news/2013/03/12/city-approved-land-use-plan-2005-272511
Ke, Y., Quackenbush. L.J., 2011. A review of methods for automatic individual tree-crown detection and delineation from passive remote sensing. International Journal of Remote Sensing. 32(17): 4725-4747.
Lim, K., Treitz, P., Wulder, M., St-Onge, B., Flood, M., 2003. LiDAR remote sensing of forest structure. Progress in Physical Geography. 27: 88-106.
McPherson, E.G., Scott, K.I., Simpson, J.R., 1998. Estimating cost effectiveness of residential yard trees for improving air quality in Sacramento, California, using existing models. Atmos. Environ. 32, 75–84.
McPherson, E.G., Simpson, J.R., Peper, P.J., Xiao, Q., Wu, C., 2008. Los Angeles 1-Million tree Canopy Cover Assessment (No. PSW-207). USDA Forest Service Pacific Southwest Research Station, Albany, CA.
McPherson, E.G., Simpson, J.R., Xiao, Q., Wu, C., 2011. Million trees Los Angeles canopy cover and benefit assessment. Landsc. Urban Plan. 99, 40–50.
McPherson, G., Simpson, J.R., Peper, P.J., Maco, S.E., Xiao, Q., 2005. Municipal forest benefits and costs in five US cities. J. Forest. 103, 411–416.
National Oceanic and Atmospheric Administration (NOAA) Coastal Services Center. 2012. “Lidar 101: An Introduction to Lidar Technology, Data, and Applications.” Revised. Charleston, SC: NOAA Coastal Services Center.
Nowak, D.J., 1994. Understanding the structure of urban forests. Journal of Forestry. 92:42-46.
Philippine Statistics Authority (PSA). 2010. Urban Barangays in the Philippines (Based on 2010 CPH). https://psa.gov.ph/content/urban-barangays-philippines-based-2010-cph
van Leeuwen, M., Nieuwenhuis, M., 2010. Retrieval of forest structural parameters using LiDAR remote sensing. Eur J. Forest Res. 129: 749–770
Vaze, J., Teng, J., 2007. High resolution LiDAR DEM – How good is it? In Oxley, L. and Kulasiri, D. (eds) MODSIM 2007 International Congress on Modelling and Simulation. Modelling and Simulation Society of Australia and New Zealand, December 2007.
http://www.mssanz.org.au/MODSIM07/papers/12_s27/HighRes olution_s27_Vaze_.pdf
Walton, J.T., Nowak, D.J., Greenfield, E.J., 2008. Assessing urban forest canopy cover using airborne or satellite imagery. Arboriculture and Urban Forestry. 34(6): 334-340.
Wang, K., Franklin, S.E., Guo, X., Cattet, M., 2010. Remote sensing of ecology, biodiversity and conservation: a review from the perspective of remote sensing specialists. Sensors. 10: 9647-9667.
Zhang, C., Qiu, F., 2012. Mapping individual tree species in an urban forest using airborne LiDAR data and hyperspectral imagery. Photogrammetric Engineering and Remote Sensing. 78(10): 1079-1087.