Full Terms & Conditions of access and use can be found at
http://www.tandfonline.com/action/journalInformation?journalCode=cbie20
Download by: [Universitas Maritim Raja Ali Haji] Date: 18 January 2016, At: 21:43
Bulletin of Indonesian Economic Studies
ISSN: 0007-4918 (Print) 1472-7234 (Online) Journal homepage: http://www.tandfonline.com/loi/cbie20
SURVEY OF RECENT DEVELOPMENTS
M. Chatib Basri & Arianto A. Patunru
To cite this article: M. Chatib Basri & Arianto A. Patunru (2006) SURVEY OF RECENT DEVELOPMENTS, Bulletin of Indonesian Economic Studies, 42:3, 295-319, DOI: 10.1080/00074910601053193
To link to this article: http://dx.doi.org/10.1080/00074910601053193
Published online: 23 Nov 2006.
Submit your article to this journal
Article views: 118
View related articles
ISSN 0007-4918 print/ISSN 1472-7234 online/06/030295-25 © 2006 Indonesia Project ANU DOI: 10.1080/00074910601053193
SURVEY OF RECENT DEVELOPMENTS
M. Chatib Basri and Arianto A. Patunru
University of Indonesia, Jakarta
SUMMARY
The growth of Indonesia’s GDP accelerated in the second quarter of 2006, thanks to the buoyant performance of the communications, construction, transport and agri-culture sectors. From the demand perspective, growth was supported by increased government spending and net exports. Macroeconomic stability has continued to improve, and Jakarta’s stock exchange has been out-performing others in the region, refl ecting positive market sentiment in response to stable government, the
improved growth rate, and the steady decline in infl ation and interest rates
With these positive macroeconomic signs and high commodity prices in inter-national markets, a sense of optimism has started to emerge in some sectors, but there are also concerns that economic reform has stalled. The challenge for the government is to balance its political need for short-run ‘wins’ with the impera-tive for long-run macroeconomic stability. Among the ideas for generating a quick win, the ambitious proposal for development of a large-scale bio fuel industry has gained much attention, but it is very unlikely to be a short-term panacea for the problems of high unemployment, poverty and dependence on increasingly costly fossil fuels.
The government has had to deal, once again, with the highly controversial issue of rice imports. The rice import ban imposed by the government last year was the main cause of surging rice prices in 2006. These in turn—not the 2005 fuel price rises, as has often been claimed—were the primary trigger for the signifi cant
increase in poverty reported in September. Removing the rice import ban is there-fore likely to help reduce poverty.
The announcement of a number of policy packages intended to boost lagging investment, particularly in infrastructure, may well refl ect genuine intentions
on the part of the government, but what really matters is implementation. There seems to have been a loss of momentum in this regard for various reasons, includ-ing a lack of capacity in the bureaucracy, and the fact that many offi cials have
a clear incentive to oppose reform. This strongly suggests the need for a major civil service overhaul, extending far beyond the present focus on anti- corruption efforts. The need for such an initiative is also apparent in the failure of the bureauc-racy to prevent or deal adequately with the mud fl ow disaster in Sidoarjo in May.
Reform is also necessary in relation to the legislatures, where delays in enacting or amending key laws often refl ect a pay-off to members from being able to frustrate
governments’ legislative intentions.
cBIEDec06.indb 295
cBIEDec06.indb 295 27/10/06 5:18:58 PM27/10/06 5:18:58 PM
THE POLITICAL AMBIENCE FOR ECONOMIC REFORM
The economy has long since recovered from the severe economic crisis of 1998–99 and is now relatively stable, but there is growing scepticism about the government’s capacity to implement reform. Moreover, decentralisation has created tensions between central government objectives and policies and the roles played by local governments, which have become far more important than previously. The government’s increasingly apparent inability to deliver on its well-publicised reform agenda means that hopes that it could restore economic growth to pre-crisis levels have proven unduly optimistic. In these circumstances managing expectations has become a key issue, as by now public debate seems dominated by pessimism. Good news and stories about government successes hardly ever appear in the media, refl ecting the low level to which confi dence in
the government has fallen. Interestingly, criticism is most often directed at min-isters—particularly those in the economic team—and rarely at the president. This may be because trust in the president, although declining, remains high. Alternatively, critics may only be aiming to bring down particular ministers, rather than the government itself.
Improving macroeconomic stability is easier than implementing micro economic and institutional reform, because the former is in almost everyone’s best inter-est, whereas the latter always faces challenges from groups whose interests are harmed by reform. Moreover, the benefi ts of reform generally materialise in the
medium or long term, while the political cost that potential losers from reform can impose on governments is often immediate.1
In fact, the government has been successful in handling a number of diffi
-cult issues that previous administrations were not able to resolve, including bringing peace to Aceh, settling the dispute with ExxonMobil over the Cepu oil
fi eld (Sen and Steer 2005: 299; Manning and Roesad 2006: 159–60), and fi nding
a way to end the impasse with Cemex over its stake in PT Semen Gresik.2 Yet it has not been able to exploit these success stories so as to convince the public that signifi cant progress is being made. Although commentators concede that
macroeconomic stability has improved, their primary criticism is that this has not resulted in job creation on the scale needed to reduce unemployment and poverty.
Growing public impatience for reform, combined with strong opposition from those who stand to lose from it, has left the president feeling under strong pres-sure to register some ‘quick wins’ in order to gain public trust. The challenge for the economic team, therefore, is to achieve this without jeopardising macro-economic stability. If it fails, there is a risk that pressure for populist macro-economic policies will build, further weakening the government’s commitment to reform.
1 This is broadly in line with comments made by the former coordinating minister for eco-nomic affairs, Aburizal Bakrie (now coordinating minister for welfare), at the Consultative Group on Indonesia (CGI) meeting in Jakarta in January 2005.
2 The long-running Cemex saga (Manning and Roesad 2006: 144–6) drew to a close on 27 July, with the government-approved divestment of Cemex’s 25% stake in PT Semen Gresik Tbk to the Rajawali Group, a conglomerate with interests in hotels, plantations, tobacco and airlines (see Cemex press release dated 27 July 2006, <http://www.cemex.com>).
cBIEDec06.indb 296
cBIEDec06.indb 296 27/10/06 5:18:58 PM27/10/06 5:18:58 PM
Such pressure is likely to generate only inferior quick fi xes aimed at maintaining
public support for the government.
In a retreat at Losari, Central Java, in early July, the president gave a presenta-tion entitled ‘(Post Crisis) New Deal and Bio Energy Acpresenta-tion Plan’, based on the notion that Indonesia needs a major initiative that will create a large number of jobs within a short period. We discuss the bio fuel initiative in detail below; suffi ce
it here to note that it envisions a quick pay-off in terms of reduced unemployment and poverty, without the need to introduce reforms that would generate strong political resistance. But the threat to macroeconomic stability is great. The scale of the proposal is enormous, and it seems potentially more appropriate for deal-ing with long-run rather than short-run objectives. In our view there is no quick
fi x for the unemployment problem; solving it without confronting the politically
painful process of labour market reform will be impossible (Manning and Roesad 2006: 163–9).
GROWTH AND MACROECONOMIC TRENDS Economic growth
Sectoral performance. After declining steadily for fi ve consecutive quarters, GDP
growth rebounded in the second quarter of 2006 to grow by 5.2% year-on-year (y-o-y), up from 4.7% in the previous quarter, and somewhat better than pre-dicted by many observers (table 1). The upturn in growth overall was signifi
-cantly affected by unusually high growth in agriculture, which is unlikely to be sustained.
The expansion in GDP was led by continued astonishingly high growth in com-munications, supported by the construction and transport sectors. The manufac-turing sector continues to disappoint, however. Excluding oil and gas refi ning,
manufacturing’s y-o-y growth rate continued its decline to 3.4%, less than half its level in Q1 2005.3 Much the same is true of trade, hotels and restaurants, the second largest sector after manufacturing.
Recent growth has been consistently lower in the traded goods sector (defi ned
here to comprise agriculture, livestock, forestry and fi sheries; mining and
quarry-ing; and manufacturing) than in non-tradables, to some extent refl ecting the ‘high
cost economy’, including logistics costs (Soesastro and Basri 2005),4 and the shift in the pattern of investment away from tradables into non-tradable goods result-ing from relatively high wages in the modern sector (includresult-ing garments and footwear) (Bird 2004). Among non-tradables, high growth in the transport and communications sectors appears to have been boosted by both deregulation and technological advances in recent years.
3 The 2006 non-oil manufacturing growth rates are considerably lower than the rates of 5–7% p.a. registered for most of the post-crisis period.
4 High logistics costs, particularly related to customs clearance for imports and exports, reduce the profi tability of the tradables sector, especially manufacturing. In its joint study
with the Japan Bank for International Cooperation (JBIC), the Institute for Economic and Social Research at the University of Indonesia (LPEM–FEUI) shows that logistics costs, in-cluding transport costs and weighing station charges, comprise 14% of total production costs (LPEM–FEUI 2005).
cBIEDec06.indb 297
cBIEDec06.indb 297 27/10/06 5:18:58 PM27/10/06 5:18:58 PM
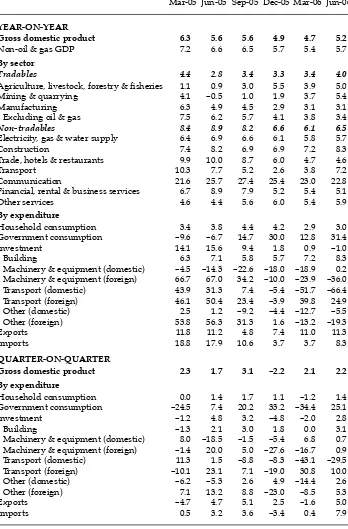
TABLE 1 Components of GDP Growth (2000 prices; % per annum; % per quarter)
Mar-05 Jun-05 Sep-05 Dec-05 Mar-06 Jun-06
YEAR-ON-YEAR
Gross domestic product 6.3 5.6 5.6 4.9 4.7 5.2
Non-oil & gas GDP 7.2 6.6 6.5 5.7 5.4 5.7
By sector
Tradables 4.4 2.8 3.4 3.3 3.4 4.0
Agriculture, livestock, forestry & fi sheries 1.1 0.9 3.0 5.5 3.9 5.0
Mining & quarrying 4.1 –0.5 1.0 1.9 3.7 5.4
Manufacturing 6.3 4.9 4.5 2.9 3.1 3.1
Excluding oil & gas 7.5 6.2 5.7 4.1 3.8 3.4
Non-tradables 8.4 8.9 8.2 6.6 6.1 6.5
Electricity, gas & water supply 6.4 6.9 6.6 6.1 5.8 5.7
Construction 7.4 8.2 6.9 6.9 7.2 8.3
Trade, hotels & restaurants 9.9 10.0 8.7 6.0 4.7 4.6
Transport 10.3 7.7 5.2 2.6 3.8 7.2
Communication 21.6 25.7 27.4 25.4 23.0 22.8
Financial, rental & business services 6.7 8.9 7.9 5.2 5.4 5.1
Other services 4.6 4.4 5.6 6.0 5.4 5.9
By expenditure
Household consumption 3.4 3.8 4.4 4.2 2.9 3.0
Government consumption –9.6 –6.7 14.7 30.0 12.8 31.4
Investment 14.1 15.6 9.4 1.8 0.9 –1.0
Building 6.3 7.1 5.8 5.7 7.2 8.3
Machinery & equipment (domestic) –4.5 –14.3 –22.6 –18.0 –18.9 0.2 Machinery & equipment (foreign) 66.7 67.0 34.2 –10.0 –23.9 –36.0
Transport (domestic) 43.9 31.3 7.4 –5.4 –51.7 –66.4
Transport (foreign) 46.1 50.4 23.4 –3.9 39.8 24.9
Other (domestic) 2.5 1.2 –9.2 –4.4 –12.7 –5.5
Other (foreign) 53.8 56.3 31.3 1.6 –13.2 –19.3
Exports 11.8 11.2 4.8 7.4 11.0 11.3
Imports 18.8 17.9 10.6 3.7 3.7 8.3
QUARTER-ON-QUARTER
Gross domestic product 2.3 1.7 3.1 –2.2 2.1 2.2 By expenditure
Household consumption 0.0 1.4 1.7 1.1 –1.2 1.4
Government consumption –24.5 7.4 20.2 33.2 –34.4 25.1
Investment –1.2 4.8 3.2 –4.8 –2.0 2.8
Building –1.3 2.1 3.0 1.8 0.0 3.1
Machinery & equipment (domestic) 8.0 –18.5 –1.5 –5.4 6.8 0.7 Machinery & equipment (foreign) –1.4 20.0 5.0 –27.6 –16.7 0.9
Transport (domestic) 11.3 1.5 –8.8 –8.3 –43.1 –29.5
Transport (foreign) –10.1 23.1 7.1 –19.0 30.8 10.0
Other (domestic) –6.2 –5.3 2.6 4.9 –14.4 2.6
cBIEDec06.indb 298 27/10/06 5:18:59 PM27/10/06 5:18:59 PM
Expenditure. On the expenditure side of the national income accounts, eco-nomic growth continues to depend heavily on consumption spending by gov-ernments, and on exports—thanks to high commodity prices in international markets. Household consumption has been growing only slowly for some time now, and it is of particular concern that the growth of investment spending has declined so far as to become negative (y-o-y) in the June quarter.
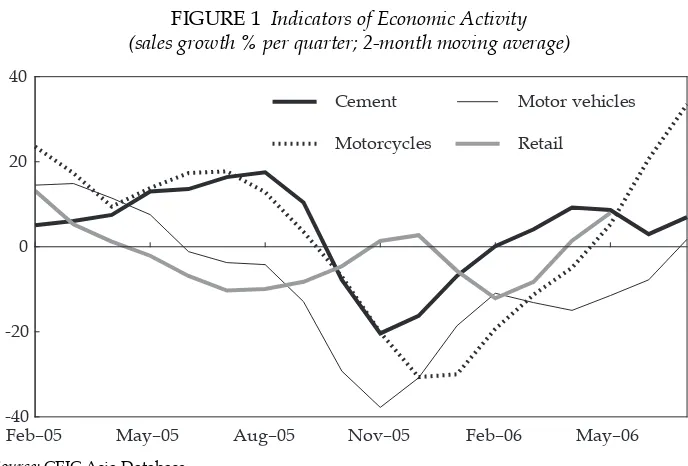
(a) Consumption. Household consumption grew by 3.0% (y-o-y) in Q2 2006, much the same as in Q1, and by 1.4% quarter-on-quarter (q-o-q). The rebound evident in the q-o-q fi gure, and in the index of retail sales (fi gure 1), may be a
consequence of declining infl ation. According to De Gregorio, Guidotti and Vegh
(1997), an initial fall in infl ation generates a positive wealth effect that induces
consumers to bring forward their purchases of non-food items, including durable goods (and conversely). The fuel price hikes in October 2005 clearly induced con-sumers to rationalise their demand for motor vehicles and motorcycles, but this effect has been reversed as the infl ation surge recedes (fi gure 1).5 Consistent with this argument, the growth of household consumption in Q2 was driven mainly by non-food consumption (not shown), which accelerated from –1.5% in Q1 2006 to 1.8% (q-o-q) in Q2.
Government consumption has been growing strongly in y-o-y terms over the last year. It grew extraordinarily rapidly, q-o-q, in Q2 2006, in strong contrast to the even more drastic decline in Q1. Despite the relatively small contribution of
5 Disaggregated data on purchases by model of motor vehicle (not presented here) also show that buyers shifted their preference toward cheaper and low energy cars. Major com-panies like Astra are increasing their production capacity in anticipation of further recov-ery in motorcycle sales (interview with Tossin Himawan, director of Astra International).
FIGURE 1 Indicators of Economic Activity (sales growth % per quarter; 2-month moving average)
Feb–05 May–05 Aug–05 Nov–05 Feb–06 May–06 -40
-20 0 20 40
Cement Motorcycles
Motor vehicles Retail
Source: CEIC Asia Database.
cBIEDec06.indb 299
cBIEDec06.indb 299 27/10/06 5:19:00 PM27/10/06 5:19:00 PM
government consumption to aggregate demand, this surge clearly provided a sig-nifi cant impetus to economic growth in the second quarter. These wild quarterly
gyrations seem to refl ect the diffi culty the bureaucracy has in spending money
early in the fi scal year, and the corresponding rush to spend allocated amounts
toward the end. Thus government expenditure for 2006 is still far below budget. From January to August 2006, actual central government routine expenditure amounted to only 37% of the budgeted amount, and for capital expenditure the
fi gure was only 31%: in broad terms, only one-third of the budget had been spent
during the fi rst two-thirds of the year. As noted by Manning and Roesad (2006:
154), much remains to be done to raise effi ciency on the expenditure side of
budg-etary operations.
(b) Investment. In contrast to the mild slowing of y-o-y household consump-tion growth over the last four quarters, investment growth has declined dramati-cally, becoming negative in Q2 2006. But the q-o-q picture is less bleak, with a return to positive growth in Q2. Building (construction) is buoyant, as suggested by fairly rapid growth in sales of cement (fi gure 1), while no clear pattern emerges
in relation to growth of other components of investment. Despite the slowdown of investment growth during the fi rst half of 2006, investment seems likely to
increase in the second half, given strong positive growth of capital goods imports (25%) from July to August 2006. Normally there is a lag of about three months before imported capital goods turn into investment; on this basis we expect invest-ment to begin to pick up by the last quarter of 2006.
According to the Investment Coordinating Board (BKPM), foreign direct investment (FDI) realisations reached $4.29 billion, spread over 702 projects, for the period January–September 2006; this constituted a 44% decline in value rela-tive to the same period in 2005 (BKPM 2006). It appears to represent a signifi cant
loss of momentum, since FDI approvals last year were 94% higher in value than in 2004. On the other hand, this year’s approved FDI projects are forecast to cre-ate 179,000 jobs, compared with only 119,000 for the same period last year. It is diffi cult to interpret these data, however, since BKPM is now—in the
deregula-tion era—obliged to rely on reports from provincial and local governments to some extent.
The total value of domestic investment approvals for the fi rst eight months of
2006 was Rp 11.8 trillion (about $1.3 billion at an exchange rate of Rp 9,000/$)— a 7% increase over the same period in 2005—spread over 113 projects. The number of jobs forecast to be created is 44,000, compared with 71,000 last year. These fi gures are even less meaningful than those for FDI, however, since it is
not compulsory for domestic fi rms to obtain BKPM approval for their
invest-ments. This is the main reason why the value of domestic approvals is only about one-third that of foreign approvals—in reality, domestic investment far exceeds foreign investment.
(c) Imports and exports. Export growth has recovered to the fairly high level of 11.3% (y-o-y, in constant price rupiah terms), similar to the rates recorded in the
fi rst half of 2005, whereas import growth has shown a quite different pattern—
falling from very high rates in early 2005 to rates well below export growth rates for the last three quarters shown in table 1.
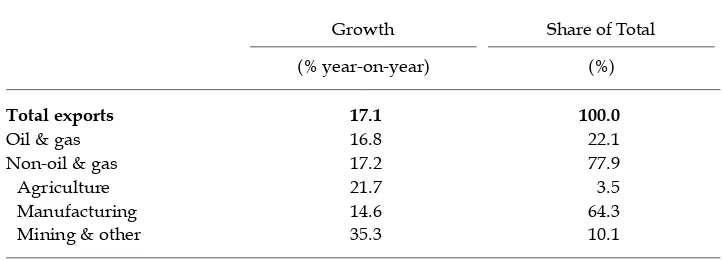
Merchandise exports performed very well in the fi rst eight months of 2006
(table 2). Dollar values for this period were well up on the corresponding period
cBIEDec06.indb 300
cBIEDec06.indb 300 27/10/06 5:19:00 PM27/10/06 5:19:00 PM
in 2005, with all major categories making strong contributions. Oil and gas, agriculture and mining all benefi ted from high commodity prices (Athukorala
2006). More than 63% of the increase in non-oil exports during this period was accounted for by resource commodities, including rubber and rubber products; mineral fuels; copper; and animal and plant oils and fats. The growth of manu-facturing exports, which comprise nearly two-thirds of total exports, was not as rapid, and was driven mainly by the paper and cardboard sub-sector. The fact that recent export performance is largely a refl ection of increased commodity
prices raises questions about sustainability. On the other hand, the commodities boom has much to do with China’s rapid economic progress, which shows no sign of slackening.
Financial markets
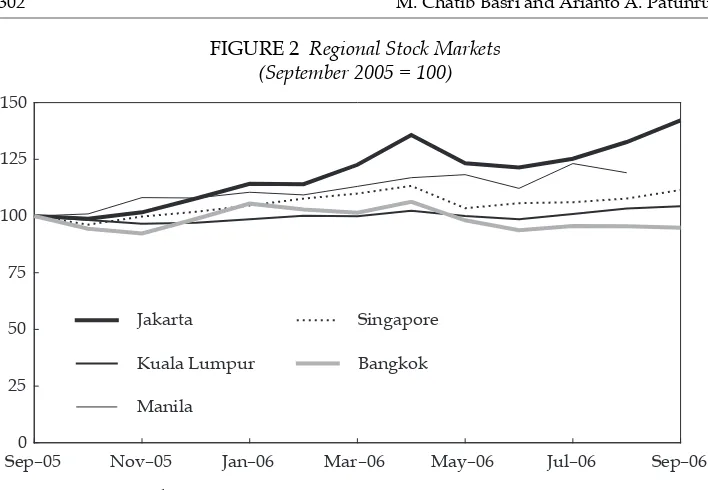
The capital market. The Jakarta Stock Exchange (JSX) index resumed its rapid ascent during the third quarter of 2006. It considerably out-performed other exchanges in the region in the year to September, increasing by some 42% (fi
g-ure 2). Positive sentiment in the market appears to have been generated by sta-ble government, the improved economic growth rate and the steady decline in infl ation.
In addition, the government bond market is becoming deeper and more active. The average monthly volume of trading in 2006 is higher than in 2004 (previously the most active year on record). The investor base is becoming less skewed, with the proportion of bonds owned by foreigners increasing dramatically from 2.7% in December 2004 to 13.4% by July 2006 (MOF 2006a).6 These developments would appear to refl ect the pay-off to sound fi scal and debt management. The
yield curve on government bonds has been shifting downwards in line with the steady reduction in the central bank’s interest rates; the relatively low rate even
6 Previously almost all government bonds were held by banks as a result of their recapi-talisation by the government in 1998–99.
TABLE 2 Merchandise Export Growth and Composition (January–August 2006; $)
Growth Share of Total
(% year-on-year) (%)
Total exports 17.1 100.0
Oil & gas 16.8 22.1
Non-oil & gas 17.2 77.9
Agriculture 21.7 3.5
Manufacturing 14.6 64.3
Mining & other 35.3 10.1
Source: BPS.
cBIEDec06.indb 301
cBIEDec06.indb 301 27/10/06 5:19:01 PM27/10/06 5:19:01 PM
on 20-year bonds indicates considerable market confi dence in Indonesia’s
long-term prospects.
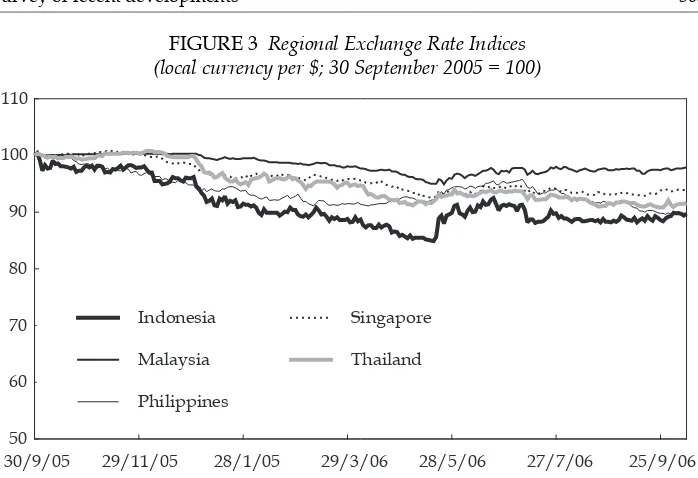
The foreign exchange market. Notwithstanding its sudden weakening in May (Manning and Roesad 2006: 150), Indonesia’s currency has been stronger than those of its neighbours (with the partial exception of the Philippines peso) in the year to September, having been relatively stable since mid-May (fi gure 3). Factors
that help to explain the rupiah’s recent strength include net capital fl ow resulting
from the relatively high differential between domestic and international interest rates, the favourable terms of trade fl owing from booming commodity prices, and
a generally high level of satisfaction among domestic and global investors with the government’s performance. Performance of the JSX index closely mirrors that of the rupiah, refl ecting the important role of portfolio investment in infl
uenc-ing the exchange rate: when investor confi dence declines, the stock market index
falls under selling pressure, and the rupiah depreciates as funds are shifted off-shore—and conversely.
Infl ation and monetary policy
Although the y-o-y infl ation rate was still as high as 14.6% in September 2006
(fi gure 4), this fi gure was highly distorted by the fuel price surge in October 2005;
infl ation has declined fairly steadily since then, such that the annualised rate
over the last 11 months is only 5.9%, which is quite low by Indonesia’s rather soft standards (Fane 2005). We tend to believe that the success of Bank Indonesia (BI) in keeping money supply growth relatively modest has been a major determinant of this outcome. Given the recent trend in infl ation, together with the
govern-ment’s decision to open up rice imports (see below), we consider that BI’s infl
a-tion target of less than 8% in 2006 can easily be achieved. Having said that, the central bank’s eagerness to bring interest rates down is keeping money supply
FIGURE 2 Regional Stock Markets (September 2005 = 100)
Sep–050 Nov–05 Jan–06 Mar–06 May–06 Jul–06 Sep–06 25
50 75 100 125 150
Jakarta Kuala Lumpur Manila
Singapore Bangkok
Source: CEIC Asia Database.
cBIEDec06.indb 302
cBIEDec06.indb 302 27/10/06 5:19:01 PM27/10/06 5:19:01 PM
growth rates somewhat higher than is consistent with infl ation at the target level.
BI cut its policy rate by 50 basis points in August, September and October 2006, taking this rate down to 10.75% in October compared with 12.5% in May 2006. As a result of this steady downward pressure on rates, cash in circulation has grown at an average 14.8% p.a. from January through August (fi gure 4).
50 60 70 80 90 100 110
Indonesia Malaysia Philippines
Singapore Thailand
30/9/05 29/11/05 28/1/05 29/3/06 28/5/06 27/7/06 25/9/06
FIGURE 3 Regional Exchange Rate Indices (local currency per $; 30 September 2005 = 100)
Source: Pacifi c Exchange Rate Service.
FIGURE 4 Rates of Infl ation, Interest and Money Supply Growtha (% p.a.)
Oct–050 Dec–05 Feb–06 Apr–06 Jun–06 Aug–06 5
10 15 20 25 30 35
CPI
Currency in circulation SBI 30-day rate
a CPI: consumer price index; SBI: Bank Indonesia Certifi cate.
Source: CEIC Asia Database.
cBIEDec06.indb 303
cBIEDec06.indb 303 27/10/06 5:19:02 PM27/10/06 5:19:02 PM
Although the central bank’s policy rate has been declining over the last few months, commercial bank lending rates have changed very little during 2006. As a result, the hoped for impact on the real sector of reductions in the policy rate has yet to emerge: indeed, the rate of growth of bank lending has declined stead-ily since September 2005. For this reason alone there seems little point in pushing interest rates down too quickly. Nor is it helpful to blame banks for their reluc-tance to lend. Lending outcomes depend not only on supply but also on demand, and the latter is undoubtedly impeded by heavy government intervention in the labour market, an extortive bureaucracy, and poor security and enforcement of contracts—all of which constrain fi rms’ willingness to undertake investment, and
create risks for banks that lend to fi rms that do choose to invest.
In summary, macroeconomic stability continues to be maintained and there are some signs that growth is starting to pick up. With positive macroeconomic signs and high commodity prices in international markets, a sense of optimism has started to be felt in some sectors. But although there is signifi cant capital infl ow,
this appears to be limited mainly to portfolio investment, and has had no major impact on investment spending. Indeed, the government needs to stay alert to the possibility of a reversal of capital infl ow if Indonesia should experience some
unexpected economic or political shock. Thus far, however, it has been able to maintain political stability, and the markets seem to have become less sensitive to political issues, including the second Bali bombing in 2005.
THE BUDGET
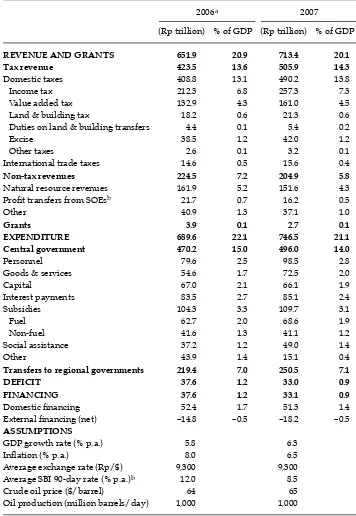
The budget for 2007, presented by the president to the parliament (DPR) on 16 August, assumes economic growth of 6.3% next year, which is in line with the latest World Bank projection of 6.2% (table 3). Respected economic commentators such as Faisal Basri and Hadi Soesastro have also argued that the growth assumption is realistic, given the current state of the economy (JP, 18/8/06). Others have con-tended that this assumption is a little too optimistic but, given the possibility of continued economic rebound in the second half of 2006, we too consider that the economy will grow by more than 6% next year. The budget defi cit as a proportion
of GDP is projected to diminish from 1.2% in the revised budget for 2006 to 0.9% in 2007. The markets seem to regard the budget overall as satisfactory, as is refl ected in
the stable exchange rate and the rising stock market.
The infl ation rate of the CPI is projected at 6.5% for 2007—within BI’s target
range of 6.0 ± 1%, but a little higher than the mid-point. This suggests a slight lack of confi dence on the part of the government in the central bank’s ability to keep
infl ation on its recent downward trend, considering that it is already a little below
6% (setting aside the one-off effect of increased fuel prices in October 2005), and that global infl ation is relatively low. The interest rate on BI’s 3-month certifi cates
(SBIs) is projected to average 8.5% p.a.This target should be considered aggres-sive, because the SBI rate will probably still be around 10.5% by the end of 2006; in turn, this implies that BI will need to cut the interest rate to well below 8.5% for some part of next year. Moreover, these two targets together imply a real interest rate of only 2% on average during 2007, which seems too low to be plausible. This naturally raises the possibility of exchange rate weakening and a resurgence of infl ation if BI becomes too aggressive in reducing nominal rates.
cBIEDec06.indb 304
cBIEDec06.indb 304 27/10/06 5:19:02 PM27/10/06 5:19:02 PM
TABLE 3 Approved Budget 2006 and 2007 Budget
2006a 2007
(Rp trillion) % of GDP (Rp trillion) % of GDP
REVENUE AND GRANTS 651.9 20.9 713.4 20.1 Tax revenue 423.5 13.6 505.9 14.3
Domestic taxes 408.8 13.1 490.2 13.8
Income tax 212.3 6.8 257.3 7.3
Value added tax 132.9 4.3 161.0 4.5
Land & building tax 18.2 0.6 21.3 0.6
Duties on land & building transfers 4.4 0.1 5.4 0.2
Excise 38.5 1.2 42.0 1.2
Other taxes 2.6 0.1 3.2 0.1
International trade taxes 14.6 0.5 15.6 0.4
Non-tax revenues 224.5 7.2 204.9 5.8
Natural resource revenues 161.9 5.2 151.6 4.3
Profi t transfers from SOEsb 21.7 0.7 16.2 0.5
Other 40.9 1.3 37.1 1.0
Grants 3.9 0.1 2.7 0.1
EXPENDITURE 689.6 22.1 746.5 21.1 Central government 470.2 15.0 496.0 14.0
Personnel 79.6 2.5 98.5 2.8
Goods & services 54.6 1.7 72.5 2.0
Capital 67.0 2.1 66.1 1.9
Interest payments 83.5 2.7 85.1 2.4
Subsidies 104.3 3.3 109.7 3.1
Fuel 62.7 2.0 68.6 1.9
Non-fuel 41.6 1.3 41.1 1.2
Social assistance 37.2 1.2 49.0 1.4
Other 43.9 1.4 15.1 0.4
Transfers to regional governments 219.4 7.0 250.5 7.1
DEFICIT 37.6 1.2 33.0 0.9
FINANCING 37.6 1.2 33.1 0.9
Domestic fi nancing 52.4 1.7 51.3 1.4
External fi nancing (net) –14.8 –0.5 –18.2 –0.5
ASSUMPTIONS
GDP growth rate (% p.a.) 5.8 6.3
Infl ation (% p.a.) 8.0 6.5
Average exchange rate (Rp/$) 9,300 9,300
Average SBI 90-day rate (% p.a.)b 12.0 8.5
Crude oil price ($/barrel) 64 65
Oil production (million barrels/day) 1,000 1,000
a Revised.
b SOE: state-owned enterprise; SBI: Bank Indonesia Certifi cate.
Source: MOF (2006b).
cBIEDec06.indb 305
cBIEDec06.indb 305 27/10/06 5:19:02 PM27/10/06 5:19:02 PM
The budget assumes an average oil price of $65/barrel which, although lower than the August 2006 price of $73/barrel, is not too different from prices recorded in October. Since current oil prices are somewhat below those assumed for 2007, this seems an ideal time for the government to shift to a policy of allowing domestic prices to move in tandem with international prices, thus taking fuel price adjustments out of the political arena.
A key issue is the impact of the oil price on the budget defi cit. According to
the Ministry of Finance (MOF), a rise in the oil price of $1/barrel in 2007 would increase revenue by Rp 3.8 trillion, whereas it would also lead to an additional Rp 4.4 trillion in outlays on fuel and electricity subsidies, revenue sharing and general allocation fund (DAU) transfers to the regions—thus increasing the defi cit
slightly, by Rp 0.6 trillion (or 0.02% of GDP). It is worth noting, however, that the total DAU amount is fi xed upon approval of the budget by the DPR, so if the oil
price increases subsequently this would in fact reduce the defi cit slightly, by Rp 0.2
trillion (MOF 2006b).
Table3 shows some key aspects of the 2007 budget:
• domestic tax revenues are projected to increase from 13.1% of GDP in 2006 to 13.8% in 2007, driven mainly by increased income tax and VAT collections; • although total revenue increases from Rp 651.9 trillion to Rp 713.4 trillion, as a
proportion of GDP it declines from 20.9% in 2006 to 20.1% in 2007;
• likewise, while total expenditure increases from Rp 689.6 trillion to Rp 746.5 trillion, it falls from 22.1% of GDP in 2006 to 21.1% in 2007.
Expenditure on personnel increases from 2.5% to 2.8% of GDP as a result of rises in base salaries, annual bonuses and various allowances, and salary payments to new civil servants, military and police personnel and health service providers. Increased rates of pay are intended to improve the performance of the bureauc-racy, but this outcome is unlikely in the absence of complementary reforms (Syn-nerstrom 2006).
Capital expenditures decline from 2.1% to 1.9% of GDP, but this partly refl ects
the fact that some of the amount budgeted for 2005 was not spent, and so was car-ried over to 2006. If there is a recurrence of this problem in 2006, as seems likely, the effect would be to reduce the former fi gure and increase the latter, so capital
expenditures in both years would be about the same.
THE BIO FUEL ‘NEW DEAL’
Since January 2006 the government has been giving considerable attention to Presidential Instruction No. 1/2006, strongly encouraging the production and use of bio fuels (GOI 2006a). The term ‘bio fuel’ refers to fuel manufactured from plants: for example, bio diesel can be produced from jatropha or oil palm, and bio ethanol from sugarcane molasses or cassava. As a country blessed with fertile soil, it is easy to see Indonesia as a natural choice for producing bio fuels. This, together with the president’s concern with soaring global oil prices and high levels of unemployment and poverty,led him to call for Indonesia to embark on a massive bio fuel production project—extending over millions of hectares and employing millions of workers. The parallel with former US President Roosevelt’s ‘New Deal’ in the 1930s—massive government spending
cBIEDec06.indb 306
cBIEDec06.indb 306 27/10/06 5:19:03 PM27/10/06 5:19:03 PM
to boost aggregate demand and employment—was immediately seized upon by the media (Kompas, 19/6/2006).
Others were quick to voice their support for the proposal, including the minis-ter of research and technology, Kusmayanto Kadiman, and the head of the Green Energy Society (Masyarakat Energi Hijau Indonesia), Al Hilal Hamdi. According to Hamdi, the country is capable of converting 6 million hectares of land to bio fuel production (based on oil palm) within fi ve years. He claimed that this would
allow the production of 22.5 million kilolitres of bio fuel over a fi ve-year period,
and the creation of 3–5 million jobs (Kontan, 24/7/2006). For his part, Minister Kadiman has suggested banning crude palm oil exports and instead using the industry to support bio diesel production (Kontan, 15/5/2006). In similar vein, the minister of industry, Fahmi Idris, has called for a ban on sugarcane molasses exports, so that this product can be used as an input to bio ethanol production.7 The state-owned oil company, Pertamina, has also jumped on the bio fuel band-wagon, and was reported in June to be selling a bio diesel blend at four of its retail outlets in Jakarta (Khalik 2006). The president appears so confi dent of the
desir-ability of this initiative that the government is reported to have earmarked no less than Rp 13 trillion for bio fuel development next year (Hudiono 2006), even though the 2007 budget provides for only Rp 1 trillion.
We are wary of this proposal, however. Simple technological calculations of how much land can be converted, how many trees planted, how many workers employed and how much energy produced fall far short of the kind of careful eco-nomic analysis that should form the basis for such far-reaching policy decisions. Broadly speaking, if the cost of producing bio fuel exceeds the price of an equivalent quantity of conventional fuel on the world market, Indonesia will lose by imple-menting this proposal. If bio fuel production is economically viable there will be no need to ban exports of palm oil or molasses, since the bio fuel industry will be able to purchase these inputs at world prices. Any policy that forces the diversion of a healthy export-oriented activity to a domestically oriented purpose will harm the former, and will do nothing to increase employment or reduce poverty.
That bio fuel production is not economically viable is suggested by a joint study by researchers from Cornell University and the University of California, Berkeley, the starting point for which is the observation that production of bio diesel and bio ethanol also requires considerable quantities of energy as an input. The researchers found that fuels produced from various kinds of biomass in fact use signifi cantly more energy in their production than is contained in the bio
etha-nol or bio diesel produced (Pimentel and Patzek2005)—a phenomenon referred to as ‘negative energy return’. In addition, the need to clear vast tracts of land to support a bio fuel industry would lead to complicated land ownership and forest conversion issues, cause a signifi cant loss of biodiversity and exacerbate existing
severe smoke pollution problems resulting from the clearing of forests by burn-ing. In spite of such concerns, however, some countries are indeed already rapidly moving in the direction of large-scale bio fuel production.
7 A similar campaign is also evident in Australia, where the sugar cane grower lobby is seeking to boost demand for ethanol by pushing for its compulsory inclusion in domesti-cally consumed petrol (Koch 2006).
cBIEDec06.indb 307
cBIEDec06.indb 307 27/10/06 5:19:04 PM27/10/06 5:19:04 PM
We are aware of one study arguing that the development of bio fuels might be benefi cial to the poor (Hazell and Von Braun 2006), but we are unconvinced
by this, and remain sceptical that the bio fuel initiative would have a signifi cant
impact on Indonesia’s unemployment (and, through this, on poverty), in the man-ner of the ‘New Deal’. Indonesia’s stubbornly high unemployment appears more likely to be the consequence of signifi cant rigidities in the labour market
(Man-ning and Roesad 2006: 167–8) than of any lack of aggregate demand, in which case the generation of jobs in a bio fuel industry would be more likely to draw work-ers out of other sectors than to reduce the number of unemployed. We have little doubt that a far more effective approach to increasing the availability of modern sector jobs and reducing poverty is to carry through the implementation of stalled labour market reforms. Unfortunately, however, after a process of deliberation involving academics from fi ve of Indonesia’s top universities, the government
has decided to drop its bid to reform the employment laws (Kompas, 14/9/2006). In short, the bio fuel proposal now being pushed by various players appears to be nothing more than a leap of faith, and is highly unlikely in the short run to be a panacea for increasingly costly fossil fuels, high unemployment and poverty. It makes much more sense to allow the future of the bio fuel industry to be deter-mined by the market, without distortionary intervention by the government. It should be up to fi rms in the private sector to decide whether this new industry
is commercially viable. Thus far, private sector responses have varied. PT Astra Agro Lestari and PT Perusahaan Perkebunan London Sumatra Indonesia, the two largest agricultural companies in the country, are still reluctant to invest in palm oil bio diesel. In contrast, PT Bakrie Sumatera Plantations has stated its intention to invest $25 million in the industry (JP, 13/9/2006).
POVERTY AND RICE IMPORTS Poverty incidence increases
In his State of the Nation address before the parliament on 16 August, the president pointed out that Indonesia’s poverty incidence had declined from 23.4% in 1999 to 16% in 2005. This statement immediately triggered strong reactions from a group of economists known as Tim Indonesia Bangkit (TIB, the ‘Arise Indonesia’ Team) and some politicians, who argued that the level of poverty had risen in 2006 as a conse-quence of the large fuel price increases in 2005, and that the government was trying to mislead the public by referring only to the now well out-of-date poverty fi gure
for February 2005. The minister for national development planning, Paskah Suzetta, asserted that there was no attempt by the government to manipulate the data: the
fi gure presented by the president, published by the central statistics agency (BPS) in
September 2005, was the most recent available to him.
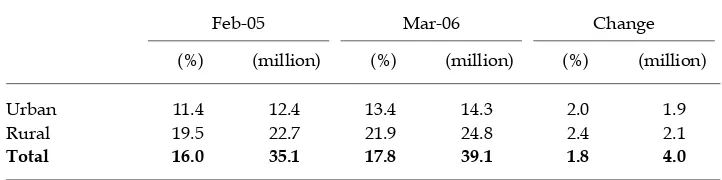
However, on 1 September 2006, just two weeks after the State of the Nation address, BPS announced that the number of people living below the poverty line had indeed risen by 4 million, from 35.1 million in February 2005 to 39.1 million in March 2006—an increase from 16% to 17.8% of the population (table 4).8 TIB’s assertion that poverty had increased since the previous data had been released
8 The proportional increase was somewhat higher in rural than in urban areas.
cBIEDec06.indb 308
cBIEDec06.indb 308 27/10/06 5:19:04 PM27/10/06 5:19:04 PM
was thus proven correct, although its estimate of 22% poverty in March 2006 was highly inaccurate. (Its explanation of the cause of the poverty increase also seems invalid, as we explain below.) BPS pointed out that signifi cant numbers of those
living above the poverty line in February 2005 had fallen into poverty by March 2006, including 30.3% of those previously categorised as ‘near poor’, 11.8% of the ‘near non-poor’ and 2.3% of the ‘non-poor’.9 During the same period, 43.5% of those previously below the poverty line had moved above it, including 19.4% who became near poor, 17.7% near non-poor, and 6.5% non-poor. These fi gures
refl ect the fact that there are many people living close to the poverty line, so that
a slight increase in prices (relative to nominal earnings) would cause a signifi cant
number to fall below it.
The poverty line is strongly infl uenced by the prices of food items, among which
rice dominates. The price of rice increased by no less than 33% from February 2005 to March 2006 (Mallarangeng et al. 2006). Since more than three-quarters of the poor are net consumers of rice (World Bank 2004), the rice price increase must be expected on average to have hurt the poor (Basri, Panennungi and Nurridzki 2004). A simple estimation by the World Bank (forthcoming) suggests that the rise in the relative price of rice by 16.5% (33% minus an average 16.5% increase in the prices of other foods) could be expected to raise the number living in poverty by about 3.1 million. On this basis it can be argued that around 77% of the rise in the number of poor during the period in question was accounted for by the increasing price of rice (as distinct from rising fuel prices, which TIB had emphasised).
This still leaves open the question of whether the rice price itself may have risen so dramatically as a result of fuel price hikes, or international rice price increases, or other factors. The fuel price hikes presumably cannot be blamed, since the prices of other foods increased by only half as much as that of rice dur-ing the period in question; in addition, international rice prices were more or less stable. We argue, therefore, that the surge in rice prices was mainly a consequence of the rice import ban imposed by the government in late 2005. Contrary to its stated intent, this policy has hurt the poor signifi cantly.
9 The expenditure ranges used to defi ne near poor, near non-poor and non-poor are
100–125%, 125–150% and greater than 150% of the poverty line, respectively.
TABLE 4 Poverty Incidence
Feb-05 Mar-06 Change
(%) (million) (%) (million) (%) (million)
Urban 11.4 12.4 13.4 14.3 2.0 1.9
Rural 19.5 22.7 21.9 24.8 2.4 2.1
Total 16.0 35.1 17.8 39.1 1.8 4.0
Source: BPS.
cBIEDec06.indb 309
cBIEDec06.indb 309 27/10/06 5:19:04 PM27/10/06 5:19:04 PM
The rice import fi asco, once again
The government has two objectives in relation to rice. First, it wishes to maintain a national stockpile of rice amounting to 1 million tons on average (curiously referred to as the ‘iron stock’, stok besi), in order to be able to deal with disasters and social welfare requirements such as the rice-for-the-poor (beras untuk orang miskin, or raskin) program. Second, it wants to buy for, and sell from, this stock-pile in order to stabilise the domestic price at levels considered reasonable for both producers and consumers.10 In its 2006 budget, however, the government allowed for maintenance of a stock of only 350,000 tons this year, well below the ‘iron stock’ level—presumably because of budget stringency. But much of the pre-vious limited stock has been used up in helping the victims of natural disasters: 127,400 tons had been consumed through August, 60% of which went to disas-ter areas. Having assessed its current stock of rice and estimated likely releases needed for price-stabilising market operations and for emergency purposes dur-ing the remainder of the year, the government has decided to import 210,000 tons of rice in order to keep to the budgeted 350,000-ton stock level. As has been the case in the past (see, for example, Ray 2003; MacIntyre and Resosudarmo 2003), this has created much controversy, with strong opposition to the decision voiced by the Indonesian Farmers Association (Himpunan Kerukunan Tani Indonesia, HKTI), members of the legislatures, and several NGOs, as well as independent observers.
The government’s advisers in the bureaucracy seem not to have learned much from past experience in this area. Rice imports are fi nanced through the
budget, so the government presumably plans its import policy before submitting its budget to the DPR. Yet this rice import controversy repeats itself every year, such that the decision to import rice appears as an ad hoc, unplanned policy. It is equally surprising that some members of the DPR have opposed the rice import policy as though it is something new and undesirable, rather than a contingency of which they should have been aware beforehand through their deliberations on the budget. It has always been intended that purchases to maintain an adequate ‘iron stock’ would be fi nanced through the budget, ever since the development of
this concept around 2004 (Indonesian Food Policy Program 2004); that is, the rice-related item in the budget refl ects the rice-for-the-poor program and the policy of
maintaining an ‘iron stock’. But there has been a failure to explain adequately the need to have a contingency plan that allows the allocation of additional budget funds to import rice should the stock fall below a safe level—whether because of natural disasters or from other causes. It is faintly amusing to see ministers force-fully defending the decision to import rice yet again each time this policy needs to be implemented.11 A campaign to inform the public about this issue might save them a good deal of energy.
10 Vice President Jusuf Kalla asserted recently that the desirable stable price range is Rp 4,200–4,300 per kilogram (Kompas, 2/9/2006).
11 Nonetheless, it has usually been the case that not all ministers support the policy, with the ministers of agriculture and trade typically diametrically opposed to each other. This year, however, the minister of agriculture appears less strongly opposed to rice imports than in the past.
cBIEDec06.indb 310
cBIEDec06.indb 310 27/10/06 5:19:05 PM27/10/06 5:19:05 PM
It is also of interest to note that, in their attempts to defend the rice import pol-icy, government offi cials often make misleading or illogical statements. For
exam-ple, the government claims that the imported rice will not affect the domestic rice price, but this obviously contradicts the stated objective of the policy itself, which is precisely to stabilise prices! Players in the market understand this, and make their own adjustments as soon as the intention to import is announced. Knowing that demand for market-sourced rice will decrease because consumers will be supplied by the government (through the logistics agency, Bulog), they decrease their buying price even before the import policy becomes effective.12 While gov-ernment spokesmen earnestly proclaim that the imported rice will go directly to Bulog’s warehouses, traders know that the purpose of having the stockpile is pre-cisely to push prices down if they become too high, and to provide a supply of heavily subsidised rice to the poor and those stricken by natural disasters.
No matter how sensible the economic rationale behind the decision to import rice, political interests always create obstacles to its implementation. Organisa-tions that claim to represent farmers, such as HKTI, campaign forcefully against any rice imports. The association’s chairman has repeatedly argued that ‘farm-ers should have the right to enjoy high prices, as other elements of the society have been enjoying their own [rises] in one way or another’, but of course this is empty rhetoric. Most of Indonesia’s farmers are landless peasants who work in the paddy fi elds and have to buy rice for their own consumption; for them,
higher rice prices are a burden, not a blessing. Higher prices benefi t only absentee
landlords and richer farmers who work their own land, not those at the bottom of the income distribution. While it may be true that higher prices lead to increased farm employment as rice output expands in response, a study by Warr (2005) has shown that, even after taking the employment effect into account, a rice import ban would still increase the incidence of poverty, for the reason outlined above.
It appears that the government still intends to rely on Bulog to manage the rice stock and stabilise prices. Yet Bulog’s effectiveness appears to have been stagnant, if not declining (Arifi n 2005). Indeed, some studies have shown that rice prices
were more stable when Bulog’s import monopoly was removed during the period 1999–2002. The government’s decision that Bulog will have to use rice importers chosen through an open bidding process is to be applauded.
THE LAPINDO AFFAIR
On 29 May 2006, an exploratory gas well in Sidoarjo, East Java, blew out, result-ing in a hot mudfl ow that quickly fl ooded the surrounding area. By the second
week of September more than 10,000 people had been affected. The response from the well operator and the government was frustratingly slow, such that mud was still fl owing at the rate of 50,000 cubic metres per day by mid-October, with no
end to the disaster in sight. According to an expert from the Bandung Institute of Technology, there are on average 400–500 such wells drilled each year in Indo-nesia, and there have been 17 incidents of this kind—of varying degrees of sever-ity—in the last 35 years (Rubiandini 2006). Given the high probability of drilling
12 See Kontan’s interview with a rice seller (Kontan, 11/9/2006).
cBIEDec06.indb 311
cBIEDec06.indb 311 27/10/06 5:19:05 PM27/10/06 5:19:05 PM
accidents, the government’s inability to deal effectively with the Sidoarjo blow-out is a cause for serious concern.13
According to articles 10 and 12 of Government Regulation No. 42/2002, a function and a responsibility of the Executive Agency for Upstream Oil and Gas Activity (BP Migas) is to supervise the principal activities of oil and gas contrac-tors. Moreover, the preamble to the elucidation of this regulation states explicitly that the government delegates responsibility for controlling the exploitation of oil and gas reserves to BP Migas. It is surprising, therefore, that the head of the agency has been reported as saying that this responsibility lies with the Depart-ment of Energy and Mineral Resources (Kontan, 14/8/2006). Little is known about what monitoring of the contractor’s operations may have been undertaken, if any, although it is reported that the well did not even have an approved environmen-tal impact assessment (Walhi 2006).
The well is operated by Lapindo Brantas Inc., a subsidiary of PT Energi Mega Persada Tbk, which is owned in part by the Bakrie Group—the business conglom-erate controlled by the family of the coordinating minister for people’s welfare, Aburizal Bakrie. Lapindo Brantas has a 50% interest in the Brantas block opera-tion, along with Indonesia’s PT Medco Energi International Tbk (32%) and Aus-tralia’s Santos Ltd (18%). Lapindo Brantas has pledged an amount of $70 million to manage the mudfl ow, but this appears trivially small in comparison with one
estimate of the potential losses caused by the disaster: some $3.5 billion. This esti-mate, by the environmental group Greenomics Indonesia, is said to include the costs of mud clean-up, reconstruction of damaged and destroyed houses, facto-ries and infrastructure, and interruption to social, economic and business affairs, as well as ‘the ecological cost and economic uncertainty’ (Suara Karya, 8/8/2006). While the estimate may well prove to be wildly exaggerated, it seems hard to imagine that $70 million will come even close to what is needed to bring the prob-lem under control, let alone make good the damage. For example, it has been reported that it will cost almost that amount just to relocate several kilometres of toll-road passing through the area (Asia Pulse, 29/9/2006).
Presumably in an attempt to limit fi nancial losses to itself, Energi Mega Persada
quickly moved to sell its interest in Lapindo Brantas for a nominal sum to the Jersey Island-registered Lyte Ltd, another Bakrie group company (Upstream, 6/10/2006).14 On the assumption that this is a shelf company with negligible capital, the move may make it virtually impossible for the government and private sector entities to obtain fi nancial compensation—especially if the other partners, Medco and
Santos, argue that Lapindo was responsible for proper management of the opera-tion. Whatever the legal ramifi cations, however, Minister Bakrie seems likely to
be politically damaged by the episode. The Lapindo affair shows up an important area where the government’s production-sharing contracts (PSCs) may need fur-ther refi nement. Under the current system, the value of gas produced is split 65:35
13 There has been widespread speculation in the media that the long delay that ensued before the president fi nally declared the incident a national disaster (in late September)
refl ected the strong political connections of the contractor involved (see below).
14 The capital market regulator, Bapepam, is rightly taking a keen interest in this trans-action between a publicly listed company and another company owned by its majority shareholder (Asia Pulse, 29/9/2006).
cBIEDec06.indb 312
cBIEDec06.indb 312 27/10/06 5:19:06 PM27/10/06 5:19:06 PM
between the government and the contractor, respectively (85:15 in the case of oil), after production costs have been taken into account. The present case has seen the emergence of a debate as to whether it is legitimate for Lapindo Brantas to recognise the unanticipated costs of managing the mudfl ow as part of its production costs.
Since the government is effectively a silent shareholder in such enterprises, it might seem reasonable that it should share not only in expected profi ts but also in
unex-pected losses. Private sector investors will certainly require a more generous share of expected profi ts if they are to carry such risks in their entirety. In any case, the
lesson is that future PSCs should clarify this issue at the outset. This is a matter of considerable urgency, as the government has recently offered 41 oil and gas explo-ration blocks to investors (Investment Indonesia Online, 18/8/2006).
From the supervisory point of view, there is also an urgent need to anticipate possible accidents of this kind and to develop suitable contingency plans. The cur-rent system is demonstrably incapable of handling disasters such as the Lapindo affair, and it has been suggested that this issue should be linked with the bill on natural disaster mitigation currently under discussion in the DPR. Although the Lapindo affair is a man-made disaster, possibly involving human error or neg-ligence, it also has much in common with natural disasters like tsunamis and earthquakes. An appropriate set of guidelines is needed in order to try to avoid such disasters, and to facilitate handling them should they occur in any case. Such guidelines are not new in the oil and gas drilling business. The governments of Canada and Newfoundland and Labrador, for example, have jointly established a set of guidelines that provide a complete framework for managing the petroleum resources in the Newfoundland and Labrador offshore area.15
For such guidelines to be useful, their implementation would need to be moni-tored by a government agency, yet the supervisory effectiveness of BP Migas has been found wanting thus far. It is therefore important for both BP Migas and the Department of Energy and Mineral Resources to acquire a considerable number of highly trained professionals with the geological and engineering skills that would enable them to minimise the likelihood of such incidents, and to facili-tate prompt and effective counter-measures if they do occur. The occurrence of, and inadequate response to, the Lapindo disaster are symptomatic, however, of a deep malaise in the Indonesian civil service as a whole, refl ecting
deleteri-ous aspects of civil service practice such as a failure to match employee skills to job requirements, unrealistic compression of salary scales, promotion by senior-ity, and the prohibition of recruitment to high-level positions from outside. The Lapindo affair provides a clear example of the need for comprehensive reform of the bureaucracy (Synnerstrom 2006).
REFORM: WHAT MATTERS IS IMPLEMENTATION
In September the World Bank and the International Finance Corporation released their joint study, Doing Business 2007: How to Reform (World Bank 2006), which compares the ease of doing business around the world. Indonesia was ranked 135 among 175 economies. The report points out that although there had been
15 See the Canada – Newfoundland and Labrador Offshore Petroleum Board website, <http://www.cnlopb.nl.ca/>.
cBIEDec06.indb 313
cBIEDec06.indb 313 27/10/06 5:19:06 PM27/10/06 5:19:06 PM
some improvements in Indonesia’s investment climate over the previous year, including reduction of the time for starting a business, progress generally has been slow.
Of course, the legal and regulatory environment that is the focus of this series of Doing Business reports is not the only thing that affects fi rms’ behaviour.
Con-tinuing studies by the Institute for Economic and Social Research at the University of Indonesia (LPEM–FEUI) and the World Bank (LPEM–FEUI 2006; LPEM–FEUI forthcoming) also show that fi rms’ perceptions of the investment climate had
improved between 2003 and end-2005, but that exchange rate instability and ris-ing infl ation and interest rates during the second half of 2005 had caused them to
deteriorate again.
These studies fi nd that macroeconomic instability and policy uncertainty remain
the biggest concerns of business in Indonesia, followed by corruption. But certain microeconomic indicators of the business environment have shown improvement, particularly those related to harassment visits by, and bribes having to be made to, local offi cials, as well as delays in gaining approval for FDI projects. Based
on these observations, we believe that the negative (q-o-q) investment growth between Q4 2005 and Q1 2006 is more likely to be the result of macroeconomic instability than of a deterioration in the investment climate. Indeed, these studies report that the decline in harassment visits and bribes suggests that the ongoing anti-corruption campaign might be having an impact at the local level. Another possible explanation, however, is that local government offi cials and their private
sector targets for bureaucratic extortion have now had suffi cient experience under
the new decentralisation environment that corruption at this level has become more routinised. There is some evidence that ‘quality of governance’ competition among regional governments might be helping to reduce government-imposed costs of doing business. Unfortunately, national agencies such as the tax offi ce and
the customs service do not face similar competitive pressures, so ineffi ciency and
rent-seeking in central government agencies continue to be major obstacles. The government is well aware of the need to implement wide-ranging reforms in order to encourage more investment, and to help boost economic development in general. It has issued three packages this year, on infrastructure, the investment climate and the fi nancial sector.
Infrastructure package
As is also evident with the other packages, the government seems to have become wedded to the approach of reporting quantitative achievements—and non-achievements, for that matter. Thus it was reported that as of July 2006, only 40% of the targets in the infrastructure policy package (Manning and Roesad 2006: 163) had been realised (Media Indonesia, 12/7/2006). Suyono Dikun, a deputy for the coordinating minister for economic affairs, has revealed that, at best, only 80% of the 153 measures in the infrastructure package might be accomplished this year (delays in relation to the remainder being mainly the result of the long process of deliberation on the draft laws on transportation and on local government-owned enterprises).
In an attempt to facilitate implementation of the infrastructure package, the minister of fi nance issued Ministerial Decree No. 38/PMK.01/2006 on 19 May
2006, setting out guidelines for managing risks in infrastructure provision by the
cBIEDec06.indb 314
cBIEDec06.indb 314 27/10/06 5:19:07 PM27/10/06 5:19:07 PM
government. In addition, the government has introduced a price-capping mecha-nism for land required for toll road construction (Bisnis Indonesia, 6/6/2006). This may run into legal challenges, however, as it appears to confl ict with Presidential
Regulation No. 36/2005, under which owners of land resumed by the govern-ment for public purposes should receive fair compensation based on its actual market value (McLeod 2005: 146).
Investment package
The package for improving the investment climate (Presidential Instruction No. 3/2006, see Manning and Roesad 2006: 156–7) has also been experiencing delays in its implementation. As of late August 2006, only 31% of the targets (26 of 85) had been achieved.16 According to an assistant to the coordinating minister for economic affairs, the failure to accomplish various measures in the package is due mainly to unexpectedly slow progress in the completion of amendments to several laws. Other measures have been delayed because they are subject to par-liament’s approval of relevant draft laws, such as the new investment law and the amended tax law. The latter has been especially noteworthy, since the minister of
fi nance wrote to the parliament seeking to withdraw the draft law for further
revi-sion. The parliament refused to return the draft law, claiming that this move was unprecedented. With the president’s consent, the minister fi nally withdrew her
letter and submitted a proposal for further revision instead, encompassing meas-ures previously agreed between the government and the business sector (through the Chamber of Commerce and Industry, Kadin), namely: (1) to abort the plan to impose a tax on gift-giving between family members; (2) to recognise advertis-ing and promotion costs as tax deductible expenses; and (3) to remove taxes on exports of services.
Other measures have been held up because of delays in the issue of regulations by other ministries, for example, the plan to reduce local taxes on telecommuni-cations towers, weighing stations and the transport of goods (which, although assigned to the fi nance ministry in the package, needs to be accommodated by a
regulation issued by the minister of home affairs). This becomes even more com-plicated, since the taxes are related to numerous local government regulations.
Financial sector package
On 5 July 2006, the government issued another policy package, this time focus-ing on the fi nancial sector. It was issued as a joint ministerial decree between the
coordinating minister for economic affairs (as chair) and the minister of fi nance,
the minister for state-owned enterprises and the governor of Bank Indonesia (as members) (GOI 2006c). The package addresses fi ve aspects of the fi nancial
sector: fi nancial system stability; banks; non-bank fi nancial institutions; capital
markets; and ‘other’. The package was summarised in quantitative fashion as encompassing 14 policies, 32 programs and 57 actions. These numbers aside, the fi nance sector package appears less complicated than its predecessors (the
investment and infrastructure packages), and seems to focus mainly on just two objectives: helping the state banks to resolve their problems with bad loans, and
16 As reported in a meeting between monitoring teams and offi cials from responsible
min-istries on 1 September 2006 (GOI 2006b).
cBIEDec06.indb 315
cBIEDec06.indb 315 27/10/06 5:19:07 PM27/10/06 5:19:07 PM
clarifying the government’s policy direction in relation to privatisation of state-owned enterprises (although it is hard to see why this is regarded as a fi nance
sector policy).
Assessment
The problem with focusing on the number of targets achieved within each pack-age is that this ignores both the degree of importance of different targets and the degree of diffi culty in achieving them. For example, in relation to implementation
of the investment package, ‘holding a dialogue with the business community’ is regarded as completion of one measure, and is too readily interpreted as offsetting a non-completed measure—such as the failure even to submit to the DPR amend-ments of laws relating to the labour market. In fact, the latter is of far greater practical importance, and is so diffi cult politically that it has now been postponed
indefi nitely. With these considerations in mind, the 31% and 40% ‘scores’ in
rela-tion to the investment and infrastructure packages may give a very misleading impression of genuine progress.
The three packages share a common drawback: problems of implementation. The government’s intention to speed up economic progress is commendable, and the three packages are evidence of this intention. However, what matters ulti-mately is implementation. No doubt some delays are related to the legislative process, but this is by no means the full story. According to Faisal Basri, leader of an external team formed by the coordinating minister for economic affairs to help monitor implementation and provide a critical assessment of the invest-ment package, the governinvest-ment seems to be losing its reform moinvest-mentum. This is indicated, for example, by the decreasing rate of achievement by ministries and agencies with respect to their assigned responsibilities under each package. Moreover, whereas the regular investment package coordination meetings were at fi rst attended by high-level offi cials with decision-making authority, they are
now attended only by lower level offi cials without such authority.17
Notwithstanding the existence of certain legitimate obstacles to implementa-tion, the real problem lies deeper. Issuing policy packages like this may well sig-nal the government’s genuine intentions, but many offi cials in the bureaucracy
at best pay lip service to the need for economic reform. Many of the measures in the packages are in direct confl ict with the interests of these offi cials, for whom
the authority to issue permits and approvals is often highly lucrative. It should come as no surprise, therefore, that the packages are hard to implement because of strong resistance from within the bureaucracy itself.18 This in turns strongly suggests the need for major reform of a more fundamental kind: overhaul of the civil service itself, going far beyond the present focus on anti-corruption efforts (Synnerstrom 2006). Indeed, such reform is necessary not only in relation to the bureaucracy but also for the legislatures, where delays in enacting or amending key laws frequently refl ect the pay-off to members that results from being able to
frustrate governments’ legislative intentions.
17 Faisal Basri, personal communication, September 2006.
18 Of course, some delays are benefi cial—in particular, in relation to policy measures that
would in fact weaken rather than improve economic performance. The subsidised credit scheme of the Ministry for Small and Medium Enterprises is a case in point.
cBIEDec06.indb 316
cBIEDec06.indb 316 27/10/06 5:19:08 PM27/10/06 5:19:08 PM