Full Terms & Conditions of access and use can be found at
http://www.tandfonline.com/action/journalInformation?journalCode=vjeb20
Download by: [Universitas Maritim Raja Ali Haji] Date: 11 January 2016, At: 20:30
Journal of Education for Business
ISSN: 0883-2323 (Print) 1940-3356 (Online) Journal homepage: http://www.tandfonline.com/loi/vjeb20
The Role of Predictor Courses and Teams on
Individual Student Success
Lori Jo Baker-Eveleth , Michele O’Neill & Sanjay R. Sisodiya
To cite this article: Lori Jo Baker-Eveleth , Michele O’Neill & Sanjay R. Sisodiya (2014) The Role of Predictor Courses and Teams on Individual Student Success, Journal of Education for Business, 89:2, 59-70, DOI: 10.1080/08832323.2012.757541
To link to this article: http://dx.doi.org/10.1080/08832323.2012.757541
Published online: 17 Jan 2014.
Submit your article to this journal
Article views: 111
View related articles
JOURNAL OF EDUCATION FOR BUSINESS, 89: 59–70, 2014 CopyrightC Taylor & Francis Group, LLC
ISSN: 0883-2323 print / 1940-3356 online DOI: 10.1080/08832323.2012.757541
The Role of Predictor Courses and Teams
on Individual Student Success
Lori Jo Baker-Eveleth
University of Idaho, Moscow, Idaho, USAMichele O’Neill
California State University-Chico, Chico, California, USA
Sanjay R. Sisodiya
University of Idaho, Moscow, Idaho, USA
Research suggests that diverse environments enhance conscious modes of thought, resulting in greater intellectual engagement and active thinking. Ordinal and multinomial logistic re-gression results indicate that accounting courses and business law classes are useful predictors of subsequent performance. Odds ratio estimates indicate that students who perform poorly in these predictor classes are more than four times as likely to perform poorly in subsequent classes. Academic and gender diversity were not found to be significantly related to student performance.
Keywords: academic diversity, gender diversity, predictors, student performance, teams
Predictor courses have been used as a mechanism to de-termine student achievement in college courses (Kuncel, Crede, & Thomas, 2007; Yang & Lu, 2001). While much research has been done on the role of predictor courses for business students (Borde, 1998; McMillan-Capehart & Adeyemi-Bello, 2008; Sulaiman & Mohezar, 2006), little re-search has been done on student performance in predictor courses and the forecasting of success in highly integrated business courses.
This gap in the literature needs to be studied because the Association to Advance Collegiate Schools of Busi-ness (AACSB) strongly encourages integrated education (AACSB, 2011). Perhaps the traditional predictor courses, typically taught as stand-alone courses, may not adequately prepare students for an integrated business curriculum. In this study we investigated the helpfulness of not only predictor courses, but also academically and gender diverse teams on student achievement in an integrated business curriculum.
Correspondence should be addressed to Lori Jo Baker-Eveleth, Uni-versity of Idaho, Department of Business and Economics, 875 Campus Drive, P. O. Box 443161, Moscow, ID 83844-3161, USA. E-mail: leveleth@ uidaho.edu
INTEGRATED CURRICULUM AND STUDENT TEAMS
Many undergraduate business programs use grade point av-erages (GPAs) in specific courses to predict performance, but this often produces mixed results (Al-Twaijry, 2010; Borde, 1998). Predicting performance is increasingly chal-lenging when considering the desire to integrate educational programs. In particular, when considering integrated under-graduate business curriculum (IUBC), functional courses are team-taught rather than taught using single discipline ap-proaches. This form of integration challenges not only eval-uating performance, but also predicting student success.
In addition, the business community looks for employees with team skills and an understanding of cross-functional interactions (Athavale, Davis, & Myring 2008). Combining the two, schools seek opportunities to expose students to di-verse business environments to enhance conscious modes of thought, resulting in greater intellectual engagement and ac-tive thinking (Gurin, Dey, Hurtado, & Gurin, 2002). While preparing students to work in diverse teams may better pre-pare them for the work environment (Ely & Thomas, 2001), forecasting success in a team (oral communication, leader-ship, facilitation) is not always consistent with performance
60 L. J. BAKER-EVELETH ET AL.
measures of GPA (Alshare, Lane, & Miller, 2011; Joseph, Soon, Chang, & Slaughter, 2010).
Thus, we consider the role that teams which are diverse in academic experience and gender may play in enhancing student success in an integrated program. Diversity as a con-cept is multidimensional, whereby some consider diversity to include race, gender, age, disability, sexual orientation, and national orientation (Shore et al., 2009), others say that diversity can also include communication style, networks, and knowledge (Ely & Thomas, 2001). In particular, Ely and Thomas defined cultural differences in a group as arising from the “life experiences, knowledge, and insights” from the individuals (p. 265). Based on the previous description, this study, focused on academic (major) and gender as mea-sures of diversity on teams, asks these questions: can a work-ing environment of a diverse team lead to enhanced student performance. To what extent does exposure to a diverse en-vironment improve individual performance?
DATA AND METHODOLOGY
To explore these questions, we gathered three years of data from a residential land-grant university. The IUBC sequence of courses at this institution includes six sequential modules beginning with a short introductory module focusing on team management concepts, where students form teams and work together for two additional modules. Before starting the last three modules, students may change teams; therefore, we examine student performance and team configurations during each of five modules (labeled herein Modules I, II, III, IV, and V). In this study team configurations were for academic majors (eight possible) and gender representing two proxies for diverse teams.
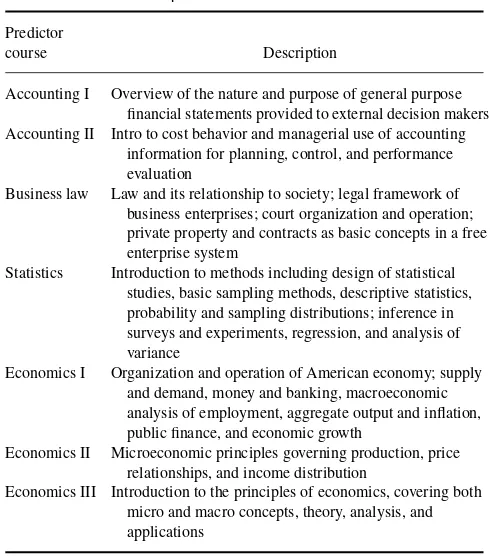
For the predictor classes, we examined whether the courses indicate success in such a junior level integrated course (see Table 1 for a description of courses). The college uses a traditional set of predictor classes covering introduc-tory accounting (two courses labeled herein I and II), business law, statistics, and economics (two courses labeled herein I and II, or a single class worth more credits labeled herein III). The course deliverables include exams and regularly collected assignments.
University-level data were gathered on grades, gender, and major for students who had enrolled in any of Modules I–V from fall 2008 through spring 2011 and were taught by a five-person faculty team. This request produced 284 unique students and provided complete results for 202 students.
Grades were recorded as A, B, C, D, or F. There were 84 instances of grade P for passing in one or more predictor classes for transfer students, and because the original score was not on record these instances were recoded to a C. Be-cause students must achieve a minimum GPA in predictor courses before being admitted into the junior level sequence of courses, some repeated one or more of their predictor
TABLE 1
Descriptions of Predictor Courses
Predictor
course Description
Accounting I Overview of the nature and purpose of general purpose financial statements provided to external decision makers Accounting II Intro to cost behavior and managerial use of accounting
information for planning, control, and performance evaluation
Business law Law and its relationship to society; legal framework of business enterprises; court organization and operation; private property and contracts as basic concepts in a free enterprise system
Statistics Introduction to methods including design of statistical studies, basic sampling methods, descriptive statistics, probability and sampling distributions; inference in surveys and experiments, regression, and analysis of variance
Economics I Organization and operation of American economy; supply and demand, money and banking, macroeconomic analysis of employment, aggregate output and inflation, public finance, and economic growth
Economics II Microeconomic principles governing production, price relationships, and income distribution
Economics III Introduction to the principles of economics, covering both micro and macro concepts, theory, analysis, and applications
classes. The college admitted students upon earning the nec-essary GPA in predictor courses.
Because the predictor courses included the option to take either two economics classes (I and II) or a single economics course worth more credit hours (III), we eventually analyzed the data according to whether students took the two-course economics sequence of predictors (Predictor Group 1) or one-course economics sequence (Predictor Group 2). The final data set contained 202 students in Modules I and II, 178 students in Modules III and IV, and 177 students in Module V. The drop in observations after Module II results because students performing poorly in Modules I and II often drop the IUBC and do not enroll in Modules III and V.
To develop the two measures of team diversity (academic and gender), we analyzed the self-selected student teams listed for each module for size, mix of men and women, and mix of declared majors. The college offered eight ma-jors: accounting, economics, finance, information systems (IS), management and human resources (MHR), marketing, operations management (OM), and professional golf man-agement. There were four frequent combinations of dou-ble majors: accounting-finance, economics-finance, IS-OM, and MHR-marketing. Because there was no way to deter-mine which major in the double majors was more appro-priate to use for a representative major, we kept track of the majors involved in the double majors when develop-ing the measure for academic diversity, which is described subsequently.
ROLE OF PREDICTOR COURSES ON STUDENT SUCCESS 61
A student is deemed to have been on a gender diverse team in a given module if the proportion of male (M) and female (F) students for the various team sizes (N) was any of the following: N of 2 has 1M/1F; N of 3 has 2M/1F or 2F/1M; N of 4 has 2M/2F; N of 5 has 2M/3F or 3M/2F; N of 6 has 2M/4F, 3M/3F, or 4M/2F. For all other proportions, the student was considered not to be on a gender diverse team.
The measure for academic diversity uses the variety of majors represented on a team as a proxy. When a team mem-ber had a double major, it subsumed any matching single majors and counted for two majors if no others matched. For example, if a team member was an accounting-finance dou-ble major, another member was a finance major, and another member was a Marketing major, we counted three majors as being represented (accounting, finance, marketing); on the other hand, if the accounting-finance double major was teamed with two marketing majors, we counted three ma-jors as being represented (accounting, finance, marketing). A student then was deemed to have been on an academically diverse team in a given module if the proportion of different majors to total majors represented for the various team sizes was any of the following: N of 2 has 2/2; N of 3 has 2/3; N of 4 has 3/4 or 4/4; N of 5 has 3/5, 4/5, or 5/5; N of 6 has 3/6, 4/6, 5/6, or 6/6. For all other proportions, the student was considered not to be on an academically diverse team.
Cross-tabulations were performed and two measures of ordinal association calculated, gamma and Somers’ d. Gamma can be interpreted as the percentage reduction in error achieved when ranking the dependent variable (here, grades in each of the five modules) by knowing the indepen-dent variable (here, grades in the various predictor classes). Because gamma is a symmetrical measure (meaning that the same value is calculated even if the independent variable is switched for the dependent variable), we also report Somers’ d, which in its original form is an asymmetrical measure.
To explore deeper for possible relationships among per-formance in the predictor courses, exposure to diverse teams, and performance in each of the five integrated modules, we conducted ordinal regression analysis, which accounts for an ordered dependent variable (Chen & Hughes, 2004; Noruˇsis, 2011). The four grade categories were ranked and coded in
the following order: A =1, B=2, C=3, D/F=4.
Or-dinal regression analysis models—with an adaptation to the underlying variable’s distribution via a link function—the cumulative probability of an event (e.g., a student scoring a C in Module II) along with all the events ordered before it (e.g., scoring either a B or A). The reference category then to which the estimated coefficients are compared is the last one ranked, here the combined scores of D/F.
To determine the most appropriate link function and model formulation, we made various comparisons and performed tests (Chen & Hughes, 2004). The complementary log-log was determined to be the most appropriate link function. Even then, the assumption of parallel lines was not met except for three instances: modeling Module I grades with either
group of predictors and modeling Module III grades with Predictor Group 1.
Because the ordinal regression methodology could not be used to analyze most of the data, we relaxed the normality, linearity, and homogeneity of variance assumptions (Garson, 2011; Schwab, 2011). We then analyzed the data as though it were a nominal variable. Doing so allowed us to apply multi-nomial logistic regression analysis. SPSS software (ver. 19, Chicago, IL) also allowed us to change the reference grade category for each of the modules from D/F (used in ordinal) to A.
Occasionally, multinomial logistic regression analysis produces unreasonable estimates. Often, such results are due to multicollinearity, predictor categories having zero obser-vations, or complete separation or bifurcation of the data, which drives the maximum likelihood estimates to infinity. Standard errors exceeding 2.0 indicate such problems, even if the estimates look reasonable (Schwab, 2011). Analyzing the data with multinomial logistic regression revealed problems with one or more standard errors or estimated implausible co-efficients for eight of the 10 possible full regression models. Eliminating the academic diversity measure, which had a low frequency of nondiversified teams (discussed subsequently), resolved estimation issues for five of the models.
To check the usefulness of the estimated models we cal-culated pseudoR2. However, because the levels are not as
meaningful as those for traditional R2 measures, we also
checked the accuracy of each model’s classification estima-tion. Even if no relationship existed between the independent and dependent variables, by chance alone we could predict correctly some of the time, which dependent variables be-longed with which group of independent variables. To ad-dress this, we compared the model’s computed classification percentage accuracy rate to a modified or by chance percent-age accuracy rate: the sum of the model’s squared marginal percentages, which is then increased by 25%. Comparing the rates allowed us to conclude that a model is useful when its classification accuracy rate is at least a 25% improvement over classification by chance alone (Schwab, 2011).
RESULTS
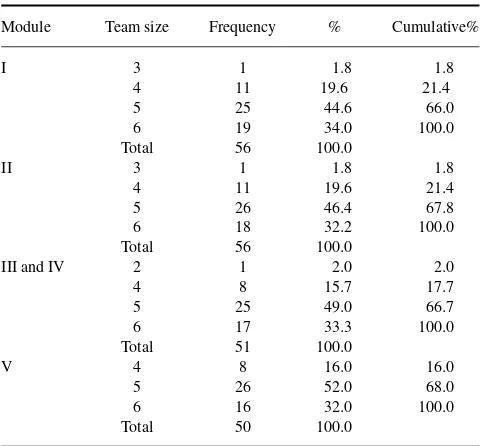
Descriptive frequency distributions are presented on team sizes and academic majors. Table 2 reports changes in team size frequencies across the five modules. Data collected show teams ranged in size from a low of two members, formed only once for only two modules, to a high of six members, which occurred in all modules. Five members to a team was the most common size, occurring 44.6–52% of the time. Table 3 reports the distribution of majors and four most common double majors declared at the start of Modules I and III, which was when teams reformed for the second semester. The most commonly declared majors were accounting, mar-keting, finance, and MHR. The frequency of these majors ranged from a low of 12.0% (MHR, Module I) to a high of 19.7% (accounting, Module III). The percentage change in
62 L. J. BAKER-EVELETH ET AL.
TABLE 2
Team Sizes Across the Five Modules
Module Team size Frequency % Cumulative%
I 3 1 1.8 1.8
each declared major suggests students may be affected by the diversity of business topics. After students complete Modules I and II, the double major of IS-OM gained 157.1% majors (from 0.7% to 1.8%). The second highest positive gain was in the double major economics-finance at 63.6% (from 1.1% to 1.8%). Students declaring nonbusiness majors experienced the largest decline at 22.2% (from 1.9% to 1.4%).
Results for the two variables measuring exposure to a di-verse team are presented in Table 4. Teams were academically diverse all the time, occurring no less frequently than 95.7% of the time (Module V). There was a small chance a student would not be exposed to an academically diverse team and 50% chance a student was exposed to a gender-diverse team. These formed at a frequency ranging from 53.1% (Module V) to 56.7% (Module I).
Table 5 presents cross-tabulations and measures of ordi-nal association. All gamma and Somers’ d calculations were significant at 5% or higher for all predictor classes in each of the five modules. Gamma scores ranged from a low of 0.253 (economics I and Module V) to a high of 0.629 (economics III and Module II), indicating that a moderate to fairly strong positive relationship exists between scores earned in the pre-dictor classes and scores earned in the modules. Accounting I had the most consistently strong relationship, with four of five gamma scores exceeding 0.500 (Modules I–III and V). Economics I and II showed the weakest relationships with all gamma scores below 0.450 for all five modules. Somers’ d measures ranged from 0.161 (economics I and Module V) to 0.444 (economics III and Module I), indicating that these predictor classes somewhat to moderately positively related with influencing the module grades.
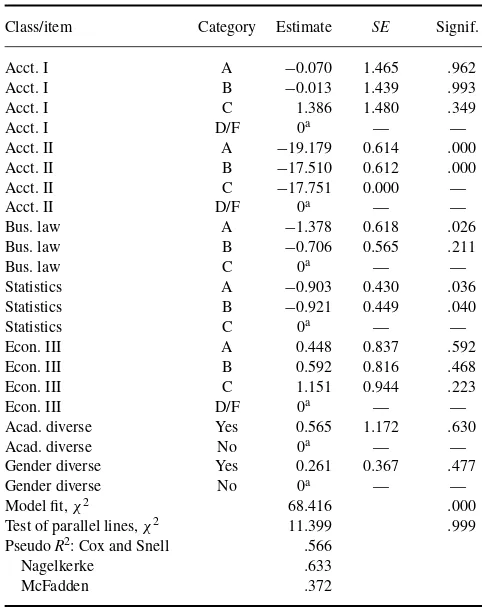
Results for the three estimated models that met the par-allel lines assumption of ordinal regression are reported in Tables 6 (Module I with Predictor Group 1), 7 (Module I
TABLE 3
Distribution of Declared Majors Across Beginning of Semesters When Teams Form
% Module I % Cumul. Module III % Cumulative change
Accounting 19.7 19.7 Accounting 18.0 18.0 −8.6
Note.Acct.=accounting; Econ.=economics; Info Sys.=information systems; Mark.=marketing; MHR=management and human resources; PGM-Marketing=professional golf management-marketing; POM= pro-duction operations management.
with Predictor Group 2), and 8 (Module III with Predictor Group 1). As expected because the reference grade category is a D or F, the signs of all statistically significant coeffi-cients are negative, indicating that a student was less likely to perform at the reference grade level. Also as desired, the chi-square statistics for model fit are significant while those for the test of parallel lines are insignificant. The three mea-sures of pseudoR2
are reported as well.
Table 6 shows that students earning As or Bs in Account-ing I are significantly less likely to earn Ds or Fs in Mod-ule I (significance=.000). Students earning As in statistics were significantly less likely to earn Ds or Fs in the module (.010). No other predictor courses’ grades are statistically
TABLE 4
Changes in Two Measures of Diversity Across the Five Modules
Module Team is academically diverse % Team is gender diverse %
I Yes 98.2 Yes 56.7
TABLE 5
Cross-Tabulation Percentage Frequency Results for Performance in Predictor ClassesVis- `a-Visthe Five Modules
Module I Module II Module III Module IV Module V
A B C D/F A B C D/F A B C D/F A B C D/F A B C D/F
Acct. I A 86 52 29 20 70 45 27 5 70 54 25 16 79 48 29 27 93 52 28 0
B 14 40 44 46 30 41 39 58 30 37 44 56 16 40 45 55 7 37 49 58
C 0 8 26 31 0 13 34 32 0 9 29 28 5 11 26 18 0 10 23 42
D/F 0 0 1 3 0 1 0 5 0 0 2 0 0 1 0 0 0 1 0 0
Gamma 0.503∗ 0.522∗ 0.529∗ 0.418∗ 0.591∗
Somers’d 0.347∗ 0.351∗ 0.367∗ 0.265∗ 0.376∗
Acct. II A 100 70 35 20 83 63 21 21 86 60 37 32 89 61 34 36 86 59 43 25
B 0 24 34 40 13 27 38 43 14 26 35 36 11 27 37 18 14 29 30 33
C 0 4 29 34 0 10 38 32 0 12 24 32 0 8 28 46 0 9 26 42
D/F 0 2 1 6 1 1 3 5 0 2 4 0 0 4 0 0 0 3 1 0
Gamma 0.617∗ 0.616∗ 0.453∗ 0.504∗ 0.420∗
Somers’d 0.435∗ 0.431∗ 0.310∗ 0.326∗ 0.263∗
Bus. law A 77 46 24 21 66 40 22 15 63 42 22 21 78 33 31 19 73 39 26 21
B 23 43 54 51 30 48 49 62 26 48 53 42 19 52 46 44 19 48 48 57
C 0 11 21 23 4 12 28 15 11 10 23 34 3 15 21 31 8 14 23 21
D/F 0 0 1 4 0 0 1 8 0 0 1 3 0 0 1 6 0 0 2 0
Gamma 0.440∗ 0.460∗ 0.430∗ 0.372∗ 0.367∗
Somers’d 0.305∗ 0.315∗ 0.296∗ 0.241∗ 0.230∗
Statistics A 73 48 22 11 67 39 18 12 66 38 30 14 72 40 25 0 73 38 28 15
B 14 38 52 41 23 45 45 42 17 43 46 43 25 42 42 53 19 44 41 38
C 14 14 26 48 9 16 37 46 17 19 24 43 3 18 33 47 8 18 31 46
D/F 0 0 0 0 0 0 0 6 0 0 0 0 0 0 0 0 0 0 0 0
Gamma 0.504∗ 0.514∗ 0.339∗ 0.488∗ 0.385∗
Somers’d 0.354∗ 0.355∗ 0.231∗ 0.315∗ 0.240∗
(Continued on next page)
63
TABLE 5
Cross-Tabulation Percentage Frequency Results for Performance in Predictor ClassesVis- `a-Visthe Five Modules(Continued)
Module I Module II Module III Module IV Module V
A B C D/F A B C D/F A B C D/F A B C D/F A B C D/F
Econ. I A 92 20 10 21 72 23 4 19 65 20 8 20 67 21 8 25 73 22 11 20
B 8 51 54 48 17 51 54 50 23 53 50 55 27 49 57 42 18 45 61 40
C 0 27 36 28 11 24 42 25 12 24 42 25 7 29 33 33 9 31 27 40
D/F 0 2 0 3 0 1 0 6 0 3 0 0 0 1 2 0 0 2 2 0
Gamma 0.306∗ 0.433∗ 0.298∗ 0.328∗ 0.253∗∗
Somers’d 0.215∗ 0.297∗ 0.211∗ 0.218∗ 0.161∗∗
Econ. II A 83 38 20 33 67 40 17 13 75 36 23 25 71 35 30 8 70 42 25 0
B 17 34 34 37 22 29 37 53 19 37 30 30 21 30 34 42 20 31 31 50
C 0 28 45 26 11 31 44 27 6 27 47 40 7 35 34 50 10 27 42 50
D/F 0 0 1 4 0 0 2 7 0 0 0 5 0 0 2 0 0 0 2 0
Gamma 0.283∗ 0.395∗ 0.397∗ 0.308∗ 0.422∗
Somers’d 0.194∗ 0.267∗ 0.279∗ 0.201∗ 0.266∗
Econ. III A 100 54 31 10 77 51 24 0 74 49 35 22 83 49 27 25 69 52 28 50
B 0 34 52 43 19 39 41 50 16 42 35 56 17 34 50 75 25 34 47 50
C 0 10 7 38 4 7 24 42 10 8 19 22 0 13 17 0 6 10 19 0
D/F 0 2 10 10 0 3 10 8 0 1 11 0 0 3 7 0 0 3 6 0
Gamma 0.627∗ 0.629∗ 0.410∗ 0.485∗ 0.357∗
Somers’d 0.419∗ 0.444∗ 0.264∗ 0.293∗ 0.215∗
Note: For ease of exposition dependent variables are in columns, independent variables are in rows, and rounded whole percentages are reported except for gamma and Somers’ d. Some column frequencies do not sum to 100 due to rounding.
∗p
<.05.∗∗p<.01.
64
ROLE OF PREDICTOR COURSES ON STUDENT SUCCESS 65
TABLE 6
Ordinal Regression Results for Module I With Predictor Group 1 Classes
Class/item Category Estimate SE Signif.
Acct. I A −17.900 0.371 .000
Gender diverse Yes 0.279 0.252 .269
Gender diverse No 0a — —
aParameter is set to zero because it is redundant because it is the com-parison category.
significantly related to scores earned in Module I, including diversity measures.
Table 7 reveals that students taking predictor classes in group 2 who earned As or Bs in accounting II or statistics were significantly less likely to earn Ds or Fs in Module I (significance =.000, .000, .036, and .040, respectively). A student earning an A in business law was also significantly less likely to earn a D or F (.026). The diversity measures have no significant relationships with Module I performance. Table 8 shows earning an A in accounting I was associ-ated with being less likely to earn a D or F in Module III
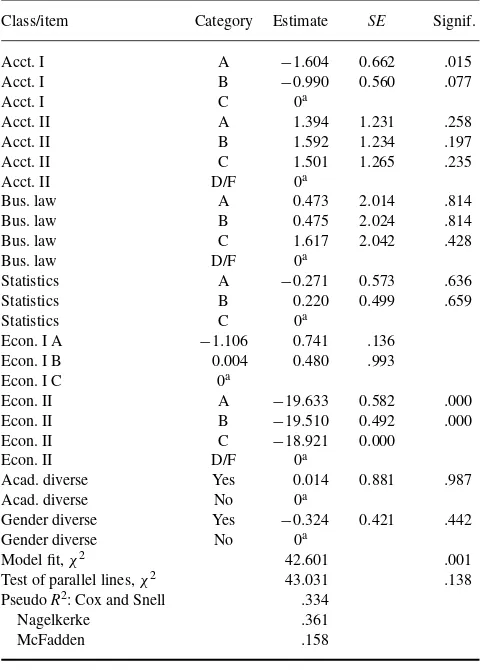
(significance = .015). There was a marginally significant
relationship for those earning a B in the predictor class (.077). A student earning an A or B in economics II was less likely to earn a D or F in the module (.000 and .000, respectively). However, given that the standard errors for business law were marginally larger than 2.0, all results must be interpreted with caution.
Multinomial regression results for the five models able to be estimated are presented in Tables 9–13. Panel A of the tables reports likelihood ratio significance tests, which
indi-TABLE 7
Ordinal Regression Results for Module I With Predictor Group 2 Classes
Class/item Category Estimate SE Signif.
Acct. I A −0.070 1.465 .962
aParameter is set to zero because it is redundant because it is the com-parison category.
cate for each of the predictor courses and the gender diversity measure whether there is a significant relationship between that variable and the particular module’s grades. Panel B reports, according to each module grade, the estimated co-efficients for each predictor class and the gender diversity variable, and their odds ratios. All these estimates are in ref-erence to scoring an A in the module while the grades in the predictor classes are ranked A=1, B=2, C=3, D/F=4; thus, significant positive coefficients have odds ratios exceed-ing 1.0, indicatexceed-ing that as performance in a predictor course declined (grade is lower and the rank is higher), the odds of scoring a grade in the module other than an A increased.
Results for Module II grades with classes from Predictor Group 1 presented in Panel A of Table 9 indicate a sig-nificant relationship between performances in Accounting I and Business Law vis-`a-vis performance in the module (significance=.041 and .013, respectively). Performance in statistics was marginally related (.072). Panel B reveals that business law can distinguish scores of C in Module II from scores of A (.026) and can marginally distinguish scores of D or F in the module from scores of A (.099). Economics I can marginally differentiate scores of C from A (.077), and accounting I can distinguish scores of D or F from A (.019). None of the predictor classes helps predict which students
66 L. J. BAKER-EVELETH ET AL.
TABLE 8
Ordinal Regression Results for Module III With Predictor Group 1 Classes
Class/item Category Estimate SE Signif.
Acct. I A −1.604 0.662 .015
Statistics C 0a
Econ. I A −1.106 0.741 .136
Acad. diverse No 0a
Gender diverse Yes −0.324 0.421 .442
Gender diverse No 0a
Model fit,χ2 42.601 .001
aParameter is set to zero because it is redundant because it is the com-parison category.
tend to score a B in the module from those who tend to score an A. The measure for gender diversity is insignificant across all grade breaks. The corresponding odds ratios for the signif-icant variables indicate that a student who performs poorly in business law is 6.5 times more likely to score a C in Module II
than an A—Exp(B)=6.509—and over 4.5 times more likely
to score a D or F (4.550). A student scoring poorly in eco-nomics I is over 4.5 more times likely to score a C rather than an A (4.574); scoring poorly in accounting I suggests that one will be over eight times as likely to score a D or F (8.221).
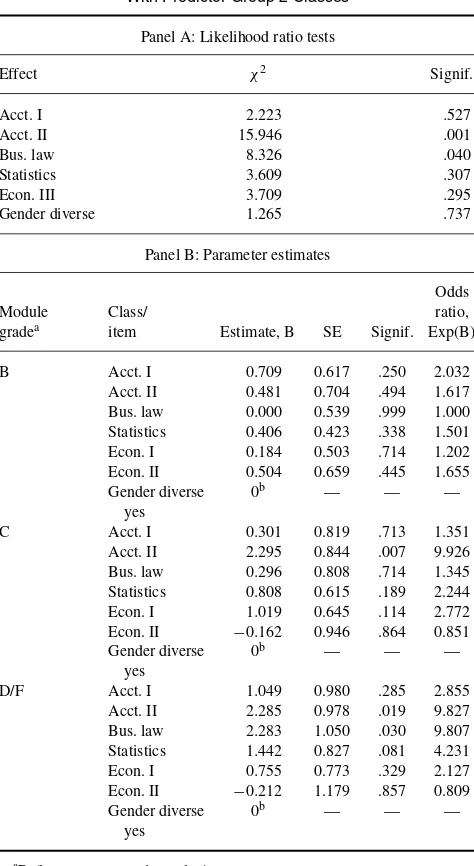
Table 10 presents results for Module II using Predictor Group 2 courses. Panel A shows that business law is signifi-cantly related to performance in the module (significance=
.040), but accounting II is more useful (.001) than account-ing I. Panel B reveals findaccount-ings similar to those in Table 9; namely, none of the courses can usefully distinguish mod-ule scores of B from A and the gender diversity measure is never significant. Accounting II can differentiate between students scoring Cs (.007) or Ds or Fs (.019) from those scor-ing As. Such students are nearly 10 times as likely to perform
thus—Exp(B)=9.926 and 9.827, respectively. Business law
can discern (significance=.030) between students earning
TABLE 9
Multinomial Logistic Regression Results for Module II With Predictor Group 1 Classes
Panel A: Likelihood ratio tests
Effect χ2 Signif.
Acct. I 8.277 .041
Panel B: Parameter estimates
Odds
Module Class/ ratio,
gradea item Estimate, B SE Signif. Exp(B)
B Acct. I 0.842 0.750 .261 2.322
Acct. II −0.504 0.698 .470 0.604 Bus. law 0.826 0.794 .298 2.284 Statistics 0.026 0.577 .964 1.026 Econ. I 1.196 0.799 .134 3.308 Statistics 0.944 0.641 .141 2.570 Econ. I 1.520 0.859 .077 4.574 Statistics 0.660 0.757 .383 1.936 Econ. I 0.994 0.966 .304 2.703
aReference category is grade A.
bParameter is set to zero because it is redundant because it is the compar-ison category.
a D or F from those earning an A, estimating that as stu-dents perform worse in the course they are nearly 10 times more likely to score a D or F in the module rather than an
A—Exp(B)=9.807. Statistics can marginally discern
(sig-nificance=.081) scores of D or F from A, estimating that such students are 4.231 times as likely to do so.
Results for Module III gradesvis-`a-visPredictor Group 1 are reported in Table 11. Again, business law significantly
ROLE OF PREDICTOR COURSES ON STUDENT SUCCESS 67
TABLE 10
Multinomial Logistic Regression Results for Module II With Predictor Group 2 Classes
Panel A: Likelihood ratio tests
Effect χ2 Signif.
Acct. I 2.223 .527
Panel B: Parameter estimates
Odds
Module Class/ ratio,
gradea item Estimate, B SE Signif. Exp(B)
B Acct. I 0.709 0.617 .250 2.032
Acct. II 0.481 0.704 .494 1.617 Bus. law 0.000 0.539 .999 1.000 Statistics 0.406 0.423 .338 1.501 Econ. I 0.184 0.503 .714 1.202 Statistics 0.808 0.615 .189 2.244 Econ. I 1.019 0.645 .114 2.772 Statistics 1.442 0.827 .081 4.231 Econ. I 0.755 0.773 .329 2.127 Econ. II −0.212 1.179 .857 0.809 Gender diverse
yes
0b — — —
aReference category is grade A.
bParameter is set to zero because it is redundant because it is the compar-ison category.
relates to performance in the module (significance=.050). Panel B results indicate that only economics I appears able to discern among the various grades (significance=.094 and .061 for grades B and C, respectively). The corresponding odds of doing so are 4.049 and 5.160. The gender diversity measure remains insignificant.
Module III’s grades relative to courses in Predictor Group 2 are shown in Table 12. As before, Panel A shows that perfor-mance in business law is related to perforperfor-mance in the mod-ule (significance=.049), and now both accounting courses are marginally related (.086 and .089, respectively). Panel B reveals that business law differentiates between students scoring Ds or Fs rather than As (.063) and that accounting
TABLE 11
Multinomial Logistic Regression Results for Module III With Predictor Group 1 Classes
Panel A: Likelihood ratio tests
Effect χ2 Signif.
Acct. I 4.816 .186
Panel B: Parameter estimates
Odds
Module Class/ ratio,
gradea item Estimate, B SE Signif. Exp(B)
B Acct. I 0.119 0.833 .887 1.126
Acct. II 1.203 0.862 .163 3.329 Bus. law −0.695 0.786 .377 0.499 Statistics −0.253 0.580 .663 0.776 Econ. I 1.398 0.835 .094 4.049 Statistics −0.432 0.631 .494 0.649 Econ. I 1.641 0.875 .061 5.160 Statistics 0.140 0.669 .834 1.150 Econ. I 1.192 0.919 .195 3.294
aReference category is grade A.
bParameter is set to zero because it is redundant because it is the compar-ison category.
II distinguishes between those scoring a C rather than an A (.047). The estimated odds of doing so are 8.397 and 9.232, respectively. The gender diversity measure remains insignif-icant and none of the courses can discern students scoring Bs from those scoring As.
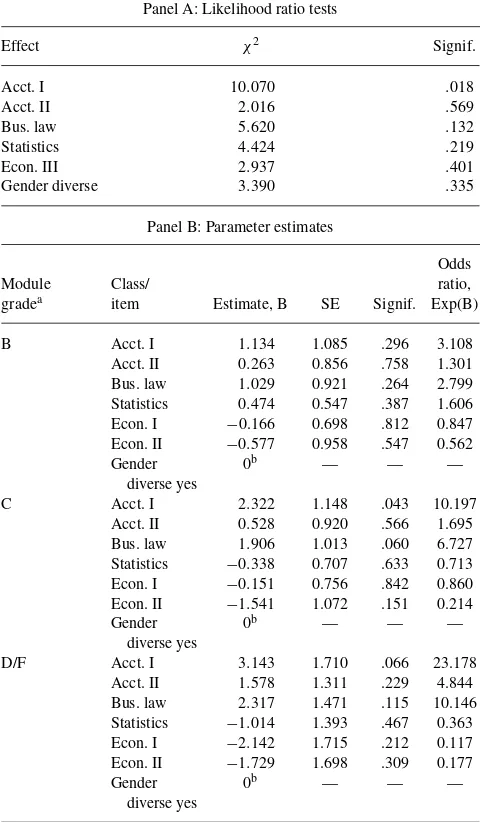
Module V scores modeled with Predictor Group 2 are reported in Table 13. Panel A shows that Accounting I appears significantly relates to performance in the module
68 L. J. BAKER-EVELETH ET AL.
TABLE 12
Multinomial Logistic Regression Results for Module III With Predictor Group 2 Classes
Panel A: Likelihood ratio tests
Effect χ2 Signif.
Acct. I 6.585 .086
Panel B: Parameter estimates
Odds
Module Class/ ratio,
gradea item Estimate, B SE Signif. Exp(B)
B Acct. I −0.420 0.640 .512 0.657
Acct. II 1.393 1.046 .183 4.025 Bus. law −0.122 0.658 .853 0.886 Statistics 0.048 0.498 .923 1.049 Econ. I 0.018 0.522 .972 1.018 Statistics −0.794 0.736 .280 0.452 Econ. I 0.115 0.629 .855 1.122 Statistics 0.509 0.986 .606 1.664 Econ. I −0.369 0.844 .662 0.691 Econ. II −2.126 1.455 .144 0.119 Gender
diverse yes
0b — —
aReference category is grade A.
bParameter is set to zero because it is redundant because it is the compar-ison category.
(significance=.018). Panel B shows that the course further differentiates among students earning Cs (.043) or Ds or Fs (marginally at .066) rather than As. business law can discern differences among student performance, namely those scoring Cs (.060). The respective odds of such performances are 10.197, 23.178, and 6.727. As always, gender diversity is still insignificant, both generally and for all grades, and none of the predictor courses is helps to discern module scores of B from A.
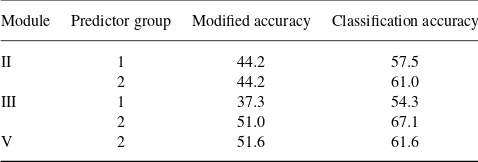
Table 14 compares the classification accuracy rates to the modified or by chance accuracy rates. All the original clas-sification rates improve upon the modified rates, suggesting
TABLE 13
Multinomial Logistic Regression Results for Module V With Predictor Group 2 Classes
Panel A: Likelihood ratio tests
Effect χ2 Signif.
Acct. I 10.070 .018
Panel B: Parameter estimates
Odds
Module Class/ ratio,
gradea item Estimate, B SE Signif. Exp(B)
B Acct. I 1.134 1.085 .296 3.108
Acct. II 0.263 0.856 .758 1.301 Bus. law 1.029 0.921 .264 2.799 Statistics 0.474 0.547 .387 1.606 Econ. I −0.166 0.698 .812 0.847 Statistics −0.338 0.707 .633 0.713 Econ. I −0.151 0.756 .842 0.860 Statistics −1.014 1.393 .467 0.363 Econ. I −2.142 1.715 .212 0.117 Econ. II −1.729 1.698 .309 0.177 Gender
diverse yes
0b — — —
aReference category is grade A.
bParameter is set to zero because it is redundant because it is the compar-ison category.
that all of the models are useful at predicting grade rankings in the estimated modules.
DISCUSSION
To sum, exposure to academically diverse or gender di-verse teams did not significantly affect individual student performance in an integrated curriculum. Only one model found the first economics course of a two-class sequence in a predictor group significantly useful in predicting perfor-mance in later modules. The second economics course was useful one time, and an alternative single economics course
ROLE OF PREDICTOR COURSES ON STUDENT SUCCESS 69
TABLE 14
Model Classification Percentage Accuracy Rates Versus Modified Accuracy Rates
Module Predictor group Modified accuracy Classification accuracy
II 1 44.2 57.5
2 44.2 61.0
III 1 37.3 54.3
2 51.0 67.1
V 2 51.6 61.6
worth more credit hours included in a different predictor group was never significant. Both regression analyses found the Business Law predictor course useful. The first account-ing course of the two-course sequence was the next most frequently significant predictor course followed by statistics. While relatively few of the classes comprising either set of predictor groups were significantly related to follow-up per-formance, the multinomial regression methods reveal that the odds ratios for those courses that are significantly related ex-ceed 4.0. Students and faculty should monitor performance in select predictor courses because students that do not per-form well are four times more likely not to perper-form well in the junior year compulsory business modules.
Of the five modules with grade rankings modeled here, Module II grades were significantly related to more predictor courses than other modules’ grades, at six instances. Module I grades were related five times, Module III had four instances, and Module V showed only two significant relations. Module IV grades were never significantly related to performance in either of the predictor groups.
While all the modules teach typical introductory material for five business areas (finance, IS, MHR, marketing, and OM) in a highly integrated fashion, each module has a par-ticular focus. Module I covers the variety of systems within which businesses operate. Module II highlights the planning and implementation processes needed at the strategic levels. Module III teaches tools used to do quantitative and qualita-tive forecasting, while Module IV covers the management of firm resource. Finally, Module V considers the major oper-ating decisions related to product, pricing, and distribution. One interpretation of our results, then, is that topics and tech-niques covered in introductory accounting, business law, and to a lesser degree statistics are a better preparation for under-standing the systemic qualities of the business environment and the variety of planning required in firms.
As for the two diversity measures lacking any explana-tory power, perhaps there was not enough variation in the academic diversity measure because over 95% of teams were considered diverse. A larger sample size or different proxy for diversity could be helpful. Perhaps exposure to different genders by the time students are juniors in college no longer has the same effect as earlier. Alternatively, in capturing how diverse knowledge bases on a team affects grade
perfor-mance, perhaps better proxies would reflect communication skills, coping skills, or team management skills.
CONCLUSION
We investigated whether predictor courses and academically-and gender-diverse teams influence student performance in a compulsory yearlong integrated business course that records grades for five modules. Observations are collected over three years. These results provide insight not only to what predic-tor courses might be helpful in enhancing student success in an integrated program, but also to whether diverse team environments increase individual student success.
Cross-tabulation analysis suggests predictor courses are useful in reducing the prediction error when ranking grades in each module. Gamma scores indicated a moderate to fairly strong positive relationship between performance in the pre-dictor courses and performance in each module. Performance in the first of a two-course accounting sequence of predic-tor classes was strongly associated with subsequent scores in the modules. The directional measure, Somers’ d, indi-cated the courses are moderately helpful in predicting later performance in the modules.
The proxy measures of diversity were based on the makeup of self-determined student teams that vary in size and include degrees of academic and gender diversity. The majority of the time students were exposed to academically diverse teams and over half the time to gender diverse teams. More in-depth analysis was attempted with ordinal regres-sion to try to use any information contained in the ranked nature of grades. Results suggest that the two accounting courses and the statistics predictor course are useful in esti-mating later performance in the first module. Neither of the diversity measures was statistically significant.
Data constraints cause only two of the five modules to be estimable with ordinal regression (some assumptions are re-laxed, academic diversity measure dropped, and multinomial logistic regression applied). Three modules are estimable un-der this analysis and show that the first accounting course and a predictor course in business law are most consistently re-lated to later performance in the modules. Also, when signifi-cant, predictor courses can better distinguish among students performing at the C, D, or F grade levels (as opposed to scoring As) than those earning Bs.
We considered academic and gender differences when evaluating team diversity. While we had predicted that gender diversity at the team level would enhance success, the measure remained insignificant. This result could be driven by a number of factors, including the likelihood that gender diversity might not be as critical as it once was when promoting novelty in thought because students are increas-ingly more exposed to gender diverse environments. This in no way suggests that gender diversity is not important, rather, that gender diversity is more of a norm in team environments. The selection of measurements for team diversity and the
70 L. J. BAKER-EVELETH ET AL.
results create a limitation of the study and an opportunity for additional research. The construct of diversity at the team level is multidimensional and includes more than academic and gender diversity; thus, we suggest future researchers consider alternative measures of team diversity in enhancing student success. Our student diversity (residential, land-grant university), which is common to other universities and colleges, is somewhat limited. An extension of this present study would be to validate these results in a different context and to explore additional facets of diversity. An additional opportunity could be to investigate appropriate predictor courses that may help students develop stronger communication and interpersonal skills prior to entering the integrated business course.
REFERENCES
Al-Twaijry, A. A. (2010). Student academic performance in undergraduate managerial-accounting courses.Journal of Education for Business,85, 311–322.
Alshare, K. A., Lane, P. L., & Miller, D. (2011). Business communication skills in information systems (IS) curricula: Perspectives of IS educators and students.Journal of Education for Business,86, 186–194. Association to Advance Collegiate Schools of Business. (2011).
Eligibil-ity procedures and accreditation standards for business accreditation.
Retrieved from http://www.aacsb.edu/accreditation/standards.asp Athavale, M., Davis, R., & Myring, M. (2008). The integrated business
curriculum: An examination of perceptions and practices.Journal of Ed-ucation for Business,83, 295–301.
Borde, S. F. (1998). Predictors of student academic performance in the introductory marketing course.Journal of Education for Business,73, 302–306.
Chen, C., & Hughes, J. Jr. (2004). Using ordinal regression model to analyze student satisfaction questionnaires.IR Applications,1, 1–12.
Ely, R. J., & Thomas, D. A. (2001). Cultural diversity at work: The ef-fects of diversity perspectives on work group processes and outcomes.
Administrative Science Quarterly,46, 229–273.
Garson, G. D. (2011). Logistic regression. From Statnotes: Top-ics in multivariate analysis. Retrieved from http://faculty.chass.ncsu. edu/garson/PA765/logistic.htm
Gurin, P., Dey, E. L., Hurtado, S., & Gurin, G. (2002). Diversity and higher education: Theory and impact on educational outcomes.Harvard Educa-tional Review,72, 330–366.
Joseph, D., Soon, A. N. G., Chang, R. H. L., & Slaughter, S. A. (2010). Practical intelligence in IT: Assessing soft skills of IT professionals.
Communications of the ACM,53, 149–154.
Kuncel, N. R., Crede, A. F., & Thomas, L. L. (2007). A Meta-analysis of the predictive validity of the Graduate Management Admission Test (GMAT) and undergraduate grade point average (UGPA) for graduate student academic performance.Academy of Management Learning & Education,6(1), 51–68.
McMillan-Capehart, A., & Adeyemi-Bello, T. (2008). Prerequisite course-work as a predictor of performance in a graduate management course.
Journal of College Teaching & Learning,5(7), 11–16.
Noruˇsis, M. J. (2011). Chapter 4: Ordinal regression.IBM SPSS statistics 19: Advanced statistical procedures companion(pp. 69–89). Englewood Cliffs, NJ: Prentice Hall.
Schwab, J. (2011). Multinomial logistic regression basic relation-ships [PowerPoint slides]. Retrieved from www.utexas.edu/courses/ schwab/sw388r7/solvingProblems/MultinomialLogisticRegression Basic Relationships.ppt
Shore, L. M., Chung-Herrera, B. G., Dean, M. A., Ehrhart, K. H., Jung, D. I., Randel, A. E., & Singh, G. (2009). Diversity in organizations: Where are we now and where are we going?Human Resource Management Review,
19, 117–133.
Sulaiman, A., & Mohezar, S. (2006). Student success factors: Identi-fying key predictors. Journal of Education for Business, 81, 328– 333.
Yang, B., & Lu, D. R. (2001). Predicting academic performance in manage-ment education: An empirical investigation of MBA success.Journal of Education for Business,77, 15–20.