74:6 (2015) 15–19 | www.jurnalteknologi.utm.my | eISSN 2180–3722 |
Full paper
Jurnal
Teknologi
Eye Therapy Effects on Visual Stress based on Electroencephalogram
Signals
Norlaili Mat Safri*, Siti Nurainn Fayyadhah Adnan
Department of Electronic and Computer Engineering, Faculty of Electrical Engineering, Universiti Teknologi Malaysia, 81310 UTM Johor Bahru, Johor, Malaysia
*Corresponding author: [email protected]
Article history
Received : 25 March 2015 Received in revised form : 11 April 2015
Accepted : 13 April 2015
Graphical abstract
Abstract
Eye therapy such as eye massages, has been designed to reduce eye problems and improve blood circulation of the eyes. When reading, the signs and symptoms of visual exhaustion are related to visual stress and people may make use of eye therapy to reduce this visual stress. It is well-known that a relaxed mind can be analysed via the study of an electroencephalogram signal. In this paper, we investigated the effect of eye therapy on visual stress by analysing brain signals (EEG) in frequency domain. Ten subjects participated. In the control task, subjects were asked to relax while EEG data were captured for two minutes. The next part was a visual test task, where the subjects were asked to search for a specific word in a text displayed on a computer screen while their EEG data were recorded. One visual test was performed without prior eye therapy, while the other three visual test tasks were performed following different eye therapy routines. The visual test task was completed fastest when subjects received eye drops and eye massages prior to the visual test. The difference between the visual test with and without prior eye therapy can be observed in the gamma frequency band, where with eye therapy, the high-gamma frequency band significantly increases in the frontal, temporal and occipital areas, and the word search performance was improved, with a shorter time needed to complete the task. In conclusion, the high-gamma frequency band may be an indicator to study visual stress, while specific eye-therapy routines may contribute to better eye and brain performance in word searching in a text displayed on a computer screen.
Keywords: Eye therapy; visual stress; word search; electroenchaplogram; fast fourier transform
Abstrak
Terapi mata seperti urutan mata, telah direka untuk mengurangkan masalah mata dan meningkatkan peredaran darah mata. Apabila membaca, tanda-tanda dan gejala keletihan adalah berkaitan dengan tekanan visual, dan terapi mata boleh digunakan untuk mengurangkan tekanan visual ini. Artikel ini adalah berkaitan tentang kesan terapi mata pada tekanan visual dengan menganalisa isyarat otak (EEG). Sepuluh subjek mengambil bahagian. Dalam tugas kawalan, subjek diminta untuk berehat sambil data EEG direkod selama dua minit. Bahagian yang seterusnya adalah satu tugas ujian visual, di mana subjek diminta mencari perkataan tertentu dalam teks yang dipaparkan pada skrin komputer, Ketika itu, data EEG mereka direkodkan. Satu ujian visual telah dilakukan tanpa terapi mata terlebih dahulu, sementara yang tiga lagi ujian visual telah dilakukan mengikut rutin terapi mata yang berbeza. Berdasarkan EEG, kekerapan band tinggi-gamma boleh menjadi petunjuk untuk mengkaji tekanan visual, manakala rutin terapi mata khusus boleh menyumbang kepada prestasi yang lebih baik untuk mata dan otak ketika pencarian perkataan dalam teks yang terpapar pada skrin komputer.
Kata kunci: Terapi mata; tekanan visual; carian perkataan; electroensefalogram; jelmaan pantas fourier
© 2015 Penerbit UTM Press. All rights reserved.
1.0 INTRODUCTION
The broad spectrum of common eye irritation symptoms in an office building includes eyes that are dry, sore, itchy, stinging, gritty, scratchy, and strained. These are caused by several factors, for example, environmental factors such as low relative humidity and high room temperature, attention-demanding task
relief for short-term dry eyes when the cause is related to temporary circumstances. Meanwhile, a particular eye massage with a magnetic field on the soft massage feeler applied to specific acupuncture points on the front of the physical energy can improve the function of the cells as well as overcome many types of eye irritation symptoms [3]. This eye therapy device is a new line of eye massage therapy products.
Currently, there are many types of eye drops and eye therapy devices on the market for different functions. A specific electronic eye massage purports to reduce eye swelling and eye fatigue, relieve insomnia and headaches, and improve eye blood circulation after a long period in front of a computer [4].Some consumers believe that their eyes become fresher and their need for glasses is reduced after using this eye therapy device. Until recently, though, there has been no research that verified the efficacy of this device.
The main focus of this paper is to determine the effects of this eye therapy on visual stress and brain performance using an electroencephalogram (EEG) signal. Visual stress refers to reading difficulty, light sensitivity and headaches from exposure to disturbing visual patterns. Visual stress can be tested by using a rate of reading test, in which subjects are required to read aloud randomly ordered common words as quickly as possible [4].The test was modified in the paper, as reading aloud will interfere with the EEG signal; refer to section 2.0. (C) for details.
2.0 METHODOLOGY
A. Participant
Ten electrical engineering students, aged 20 to 25 years old, participated in the study. All of them wear glasses, are in healthy condition and are free from any disease or medication.
B. Data Measurement
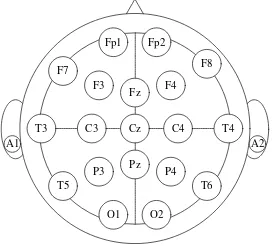
The data of the brain signal were collected using an electroencephalography (EEG) machine (EEG-9100J/K Neurofax, Nihon Kohden, Japan). The brain activity was recorded using a 19-channel electrode placement cap situated on the scalp according to the International 10-20 system of electrode placement (i.e., , , , , , , , , , , , , , , , , , , and ). Two external electrodes (Ag/AgCl) were placed on both earlobes (i.e., and ) of the subject for grounding (Figure 1). The low pass filter was set to 0.07 Hz, and the high pass filter was set to 120 Hz. The impedance check was maintained below 50 k, and the sampling frequency was 1 kHz. A stop watch was used to measure the time taken by the subject to complete the assigned task.
C. Experimental Task and Procedure
As mentioned, visual stress can be tested by using a rate of reading test. As reading aloud interferes with the EEG signal, a word search test was used instead.
First, subjects were asked to relax while the EEG data were recorded (control task). Then, the subjects were given a visual test in which they needed to search for a given word in a text displayed on a computer screen, and at the same time, their EEG signals were recorded. The visual test was divided into four
parts. The Visual test-No Therapy (VT-NT) task was a visual test without any eye therapy given prior to the test. The Visual test-Eye drop (VT-ED) task was a visual test with a particular eye drop given to the subjects prior to the test. The Visual test-Eye massage (VT-EM) task was a visual test with a particular eye massage given to the subjects prior to the test. Lastly, the Visual test-Eye drop + Eye massage (VT-EDEM) task was a visual test with both an eye drop and eye massage given to the subjects prior to the test.
Figure 1 19-channels of electrode placement with grounding
The time provided to the subjects to find the word “PERMATA” in text displayed on a computer screen was only 2 minutes. Within this period, if the subject was able to find the word in the text, the test was stopped. If the subjects failed to find it within 2 minutes, the test was stopped as well. A stopwatch was used to measure the time. For the eye massage session, the treatment had a duration of 3 minutes. At the end of each visual test, the subjects were given a questionnaire consisting of 11 questions related to the experiment.
For all four visual tests, the subjects were required to find the word “PERMATA” in text as quickly as possible. The use of randomly ordered words ensures that each word cannot be characteristics were used, although they used different words. All of the texts contained 170 words, consisting of 50 words of 1-4 letters, 50 words of 5-9 letters, 50 words of 10-14 letters, and 20 words of 15-19 letters. The texts were typed in capital letters in Times New Roman with a font size of 12. The search word “PERMATA” in all of the texts was placed in the 100th word position. The distance between the subject’s eyes and the text was fixed at 1.5 m.
D. Data Processing
We analysed the spectral power in six different frequency ranges: 1–3 Hz (delta), 4–7 Hz (theta), 8–12 Hz (alpha), 13–30 Hz (beta), 31–50 Hz (gamma), and 51-120 Hz (high-gamma). The condition-related power change was expressed as (power (visual test) – power (control))/power (control). A t-test was conducted to determine the significance of differences between the control task and the four visual test tasks, and the significance level was set to P < 0.05.
3.0 RESULTS AND DISCUSSION
A. Period of Test and Questionnaires
Table 1 shows the time taken for each subject to finish the given tasks. Six subjects (60%) completed the VT-EDEM task in the shortest time compared to the other visual test tasks. Only one subject was unable to complete the task in the stipulated time for the VT-EDEM task. In comparison, as many as 50% of the subjects did not complete the visual test in the stipulated time in the VT-NT task, in which no eye therapy was given to the subject prior to the test. On average, the shortest time required was for the VT-EDEM task, followed closely by the VT-EM task, the VT-ED and the VT-NT.
Table 1 Time taken for subjects to finish the visual tests for four tasks
Subject difficult to complete the VT-NT task because they had to gaze at a laptop screen on which the letters of the text appeared to move and were too close to each other. They also felt slight eye strain when performing the VT-ED task. The condition of the eyes improved when they received the eye massage. As for reading habits, 60% of the subjects started the search at the top left of the screen by reading word by word.
B. EEG Signal Analysis
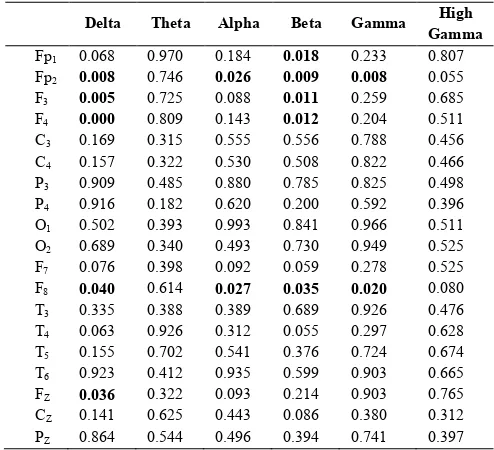
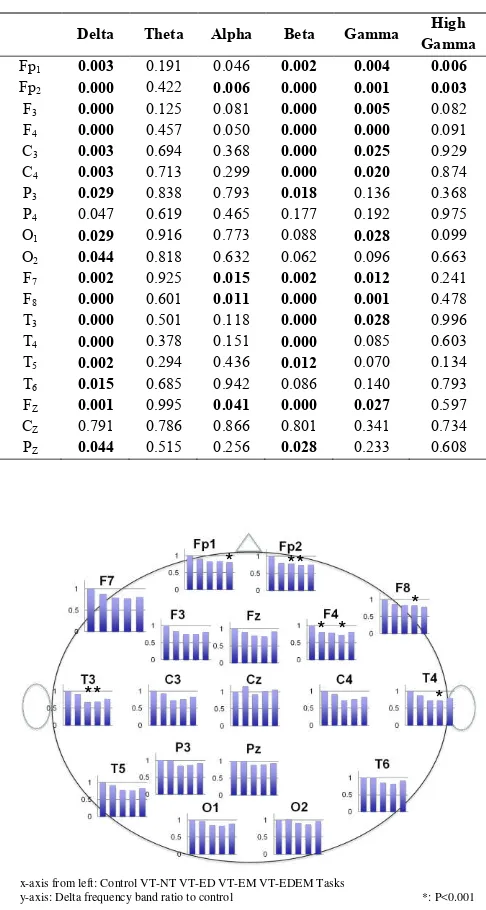
Tables 2 to 5 show the t-test values between the control and VT-NT, VT-ED, VT-EM, and VT-EDEM tasks, respectively. P values less than 0.05 were bolded, indicating significant differences between the control and visual test tasks. No significant differences were found in the theta frequency band. Other frequency bands showed significant differences between the control and visual test tasks, especially in the frontal and temporal areas and in the parietal area as well.
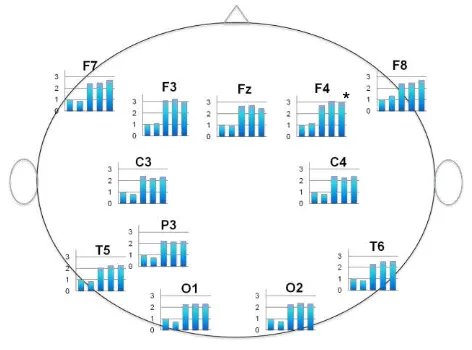
Figures 2-6 show the ratio of normalised power changes for delta, alpha, beta, gamma, and high-gamma, respectively, for all of the tasks with respect to the control value. Here, we only summarise the VT-EDEM task result, which took the shortest. As shown in Table 5 and Figures 2-6, the delta frequency band decreased significantly for the VT-EDEM task compared to the
control. However, the alpha, beta, gamma, and high-gamma frequency bands increased significantly for the VT-EDEM task compared to the control, mainly in the frontal area and somewhat in the temporal and occipital areas (for beta frequency band and higher).
Table 2 T-test value between control and VT-NT task
Delta Theta Alpha Beta Gamma High
Table 3 T-test value between control and VT-ED task
eye therapy (VT-NT vs. VT-EDEM) can be observed in the gamma frequency band, where with eye therapy, the high-gamma frequency band significantly increases and the visual test performance was better with a shorter time needed to complete the task.
Table 4 T-test value between control and VT-EM task
Delta Theta Alpha Beta Gamma High Gamma
Fp1 0.003 0.191 0.046 0.002 0.004 0.006 Fp2 0.000 0.422 0.006 0.000 0.001 0.003 F3 0.000 0.125 0.081 0.000 0.005 0.082 F4 0.000 0.457 0.050 0.000 0.000 0.091 C3 0.003 0.694 0.368 0.000 0.025 0.929 C4 0.003 0.713 0.299 0.000 0.020 0.874 P3 0.029 0.838 0.793 0.018 0.136 0.368
P4 0.047 0.619 0.465 0.177 0.192 0.975
O1 0.029 0.916 0.773 0.088 0.028 0.099 O2 0.044 0.818 0.632 0.062 0.096 0.663 F7 0.002 0.925 0.015 0.002 0.012 0.241 F8 0.000 0.601 0.011 0.000 0.001 0.478 T3 0.000 0.501 0.118 0.000 0.028 0.996 T4 0.000 0.378 0.151 0.000 0.085 0.603 T5 0.002 0.294 0.436 0.012 0.070 0.134 T6 0.015 0.685 0.942 0.086 0.140 0.793 FZ 0.001 0.995 0.041 0.000 0.027 0.597
CZ 0.791 0.786 0.866 0.801 0.341 0.734
PZ 0.044 0.515 0.256 0.028 0.233 0.608
Figure 2 Topography of delta frequency band (tasks to control ratio)
Table 5 T-test value between control and VT-EDEM task
Delta Theta Alpha Beta Gamma High Gamma
Fp1 0.000 0.641 0.020 0.019 0.015 0.011 Fp2 0.001 0.447 0.026 0.009 0.008 0.004 F3 0.005 0.799 0.639 0.007 0.008 0.003 F4 0.001 0.559 0.977 0.001 0.000 0.000
C3 0.063 0.331 0.698 0.008 0.008 0.019
C4 0.032 0.252 0.747 0.002 0.004 0.013
P3 0.133 0.160 0.390 0.091 0.020 0.005
P4 0.276 0.476 0.483 0.440 0.025 0.063
O1 0.117 0.930 0.106 0.111 0.002 0.013
O2 0.533 0.924 0.146 0.306 0.035 0.078
F7 0.023 0.398 0.312 0.019 0.016 0.019
F8 0.000 0.068 0.023 0.003 0.003 0.037
T3 0.003 0.587 0.702 0.019 0.068 0.050
T4 0.008 0.673 0.611 0.016 0.045 0.075
T5 0.032 0.730 0.178 0.075 0.016 0.003
T6 0.289 0.717 0.058 0.254 0.025 0.024
FZ 0.220 0.152 0.724 0.748 0.098 0.026
CZ 0.412 0.826 0.129 0.509 0.055 0.051
PZ 0.125 0.765 0.955 0.140 0.050 0.172
Figure 3 Topography of alpha frequency band (tasks to control ratio)
Figure 4 Topography of beta frequency band (tasks to control ratio)
x-axis from left: Control VT-NT VT-ED VT-EM VT-EDEM Tasks
y-axis: Beta frequency band ratio to control *: P<0.001
**
**
*
*
*
*
*
*
*
x-axis from left: Control VT-NT VT-ED VT-EM VT-EDEM Tasks
y-axis: Alpha frequency band ratio to control *: P<0.001
x-axis from left: Control VT-NT VT-ED VT-EM VT-EDEM Tasks
y-axis: Delta frequency band ratio to control *: P<0.001
**
**
* *
*
Figure 5 Topography of gamma frequency band (tasks to control ratio)
Figure 6 Topography of high-gamma frequency band (tasks to control ratio)
4.0 CONCLUSION
Based on these findings, eye therapy may have a positive effect on reducing visual stress during a word search in text on a computer screen. However, possibility of the outcomes is due to the inherent bias because of task sequence cannot be rule out and further investigation is needed in this aspect. Nevertheless, these findings may suggest that eye therapy may be suitable for enhancing eye and brain performance, as in this modern world, facing a computer screen for long periods of time is the norm.
Acknowledgement
The authors appreciatively acknowledge the support of the Malaysian Ministry of Higher Education (MOHE) and Universiti Teknologi Malaysia (UTM) who sponsored this
research through FRGS Research Grant No.
R.J130000.7823.4F185 and GUP Research Grant No. Q.J130000.2523.05H38.
References
[1] P. Wolkoff, J. K. Nojgaard, C. Frank, P. Skov. 2006. The Modern Office Environment Desiccates the Eyes. Indoor Air. 16(4): 258–265. [2] P. S. Savolainen. 1998. Evaluation of Cytotoxicity of Various
Ophthalmic Drugs, Eye Drop Recipients and Cyclodextrins in an Immortalized Human Corneal Epithelial Cell Line. Pharmacy. 30(7): 1–6.
[3] A. White and E. Ernst. 2004. A Brief History of Acupuncture. Rheumatology. Oxford. 43(5): 662–663.
[4] Q. Pankhurst and J. Connolly. 2003. Applications of Magnetic Nanoparticles in Biomedicine. Journal of Physics D. 167(2): 167–183. [5] N. M. Safri, N, Murayama, Y. Hayasihda, T. Igasaki. 2007. Effects of
Concurrent Visual Tasks on Cortico-Muscular Synchronization in Humans. Brain Research. 1155: 81–92.
[6] N. R. Cooper, R. J. Croft, S. J. J. Dominey. 2003. In: Burgess, A.P., Gruzelier, J. H. (Eds.). Paradox Lost? Exploring the Role of Alpha Oscillations during Externally vs. Internally Directed Attention and the Implications for Idling and Inhibition Hypotheses. International Journal of Psychophysiology. 47: 65–74.
[7] L. M. Ward. 2003. Synchronous Neural Oscillations And Cognitive Processes. Trends Cognitive Science. 7: 553–559.
[8] J. Kaiser and W. Lutzenberger. 2003. Induced Gamma-Band Activity and Human Brain Function. Neuroscientist. 9(6): 475–484.
x-axis from left: Control VT-NT VT-ED VT-EM VT-EDEM Tasks
y-axis: Gamma frequency band ratio to control *: P<0.001
x-axis from left: Control VT-NT VT-ED VT-EM VT-EDEM Tasks
y-axis: High-gamma frequency band ratio to control *: P<0.001


