DBS Group Holdings Ltd Incorporated in the Republic of Singapore Company Registration Number: 199901152M
To: Shareholders
The DBS Group Holdings Ltd (“DBSH” or “the Company”) Board of Directors report unaudited financial results for the second quarter ended June 30, 2005.
For the second quarter of 2005, the Directors have declared, for each DBSH non-voting convertible preference share (“CPS”), each DBSH non-voting redeemable CPS, and for each DBSH ordinary share, an interim gross dividend of 15 cents (first quarter 2005 : 11 cents ; first half 2004 : 18 cents).
The second quarter 2005 dividends will be paid less 20% Singapore income tax.
The second quarter 2005 dividends will be payable on August 26, 2005. Notice is hereby given that the Share Transfer Books and Register of Members of the Company will be closed on August 16, 2005 to August 17, 2005, both dates inclusive. Duly completed transfers received by the Company's Registrar, Barbinder & Co Pte Ltd of 8 Cross Street #11-00 PWC Building, Singapore 048424 up to 5.00 p.m. on August 15, 2005 will be registered to determine shareholders' entitlement to the second quarter 2005 dividends. In respect of ordinary shares in the securities accounts with The Central Depository (Pte) Limited (“CDP”), the second quarter 2005 dividends will be paid by DBSH to CDP, which will in turn distribute the dividend entitlements to shareholders.
By order of the Board Heng Lee Cheng (Ms) Group Secretary July 29, 2005 Singapore
Performance Summary
Contents
Page
Financial Highlights 2
Change in Accounting Policies 3
Financial Review 3
Net Interest Income and Net Interest Margin 5
Non-Interest Income 6
Operating Expenses 7
Provision Charge 7
Balance Sheet 8
Asset Quality 8
Customer Loans 10
Deposits 11
Capital Adequacy Ratio 12
Unrealised Valuation Surpluses 12
Business Segment Analysis 13
Geographical Segment Analysis 17
Comparatives 17
Appendix I: Unaudited Consolidated Profit and Loss Account
Appendix II: Unaudited Consolidated Balance Sheet
Appendix III: Unaudited Balance Sheet of DBS Group Holdings Ltd
Appendix IV: Unaudited Statements of Changes in Shareholders’ Equity
Appendix V: Unaudited Consolidated Cash Flow Statement
Appendix VI: Selected Notes to the Accounts
1. Issuance of Ordinary Shares
2. Non-Performing Loans and Provisions 3. Value at Risk and Trading Income 4. Change in Accounting Policies
Financial Highlights
DBS Group Holdings Ltd (“DBSH”) prepares its consolidated DBSH Group (“Group”) financial statements in accordance with Singapore Financial Reporting Standards (“FRS”).
In $ millions
Operating income 1,092 1,566 (30) 1,078 2,170 2,842 (24)
Operating profit before provisions and
goodwill amortisation 592 1,072 (45) 567 1,159 1,832 (37)
Net profit attributable to equity holders of the
parent (before goodwill amortisation) 441 951 (54) 412 853 1,543 (45) Net profit attributable to equity holders of the
parent 441 841 (48) 412 853 1,323 (36)
At period-end
Equity attributable to equity holders of the
parent 17,040 15,964 7 16,848 17,040 15,964 7
Customer loans 1/ 78,712 65,048 21 71,055 78,712 65,048 21
Customer deposits 115,933 108,179 7 115,931 115,933 108,179 7
Total assets 183,674 168,070 9 182,239 183,674 168,070 9
Per share (in $)
Basic earnings excluding goodwill
amortisation 2/ 1.17 1.54 (24) 1.09 1.13 1.73 (35)
Basic earnings 2/ 1.17 1.24 (6) 1.09 1.13 1.44 (22)
Diluted earnings 2/ 1.12 1.20 (7) 1.06 1.09 1.38 (21)
Net asset value at period-end 3/
(i) based on existing ordinary share capital 11.11 10.41 7 10.99 11.11 10.41 7 (ii) assuming non-voting convertible
preference shares (“CPS”) and non-voting redeemable CPS are converted to
ordinary shares 10.92 10.25 7 10.80 10.92 10.25 7
Performance ratios On a GAAP basis
Return on assets 2/ 0.96 1.07 0.92 0.95 1.30
Return on equity 2/ 3/ 10.42 11.97 9.91 10.20 13.97
Excluding goodwill amortisation
Return on assets 2/ 0.96 1.33 0.92 0.95 1.56
Return on equity 2/ 3/ 10.42 14.78 9.91 10.20 16.83
Efficiency and revenue mix ratios Cost-to-income ratio (excluding goodwill
amortisation) 45.8 31.5 47.4 46.6 35.5
As a percentage of total operating income:
- net interest income 63.6 42.1 62.2 62.9 45.7
- non-interest income 36.4 57.9 37.8 37.1 54.3
Capital adequacy ratios (at period-end)
Change in Accounting Policies
DBSH Group changed its accounting policy for investments in joint venture companies during the quarter. The accounting policy change was applied retrospectively, and the comparable financial results were restated to conform to the new policy. The change relates to the presentation of DBSH Group’s share of joint venture companies’ results in the Group results, and does not impact after tax profits and retained earnings. Please see Appendix VI, note 4 for details.
Financial Review
DBSH Group’s net profit attributable to shareholders (“net profit”) was $441 million for second quarter 2005, up 28% excluding one-time gains recognised in second quarter 2004 of $497 million from DBS Thai Danu Bank Public Company Limited (“DTDB”) merger and the divestment of the Group’s stake in Wing Lung Bank. Including such gains, net profit declined 48%.
Compared to first quarter 2005, net profit for second quarter 2005 improved 7% as operating income grew and operating expenses fell, offset by an increase in provisions.
· Operating income of $1.092 billion was 2% higher than second quarter 2004 (excluding one-time gains)
due to a 5% increase in net interest income, offset by lower non-interest income. Compared to first quarter 2005, operating income improved marginally by 1% as the 4% increase in net interest income was offset by a 3% drop in non-interest income. Improved asset mix as well as an expanded loan base contributed primarily to the higher net interest income. Net interest margins improved 2 basis points from first quarter 2005 to 1.80%. Non-interest income fell in second quarter 2005 due to lower net gains from treasury-related activities, cushioned by the strong growth in fee and commission income. Fee income rose 18% from a year ago and 15% from the previous quarter.
· Operating expenses remained largely unchanged from both comparative quarters. The marginally
higher expenses compared to the same quarter last year was due to wage cost increases offset by lower non-staff expenses. Compared to operating expenses incurred in the previous quarter, the 2% decline in second quarter 2005 was due to lower staff expenses.
· Cost-to-income ratio improved to 45.8% for second quarter 2005, compared to 46.2% for second
quarter 2004 (excluding one-time gains from operating income) and 47.4% for first quarter 2005.
· Provision charge of $81 million for second quarter 2005 was higher than the $14 million in the
Profit and Loss Account 1/
Net interest income 695 659 5 670 1,365 1,299 5
Non-interest income 397 907 (56) 408 805 1,543 (48)
Operating income 1,092 1,566 (30) 1,078 2,170 2,842 (24)
Operating expenses (500) (494) 1 (511) (1,011) (1,010) 0
Operating profit before provisions 2/ 592 1,072 (45) 567 1,159 1,832 (37)
Provisions (81) (14) >100 (63) (144) (65) >100
Operating profit 2/ 511 1,058 (52) 504 1,015 1,767 (43)
Share of profits less losses of associated
companies 22 19 16 12 34 34
-Net profit before taxation 2/ 533 1,077 (51) 516 1,049 1,801 (42)
Taxation (79) (113) (30) (91) (170) (232) (27)
Net profit after taxation 2/ 454 964 (53) 425 879 1,569 (44)
Minority interests (13) (13) - (13) (26) (26)
-Net profit attributable to equity holders of
the parent (before goodwill amortisation) 441 951 (54) 412 853 1,543 (45)
Goodwill amortisation - (110) NM - - (220) NM
Net profit attributable to equity holders of
the parent 441 841 (48) 412 853 1,323 (36)
NM: Not meaningful Notes:
1/ Figures for prior periods have been restated to reflect the change in accounting policies (Appendix VI, note 4)
2/ Goodwill amortisation in 2004 are excluded from these profit numbers to allow better comparability with second quarter 2005 and first half 2005 3/ Excluding one-timegains of $497 million, the following profit and loss items would have been:
In $ millions
Non-interest income 397 410 (3) 408 805 1,046 (23)
Operating income 1,092 1,069 2 1,078 2,170 2,345 (7)
Net profit attributable to equity shareholders of the
parent (before goodwill amortisation) 441 454 (3) 412 853 1,046 (18)
Goodwill amortisation - (110) NM - - (220) NM
Net profit attributable to equity shareholders of the
parent 441 344 28 412 853 826 3
Net Interest Income and Net Interest Margin
Table 1
Group Net Interest Income and Net Interest Margin 1/
2nd Qtr 2005 2nd Qtr 2004 1st Qtr 2005
In $ millions
advances 74,336 724 3.91 67,107 576 3.45 70,876 616 3.52
Interbank items 30,806 169 2.20 32,906 100 1.22 35,554 181 2.06
Securities 2/ 49,483 425 3.45 46,292 330 2.87 46,602 380 3.31
Total interest bearing assets 154,625 1,318 3.42 146,305 1,006 2.77 153,032 1,177 3.12
Deposits 116,310 335 1.16 111,529 172 0.62 114,953 264 0.93
Others 33,312 288 3.47 30,787 175 2.29 33,273 243 2.96
Total interest bearing liabilities 149,622 623 1.67 142,316 347 0.98 148,226 507 1.39
Net interest income/margin 695 1.80 659 1.81 670 1.78
1st Half 2005 1st Half 2004
In $ millions
advances 72,828 1,340 3.71 66,513 1,145 3.46
Interbank items 32,829 350 2.15 32,936 189 1.16
Securities 3/
48,066 805 3.38 44,329 632 2.87
Total interest bearing assets 153,723 2,495 3.27 143,778 1,966 2.75
Deposits 115,589 599 1.05 111,146 338 0.61
Others 33,209 531 3.22 28,997 329 2.28
Total interest bearing liabilities 148,798 1,130 1.53 140,143 667 0.96
Net interest income/margin 1,365 1.79 1,299 1.81
Notes:
1/ Net interest margin is net interest income expressed as a percentage of average interest-earning assets. It is computed on an annualised basis. 2/ Refers to Singapore Government securities and treasury bills, trading and investment debt securities.
Exhibit 1
Group Net Interest Income and Net Interest Margin 2 ,6 7 8
Net interest income grew 5% over second quarter 2004 to $695 million in second quarter 2005, or 10% higher if net interest income of DTDBwas excluded from second quarter 2004. Compared to first quarter 2005, net interest income increased 4%.
· The increase in net interest income was largely due to growth in volume of interest bearing assets, as
end-period customer loans grew 21% year-on-year and 11% over end March 2005.
· Net interest margin for second quarter 2005 was 1.80%, slightly lower than 1.81% for second quarter
2004 which had included higher net interest contribution from DTDB. Compared to first quarter 2005, net interest margin improved 2 basis points with more surplus funds deployed to higher yielding customer loans and debt securities.
Non-Interest Income
Table 2
Group Non-Interest Income
In $ millions
2nd Qtr 2005
2nd Qtr 2004 +/(-)%
1st Qtr 2005
1st Half 2005
1st Half 2004
+/(-) % Fee and commission income
Stockbroking 36 44 (18) 47 83 113 (27)
Investment banking 37 22 68 23 60 48 25
Trade and remittances 46 42 10 39 85 79 8
Loan related 55 40 38 45 100 85 18
Guarantees 6 7 (14) 7 13 14 (7)
Deposit related 19 21 (10) 19 38 42 (10)
Credit card 25 21 19 18 43 43
Fund management 19 13 46 10 29 24 21
Wealth management 37 24 54 37 74 58 28
Others 10 11 (9) 8 18 19 (5)
Total 290 245 18 253 543 525 3
Dividend and rental income 36 44 (18) 13 49 58 (16)
Other income
Net gain on treasury related activities 27 101 (73) 112 139 353 (61)
Net gain on investment securities 40 512 (92) 25 65 598 (89)
Net gain on fixed assets 1 3 (67) 3 4 5 (20)
Others 3 2 50 2 5 4 25
Total 71 618 (89) 142 213 960 (78)
Total non-interest income 397 907 (56) 408 805 1,543 (48)
Non-interest income as a percentage of
operating income (%) 36.4 57.9 37.8 37.1 54.3
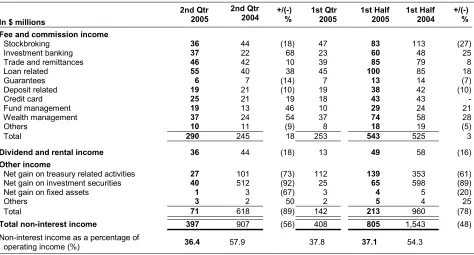
Non-interest income in second quarter 2005 declined 3% to $397 million compared to both the second quarter 2004 (excluding the $497 million one-time gains) and first quarter 2005.
· Fee and commission income in the second quarter 2005 registered strong growth of 18% to $290
million compared to the same quarter last year, principally due to higher fees earned from loan related activities, wealth management and investment banking services. Compared to first quarter 2005, fee and commission income grew 15% despite lower stockbroking fees, and the increases came from investment banking, credit card, fund management and loan related fees.
· Dividend and rental income increased to $36 million for second quarter 2005.
Operating Expenses
Staff costs 253 232 9 265 518 488 6
Occupancy expenses 43 46 (7) 43 86 92 (7)
Computerisation expenses 71 79 (10) 74 145 156 (7)
Revenue-related expenses 44 48 (8) 47 91 103 (12)
Others 89 89 - 82 171 171
-Total operating expenses 500 494 1 511 1,011 1,010
-Cost-to-income ratio (%)
45.8 31.5 1/
47.4 46.6 35.5 1/
Staff headcount number (at period-end) 12,090 10,838 11,649 12,090 10,838
Note:
1/ Income includes one-time gains of $497 million.
Operating expenses remained largely unchanged from both comparative quarters.
· Operating expenses for second quarter 2005 increased marginally by 1% to $500 million over second quarter 2004. Staff costs rose 9% arising from salary increments and increased headcount, offset by lower computerisation and revenue-related expenses. Revenue-related expenses were lower as commission expenses paid declined in tandem with business volume.
· Compared to first quarter 2005, operating expenses fell 2%.
· Staff headcount at end June 2005 was 12,090, a 4% increase over end March 2005.
Provision Charge
Securities, properties and other assets 9 14 (36) 4 13 15 (13)
Total Specific provision 60 41 46 48 108 72 50
General provision 21 (27) NM 15 36 (7) NM
Total provision charge 81 14 >100 63 144 65 >100
SP (loans) / Average loan (basis point) 27 16 25 25 17
NM: Not meaningful
Total provision charge for second quarter 2005 was $81 million, compared to $14 million for second quarter 2004 and $63 million for first quarter 2005.
· Specific provision charge for loans in second quarter 2005 increased 89% to $51 million compared to the same quarter last year. This was mainly due to lower charge in second quarter 2004 arising from loan recoveries. Compared to first quarter 2005, specific provision charge for loans increased 16%. For the above comparative periods, the increase in specific provisions came from loans in Singapore and overseas branches.
· General provision charge for second quarter 2005 was $21 million, compared to a $27 million
Balance Sheet
Table 5
Group Key Balance Sheet Items In $ millions
Total assets 183,674 182,239 175,438 168,070
Customer loans 1/
78,712 71,055 69,659 65,048
Customer deposits 115,933 115,931 113,206 108,179
Loan-to-deposit ratio (%) 67.9 61.3 61.5 60.1
Loan and non-trading debt securities-to-deposit ratio (%) 88.7 81.4 82.0 81.0
Note:
1/ After deducting cumulative provisions.
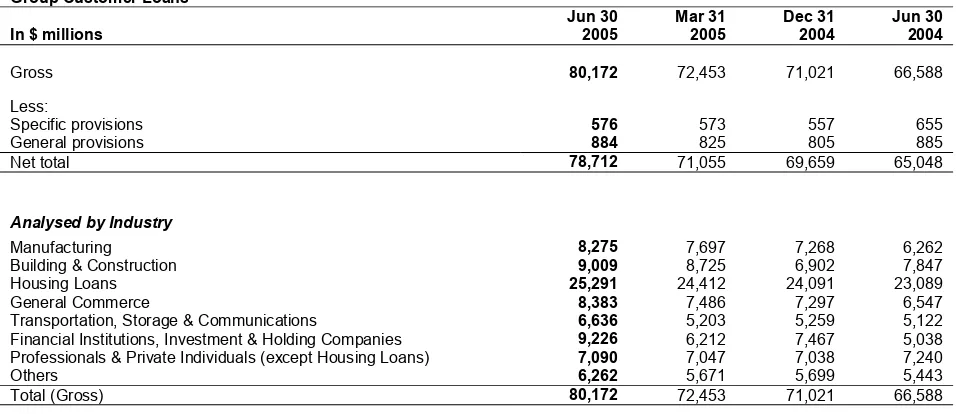
At June 30, 2005, total assets were $183.7 billion.
· Compared to end March 2005, customer loans grew 11% to $78.7 billion, with increases registered across all sectors. Customer deposits remained stable at $115.9 billion.
· The Group’s loan-to-deposit ratio improved to 67.9% at end June 2005. Including non-trading debt securities, the ratio of loan and non-trading debt securities to deposits was 88.7%.
Asset Quality
Exhibit 2
Group Non-Performing Loans
Table 6
Group Geographical NPL Rate (Based on MAS standard) (%)
Singapore 2.1 2.3 2.2 2.4
Hong Kong 1.8 1.8 2.0 2.3
South and
Southeast Asia 4.6 5.5 6.3 14.6
Rest of Greater
1/ NPL rate is computed based on total non-bank customer NPLs (excluding non-performing debt securities and contingent items) divided by total gross non-bank customer loans.
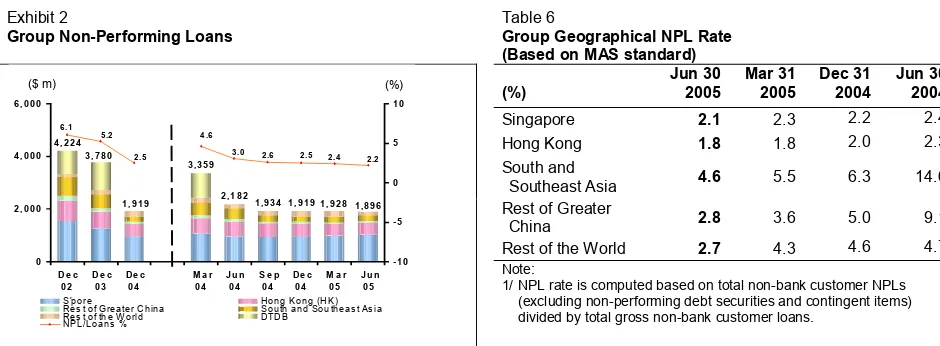
· Non-performing loans (“NPLs”) continued to trend downwards to $1.9 billion at end June 2005. Out of the $1.9 billion NPLs, $0.6 billion or 30% were restructured NPLs.
· Singapore NPLs were $1 billion and accounted for 53% of the Group’s NPLs, while Hong Kong NPLs
of $0.5 billion accounted for 25%.
· The ratio of NPLs to the total non-bank loans (“NPL rate”) further improved from 2.4% at end March 2005 to 2.2% at end June 2005. NPL rates across countries were either stable or improved.
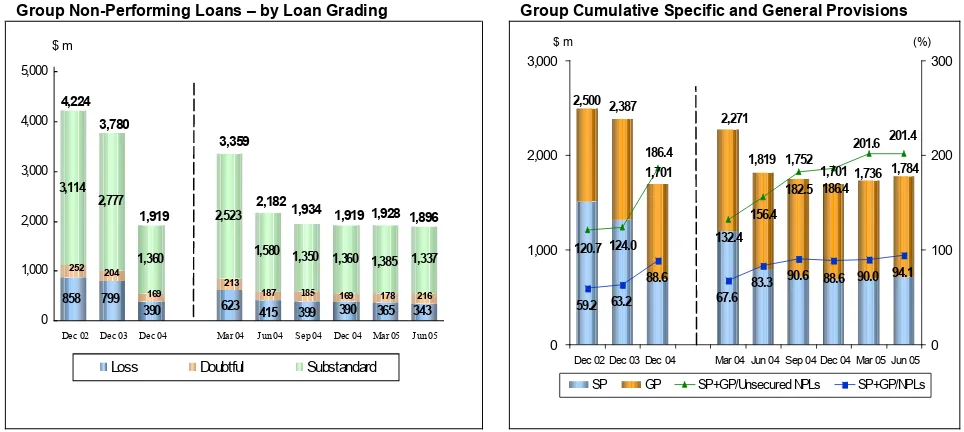
Loan Grading
Of the total $1.9 billion NPLs at end June 2005, 71% were classified as substandard, 11% as doubtful and the remaining 18% in the loss category. 53% of the NPLs were secured by collateral.
Cumulative Specific and General Provisions
Total cumulative specific and general provisions at end June 2005 were 201.4% of unsecured NPLs, and 94.1% of total NPLs.
Exhibit 3
Group Non-Performing Loans – by Loan Grading
Exhibit 4
Group Cumulative Specific and General Provisions $ m
187 185 169 178
1,385 1,337
83.3 90.6 90.0 94.1 186.4 201.6
SP GP SP+GP/Unsecured NPLs SP+GP/NPLs
Restructured Loans
Table 7
Loans that were restructured and classified
Jun 30, 2005 Mar 31, 2005 Dec 31, 2004 Jun 30, 2004 In $ millions NPLs
Specific
Substandard 503 96 531 106 351 34 416 41
Doubtful 19 19 11 11 10 10 19 17
Loss 45 45 45 44 58 58 77 76
Total 567 160 587 161 419 102 512 134
Table 8
Group Customer Loans In $ millions
Jun 30 2005
Mar 31 2005
Dec 31 2004
Jun 30 2004
Gross 80,172 72,453 71,021 66,588
Less:
Specific provisions 576 573 557 655
General provisions 884 825 805 885
Net total 78,712 71,055 69,659 65,048
Analysed by Industry
Manufacturing 8,275 7,697 7,268 6,262
Building & Construction 9,009 8,725 6,902 7,847
Housing Loans 25,291 24,412 24,091 23,089
General Commerce 8,383 7,486 7,297 6,547
Transportation, Storage & Communications 6,636 5,203 5,259 5,122
Financial Institutions, Investment & Holding Companies 9,226 6,212 7,467 5,038
Professionals & Private Individuals (except Housing Loans) 7,090 7,047 7,038 7,240
Others 6,262 5,671 5,699 5,443
Total (Gross) 80,172 72,453 71,021 66,588
Analysed by Currency and Fixed / Variable Rates
Fixed rate 1/
Singapore dollar 9,804 10,235 10,046 9,424
Hong Kong dollar 464 498 458 245
US dollar 109 218 82 1
Others 240 241 342 187
Sub-total 10,617 11,192 10,928 9,857
Variable rate 2/
Singapore dollar 26,177 24,184 23,899 21,577
Hong Kong dollar 23,639 22,557 21,432 21,434
US dollar 14,890 10,612 10,464 10,028
Others 4,849 3,908 4,298 3,692
Sub-total 69,555 61,261 60,093 56,731
Total (Gross) 80,172 72,453 71,021 66,588
Notes:
1/ Fixed rate loans refer to long-term loans where the interest rates are fixed for the initial 1 to 3 years for certain mortgage loans, and over the entire loan period for other loans.
Table 9
Total Group Deposits In $ millions
Jun 30 2005
Mar 31 2005
Dec 31 2004
Jun 30 2004
Deposits of non-bank customers 115,933 115,931 113,206 108,179
Deposits and balances of banks 12,053 13,708 10,939 10,286
Total 127,986 129,639 124,145 118,465
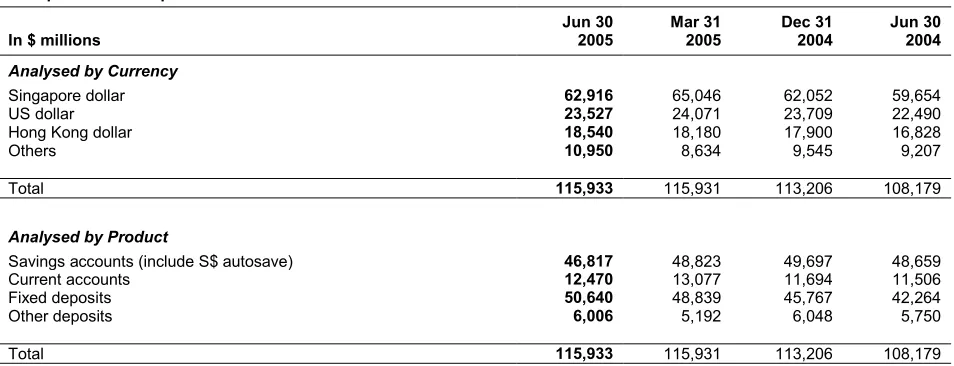
Table 10
Group Customer Deposits In $ millions
Jun 30 2005
Mar 31 2005
Dec 31 2004
Jun 30 2004
Analysed by Currency
Singapore dollar 62,916 65,046 62,052 59,654
US dollar 23,527 24,071 23,709 22,490
Hong Kong dollar 18,540 18,180 17,900 16,828
Others 10,950 8,634 9,545 9,207
Total 115,933 115,931 113,206 108,179
Analysed by Product
Savings accounts (include S$ autosave) 46,817 48,823 49,697 48,659
Current accounts 12,470 13,077 11,694 11,506
Fixed deposits 50,640 48,839 45,767 42,264
Other deposits 6,006 5,192 6,048 5,750
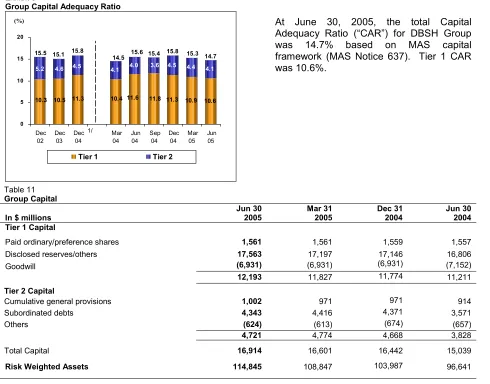
Capital Adequacy Ratio
Exhibit 5
Group Capital Adequacy Ratio
11.3 10.9 10.6
4.0 4.5 4.4
4.1
10.3 10.5 11.3 10.4 11.6 11.8
4.6 4.5 4.1
5.2 3.6
15.5 15.1 15.8 14.5 15.6 15.4 15.8 15.3 14.7
0
At June 30, 2005, the total Capital Adequacy Ratio (“CAR”) for DBSH Group was 14.7% based on MAS capital framework (MAS Notice 637). Tier 1 CAR was 10.6%.
Paid ordinary/preference shares 1,561 1,561 1,559 1,557
Disclosed reserves/others 17,563 17,197 17,146 16,806
Goodwill (6,931) (6,931) (6,931) (7,152)
12,193 11,827 11,774 11,211
Tier 2 Capital
Cumulative general provisions 1,002 971 971 914
Subordinated debts 4,343 4,416 4,371 3,571
Others (624) (613) (674) (657)
4,721 4,774 4,668 3,828
Total Capital 16,914 16,601 16,442 15,039
Risk Weighted Assets 114,845 108,847 103,987 96,641
Note:
1/ With effect from 2004, ratios were computed based on MAS Notice 637. Comparatives for 2003 and before were not restated and were computed using the Bank for International Settlements (“BIS”) guidelines.
Unrealised Valuation Surpluses
Table 12
Group Unrealised Valuation Surpluses In $ millions
Properties 751 734 653 538
Quoted investments 40 601/ 531 182
Total 791 794 1,184 720
Note:
1/ The decline in unrealised valuation surpluses of quoted investments from end December 2004 was mainly due to the recognition of fair value changes in available-for-sale investments in balance sheet reserves with the adoption of FRS 39 from January 1, 2005.
(%)
Business Segment Analysis
The business segment results represent the customer segments of the respective businesses and are determined by:
· Income and direct expenses attributable to each customer and other segment; and
· Management accounting policies relating to the allocation of indirect expenses and funds transfer pricing between the central treasury unit and customer/other segments.
The various customer segments are described below, along with a description of the change in net profit after taxation for second quarter 2005 over second quarter 2004 and for first half 2005 over first half 2004.
· Consumer Banking
Consumer Banking provides individual customers with a diverse range of banking and related financial services. The products and services offered to customers include current and savings accounts, loans and home finance, cards, payments and investment products.
Quarter-on-quarter, the increase in net profit after taxation ($48 million, 43%) was mainly due to higher net interest income resulting from increased deposit volumes and margins.
Year-on-year, the increase in net profit after taxation ($78 million, 34%) was mainly due to higher net interest income resulting from increased deposit volumes and margins.
· Enterprise Banking
Enterprise Banking provides financial services and products to small and medium-sized businesses. The products and services offered to customers include credit facilities (overdraft, factoring/accounts receivable purchase, trade services and financing, commercial/industrial property financing, hire purchase and government financing and assistance schemes), deposit, payment and collection services and treasury products.
Net profit after taxation was in line with second quarter 2004.
Year-on-year, the increase in net profit after taxation ($5 million, 3%) was mainly attributable to strong loan and deposit growth.
· Corporate and Investment Banking
Corporate and Investment Banking provides tailored and unique financial solutions to large corporate and institutional clients. The products and services offered to customers include direct lending, corporate finance and advisory banking services for mergers and acquisitions, capital raising through debt and equity markets, capital restructuring, syndicated finance, securities and fiduciary services, cash management and trade services, and private equity.
Quarter-on-quarter, the increase in net profit after taxation ($2 million, 2%) was mainly due to higher fee income from syndication and capital market activities.
The other segments of the analysis are:
· Global Financial Markets
Global Financial Markets provides treasury services to corporations, institutional and private investors, financial institutions and other market participants. It is primarily involved in market making, structuring, equity and debt sales and trading across a broad range of financial products including foreign exchange, interest rate/credit/equity and other structured derivatives. Income from financial products and services relating to other customer segments, e.g. Consumer Banking, Enterprise Banking and Corporate and Investment Banking, is reflected in the respective customer segments.
Global Financial Markets also provides equity services through DBS Vickers Securities (“DBSV”). DBSV offers a wide range of services including research, sales and trading for institutional, corporate and private clients and share placement.
Quarter-on-quarter, the decrease in net profit after taxation ($9 million, 15%) was largely due to lower gains from foreign exchange, equity and interest rate products.
Year-on-year, the decrease in net profit after taxation ($205 million, 65%) was largely due to lower gains from foreign exchange, equity and interest rate products.
· Central Treasury Unit
Central Treasury Unit is responsible for the management of the Group's asset and liability interest rate positions and investment of the Group's excess liquidity and shareholders’ funds.
Quarter-on-quarter, the decrease in net profit after taxation ($37 million, 54%) was due to lower gapping income resulting from flattening of interest rate yield curves.
Year-on-year, the decrease in net profit after taxation ($77 million, 52%) was due to lower gapping income resulting from flattening of interest rate yield curves and first quarter 2004 benefiting from profit on sales of bonds.
· Central Operations
Central Operations encompasses a range of activities resulting from central corporate decisions and the related income and expenses not attributed to business segments. These include funding costs of DBSH Group’s associated and subsidiary companies and gains/losses on properties. Private banking activities and asset management activities are included in this segment.
The following table analyses the results, total assets and total liabilities by business segments:
Table 13
Group Business Segments (2nd Qtr 2005)
In $ millions Consumer
Banking
Operating income 423 178 230 143 55 63 1,092
Operating profit before provisions and goodwill
amortisation 203 109 153 49 47 31 592
Net profit before taxation and goodwill amortisation 198 83 128 62 45 17 533
Taxation (39) (15) (20) (12) (14) 21 (79)
Net profit after taxation and before goodwill
amortisation 159 68 108 50 31 25 441
Goodwill amortisation
-Net profit attributable to equity holders of the parent 441
Other Information
Total assets before goodwill 30,068 18,251 30,544 71,125 23,225 3,530 176,743
Goodwill 6,931
Total assets 183,674
Total liabilities 66,995 16,822 13,876 44,073 2,122 21,614 165,502
Capital expenditure 3 3 2 6 2 10 26
Depreciation 7 4 1 5 2 20 39
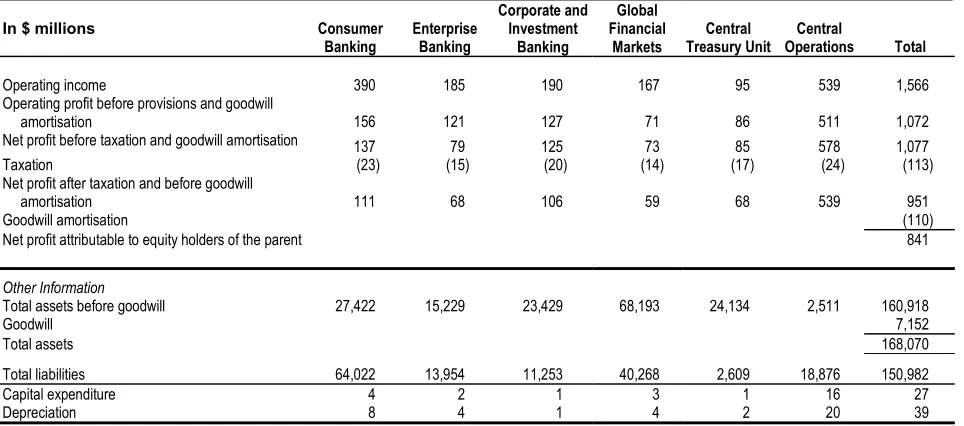
Group Business Segments (2nd Qtr 2004)
In $ millions Consumer
Banking
Operating income 390 185 190 167 95 539 1,566
Operating profit before provisions and goodwill
amortisation 156 121 127 71 86 511 1,072
Net profit before taxation and goodwill amortisation 137 79 125 73 85 578 1,077
Taxation (23) (15) (20) (14) (17) (24) (113)
Net profit after taxation and before goodwill
amortisation 111 68 106 59 68 539 951
Goodwill amortisation (110)
Net profit attributable to equity holders of the parent 841
Other Information
Total assets before goodwill 27,422 15,229 23,429 68,193 24,134 2,511 160,918
Goodwill 7,152
Total assets 168,070
Total liabilities 64,022 13,954 11,253 40,268 2,609 18,876 150,982
Capital expenditure 4 2 1 3 1 16 27
Table 13
Group Business Segments (1st Half 2005)
In $ millions Consumer
Banking
Operating income 840 360 403 314 101 152 2,170
Operating profit before provisions and goodwill
amortisation 397 224 255 111 86 86 1,159
Net profit before taxation and goodwill amortisation 383 184 214 137 89 42 1,049
Taxation (74) (33) (36) (26) (17) 16 (170)
Net profit after taxation and before goodwill
amortisation 309 151 178 111 72 32 853
Goodwill amortisation
-Net profit attributable to equity holders of the parent 853
Other Information
Total assets before goodwill 30,068 18,251 30,544 71,125 23,225 3,530 176,743
Goodwill 6,931
Total assets 183,674
Total liabilities 66,995 16,822 13,876 44,073 2,122 21,614 165,502
Capital expenditure 10 4 3 8 2 20 47
Depreciation 15 8 2 10 4 38 77
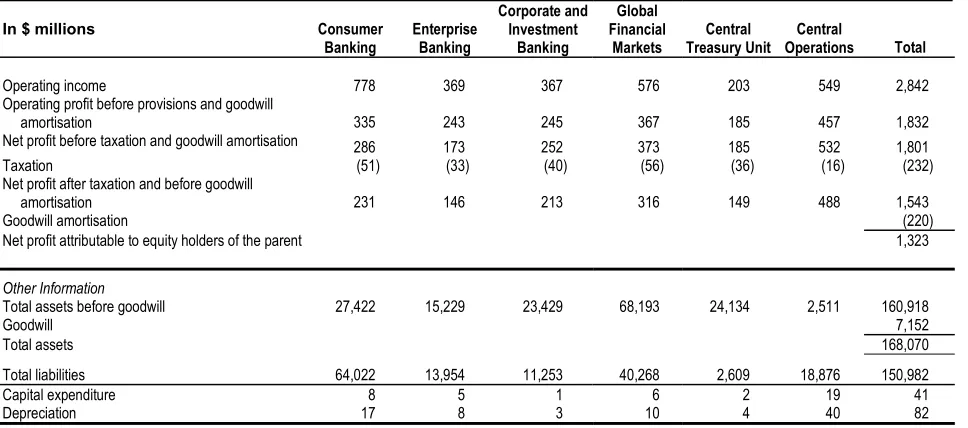
Group Business Segments (1st Half 2004)
In $ millions Consumer
Banking
Operating income 778 369 367 576 203 549 2,842
Operating profit before provisions and goodwill
amortisation 335 243 245 367 185 457 1,832
Net profit before taxation and goodwill amortisation 286 173 252 373 185 532 1,801
Taxation (51) (33) (40) (56) (36) (16) (232)
Net profit after taxation and before goodwill
amortisation 231 146 213 316 149 488 1,543
Goodwill amortisation (220)
Net profit attributable to equity holders of the parent 1,323
Other Information
Total assets before goodwill 27,422 15,229 23,429 68,193 24,134 2,511 160,918
Goodwill 7,152
Total assets 168,070
Total liabilities 64,022 13,954 11,253 40,268 2,609 18,876 150,982
Capital expenditure 8 5 1 6 2 19 41
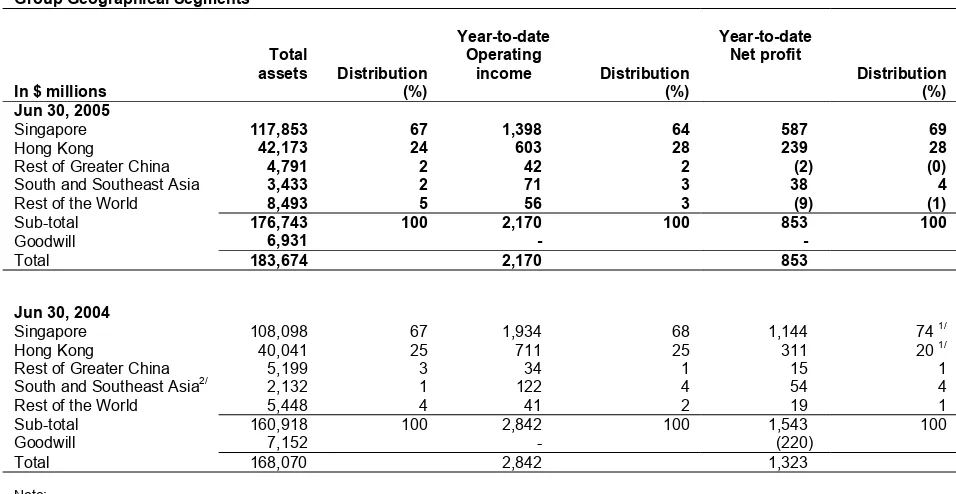
Geographical Segment Analysis
The following table analyses total assets, operating income and net profit by geographical segments. Unless otherwise stated, the analysis of geographical segments is generally based on the location of the office recording the transactions. The total assets, operating income and net profit are stated after elimination of inter-group assets and revenues.
Table 14
Group Geographical Segments
In $ millions
Total
assets Distribution (%)
Year-to-date Operating
income Distribution (%)
Year-to-date Net profit
Distribution (%) Jun 30, 2005
Singapore 117,853 67 1,398 64 587 69
Hong Kong 42,173 24 603 28 239 28
Rest of Greater China 4,791 2 42 2 (2) (0)
South and Southeast Asia 3,433 2 71 3 38 4
Rest of the World 8,493 5 56 3 (9) (1)
Sub-total 176,743 100 2,170 100 853 100
Goodwill 6,931 -
-Total 183,674 2,170 853
Jun 30, 2004
Singapore 108,098 67 1,934 68 1,144 74 1/
Hong Kong 40,041 25 711 25 311 20 1/
Rest of Greater China 5,199 3 34 1 15 1
South and Southeast Asia2/
2,132 1 122 4 54 4
Rest of the World 5,448 4 41 2 19 1
Sub-total 160,918 100 2,842 100 1,543 100
Goodwill 7,152 - (220)
Total 168,070 2,842 1,323
Note:
1/ Excluding one-time gains of $497 million, Singapore and Hong Kong’s contribution to the Group net profit were 62% and 30% respectively. 2/ Year-to-date operating income and net profit include contributions from DTDB, which was deconsolidated on June 25, 2004.
DBSH Group operates in five main geographical areas :
· “Singapore”,which includes operations generated in Singapore.
· “Hong Kong”, which includes branch and subsidiary operations in Hong Kong. · “Rest of Greater China”, which includes branch operations in China and Taiwan.
· “South and Southeast Asia”, which includes branch and subsidiary operations in India, Indonesia, Malaysia, Thailand and the Philippines.
· “Rest of the World”, which are mainly branch operations in South Korea, Japan, United States and United Kingdom.
Comparatives
DBS GROUP HOLDINGS LTD AND ITS SUBSIDIARY COMPANIES
Unaudited Consolidated Profit and Loss Account
1/In $ millions
2nd Qtr 2005
2nd Qtr 2004
+/(-) %
1st Qtr 2005
1st Half 2005
1st Half 2004
+/(-) %
Interest income 1,318 1,006 31 1,177 2,495 1,966 27
Less: Interest expense 623 347 80 507 1,130 667 69
Net interest income 695 659 5 670 1,365 1,299 5
Fee and commission income 290 245 18 253 543 525 3
Dividend income 29 36 (19) 5 34 41 (17)
Rental income 7 8 (13) 8 15 16 (6)
Other income 71 618 (89) 142 213 961 (78)
Operating income 1,092 1,566 (30) 1,078 2,170 2,842 (24)
Less: Staff costs 253 232 9 265 518 488 6
Depreciation 39 39 - 38 77 82 (6)
Other operating expenses 208 223 (7) 208 416 440 (5)
Goodwill amortisation - 110 NM - - 220 NM
Operating expenses 500 604 (17) 511 1,011 1,230 (18)
Operating profit before provisions 592 962 (38) 567 1,159 1,612 (28)
Less: Provision for loan losses and diminution in value of
other assets 81 14 >100 63 144 65 >100
Operating profit 511 948 (46) 504 1,015 1,547 (34)
Add: Share of profits less losses of associated companies
22 19 16 12 34 34
-Net profit before taxation 533 967 (45) 516 1,049 1,581 (34)
Less: Taxation 74 108 (31) 88 162 223 (27)
Share of taxation of associated companies 5 5 - 3 8 9 (11)
Net profit after taxation 454 854 (47) 425 879 1,349 35
Attributable to:
Equity holders of the parent 441 841 (48) 412 853 1,323 (36)
Minority interest 13 13 - 13 26 26
-454 854 (47) 425 879 1,349 (35)
DBS GROUP HOLDINGS LTD AND ITS SUBSIDIARY COMPANIES
Unaudited Consolidated Balance Sheet as at
1/Jun 30 Mar 31 Dec 31 Jun 30
In $ millions 2005 2005 2004 2004
Equity Attributable to Equity Holders of the Parent
Share capital 1,561 1,561 1,559 1,557 Share premium account 2,228 2,223 2,208 2,181 Treasury shares (117) (117) (126) (132) Non-distributable reserves 6,868 6,716 6,628 6,548 Revenue reserve 6,500 6,465 6,153 5,810
17,040 16,848 16,422 15,964
Minority Interests 1,132 1,141 1,128 1,124
TOTAL EQUITY 18,172 17,989 17,550 17,088
LIABILITIES
Deposits and balances of
banks 12,053 13,708 10,939 10,286 Deposits and other accounts
of non-bank customers 115,933 115,931 113,206 108,179 Bills payable 491 390 350 357 Current taxation 641 690 631 617 Deferred tax liabilities 56 61 62 72 Other liabilities 21,273 18,939 18,712 19,269 Other borrowings and debt
securities in issue 2/ 8,054 7,806 7,624 6,826 - due within one year 3,128 3,145 3,145 2,354 - due after one year 4,926 4,661 4,479 4,472
Subordinated term debts
(unsecured) 7,001 6,725 6,364 5,376 - due within one year - - - - due after one year 7,001 6,725 6,364 5,376
TOTAL EQUITY AND
LIABILITIES 183,674 182,239 175,438 168,070
OFF BALANCE SHEET ITEMS
Contingent liabilities 8,552 7,633 8,529 7,458 Commitments 79,387 75,964 70,774 67,870 Financial derivatives 1,576,375 1,570,828 1,518,507 1,549,064
Notes:
1/ Figures for prior periods have been restated to reflect the change in accounting policies (Appendix VI, note 4).
2/ Includes secured amount of $1,927 million as at June 30, 2005 (March 31, 2005: $1,826 million; December 31, 2004: $1,814 million; June 30, 2004: $1,497 million). These are mainly secured by properties and securities.
Jun 30 Mar 31 Dec 31 Jun 30
In $ millions 2005 2005 2004 2004
ASSETS
Cash, and balances and placements with central
banks 10,080 9,935 10,479 7,088 Singapore Government
securities and treasury
bills 11,626 11,470 11,194 13,627 Trading securities 16,788 14,347 11,695 11,431 Balances, placements with,
and loans and advances
to banks 17,529 27,851 25,169 24,829 Bills receivable from
non-bank customers 3,042 2,629 2,333 1,939 Loans and advances to
non-bank customers 75,670 68,426 67,326 63,109 Investment securities 25,370 24,420 24,208 23,738 Associated companies 520 513 491 525 Goodwill 6,931 6,931 6,931 7,152 Fixed assets 1,786 1,785 1,798 1,856 Deferred tax assets 70 91 103 118 Other assets 14,262 13,841 13,711 12,658
DBS GROUP HOLDINGS LTD AND ITS SUBSIDIARY COMPANIES
Unaudited Balance Sheet of DBS Group Holdings Ltd as at
1/Jun 30 Mar 31 Dec 31 Jun 30
In $ millions 2005 2005 2004 2004
EQUITY
Share capital 1,561 1,561 1,559 1,557 Share premium account 2,228 2,223 2,208 2,181 Capital redemption reserve 28 28 28 28 Share option plan reserve 41 37 35 22 Revenue reserve 2,919 2,999 3,000 3,000
TOTAL EQUITY 6,777 6,848 6,830 6,788
LIABILITIES
Current liabilities 6 5 5 9
Deferred tax liabilities # # # #
TOTAL EQUITY AND
LIABILITIES 6,783 6,853 6,835 6,797
Other Information
Net asset value per ordinary share ($)
4.49 4.54 4.50 4.49
(i) Based on existing ordinary share capital (ii) Assuming non-voting
convertible preference shares (“CPS”) and non-voting redeemable CPS are converted to ordinary shares
4.34 4.39 4.36 4.35
Notes:
1/ Figures for prior periods have been restated to reflect the change in accounting policies (Appendix VI, note 4). 2/ #: Insignificant
Jun 30 Mar 31 Dec 31 Jun 30
In $ millions 2005 2005 2004 2004
ASSETS
Balances, placements with, and loans and advances
to non-bank customers 3 3 3 3 Subsidiary companies 6,780 6,850 6,832 6,794
DBS GROUP HOLDINGS LTD AND ITS SUBSIDIARY COMPANIES
Unaudited Consolidated Statement of Changes in Shareholders' Equity
1/In $ millions
Share Capital
Share Premium
Treasury Shares
Non-distributable Reserves
Revenue Reserve
Minority Interests
Total Equity
Balance at January 1, 2005 1,559 2,208 - 6,585 6,150 1,128 17,630
Adjustment due to change in accounting policies (126) 43 3 (80)
Balance at January 1, 2005 (restated) 1,559 2,208 (126) 6,628 6,153 1,128 17,550
On adoption of FRS 39 at January 1, 2005 292 (100) 192
Exercise of share options pursuant to the DBSH Share
Option Plan 2 18 20
Net exchange translation adjustments during the period 3 3
Share of associated companies’ Capital Reserves 2 2
Cost of share-based payments 2 9 10 21
Net unrealised loss on financial instruments (67) (67)
Final and interim dividends paid on ordinary and
preference shares (406) (406)
Dividends paid to minority interests (26) (26)
Change in minority interests 4 4
Net profit after taxation 853 26 879
Balance at June 30, 2005 1,561 2,228 (117) 6,868 6,500 1,132 18,172
Balance at January 1, 2004 1,556 2,171 - 6,499 4,670 1,125 16,021
Adjustment due to change in accounting policies (138) 11 34 (93)
Balance at January 1, 2004 (restated) 1,556 2,171 (138) 6,510 4,704 1,125 15,928
Exercise of share options pursuant to the DBSH Share
Option Plan 1 10 11
Net exchange translation adjustments during the period 4 4
Cost of share-based payments 6 16 22
Goodwill transferred on disposal of subsidiary company 18 (18)
-Final dividends paid on ordinary and preference shares for
the previous year (199) (199)
Dividends paid to minority interests (27) (27)
Net profit after taxation 1,323 26 1,349
Balance at June 30, 2004 1,557 2,181 (132) 6,548 5,810 1,124 17,088
Note:
DBS GROUP HOLDINGS LTD AND ITS SUBSIDIARY COMPANIES
Unaudited Statement of Changes in Shareholders' Equity of DBS Group Holdings Ltd
1/In $ millions
Share Capital
Share Premium
Share Option Plan Reserve
Capital Redemption Reserve
Revenue
Reserve Total Equity
Balance at January 1, 2005 1,559 2,208 - 28 3,000 6,795
Adjustment due to change in accounting policies 35 35
Balance at January 1, 2005 (restated) 1,559 2,208 35 28 3,000 6,830
Exercise of share options pursuant to the DBSH Share
Option Plan 2 18 20
Cost of share-based payments 2 6 8
Final and interim dividends paid on ordinary and preference
shares (406) (406)
Net profit after taxation 326 326
Balance at June 30, 2005 1,561 2,228 41 28 2,919 6,777
Balance at January 1, 2004 1,556 2,171 - 28 3,001 6,756
Adjustment due to change in accounting policies 9 9
Balance at January 1, 2004 (restated) 1,556 2,171 9 28 3,001 6,765
Exercise of share options pursuant to the DBSH Share
Option Plan 1 10 11
Cost of share-based payments 13 13
Final dividends paid on ordinary and preference shares for
the previous year (199) (199)
Net profit after taxation 198 198
Balance at June 30, 2004 1,557 2,181 22 28 3,000 6,788
Note:
DBS GROUP HOLDINGS LTD AND ITS SUBSIDIARY COMPANIES
Unaudited Consolidated Cash Flow Statement
1/In $ millions
1st Half 2005
1st Half 2004
Cash flows from operating activities
Net profit before taxation 1,049 1,581
Adjustments for non-cash items:
Provision for loan losses and diminution in value of other assets 144 65
Depreciation of fixed assets 77 82
Goodwill amortisation - 220
Share of profits of associated companies (34) (34)
Net gain on disposal of fixed assets (4) (5)
Net gain on disposal of investment securities (65) (598) Operating profit before changes in operating assets & liabilities 1,167 1,311
Increase in:
Deposits and other accounts of non-bank customers 2,727 3,572
Deposits and balances of banks 1,114 2,937
Other liabilities including bills payable 2,695 3,633
(Increase)/Decrease in:
Singapore Government securities and treasury bills (432) (2,189)
Trading securities (5,093) (4,998)
Accounts receivable and other assets (367) (537) Balances, placements with, and loans and advances to other banks 7,640 2,524 Loans and advances to non-bank customers including bills receivable (9,217) (4,026)
Tax Paid (187) (104)
Net cash generated from operating activities (1) 47 2,123
Cash flows from investing activities
Dividends from associated companies 24 9
Purchase of fixed assets (47) (42)
Net increase in investment securities (1,104) (923)
Proceeds from sale of subsidiary - (69)
Proceeds from disposal of fixed assets 18 27
Net cash used in investing activities (2) (1,109) (998)
Cash flows from financing activities
Increase/(Decrease) in share capital and share premium 22 11 Net increase in debt securities and borrowings 1,067 1,148 Dividends paid to shareholders of DBSH (406) (199) Dividends paid to minority interests (26) (26)
Net cash generated from financing activities (3) 657 934
Exchange translation adjustments (4) 6 22
Net change in cash, and balances and placements with central banks (1)+(2)+(3)+(4) (399) 2,081
Cash, and balances and placements with central banks as at January 1 10,479 5,007
Cash, and balances and placements with central banks as at June 30 10,080 7,088
Note:
DBS GROUP HOLDINGS LTD AND ITS SUBSIDIARY COMPANIES
Selected Notes to the Accounts
1. Issuance of Ordinary Shares
There were 1,492,730,436 issued and fully paid-up ordinary shares at December 31, 2004. During the first half ended June 30, 2005, 1,741,920 ordinary shares were issued upon the exercise of executive share options, bringing the total outstanding number of ordinary shares to 1,494,472,356 at June 30, 2005. The weighted average number of ordinary shares was 1,493,766,428 for the first half ended June 30, 2005.
Details of issue of new ordinary shares of $1.00 each are as follows:
Particulars
Number of new ordinary shares issued between
April 1, 2005 and June 30, 2005
Number of new ordinary shares that would have been issued upon the conversion/exercise of all outstanding non-voting convertible preference
shares (“CPS”)/non-voting redeemable CPS/executive share options
Jun 30, 2005 Mar 31, 2005 Jun 30, 2004
Conversion of non-voting CPS - 120,436 120,436 120,436
Conversion of non-voting redeemable CPS - 66,475,374 66,475,374 66,475,374
Exercise of executive share options 515,230 46,156,505 47,944,623 50,936,683
2. Non-Performing Loans and Provisions
At June 30, 2005, DBSH Group’s total non-performing loans (“NPLs”) amounted to $1.896 billion. Out of the total NPLs, $1.010 billion or 53% were secured by collateral.
Details of DBSH Group’s NPLs and provisions at June 30, 2005 are as follows:
In $ millions Singapore
Hong Kong
South and Southeast
Asia
Rest of Greater China
Rest Of the
World Total
Non-Performing Loans 1,013 473 207 61 142 1,896
- Substandard 697 359 104 35 142 1,337
- Doubtful 131 58 24 3 - 216
- Loss 185 56 79 23 - 343
NPLs as a % of Group total assets 0.5% 0.3% 0.1% 0.0% 0.1% 1.0%
Non-bank NPLs as a % of non-bank loans in the
respective countries 1/ 2.1% 1.8% 4.6% 2.8% 2.7% 2.2%
Total Cumulative Provisions 967 436 163 64 154 1,784
DBS GROUP HOLDINGS LTD AND ITS SUBSIDIARY COMPANIES
2. Non-Performing Loans and Provisions (Continued)
Details of DBSH Group’s NPLs and provisions at March 31, 2005 are as follows:
In $ millions Singapore
Hong
Non-Performing Loans 979 457 221 63 208 1,928
- Substandard 689 333 121 34 208 1,385
- Doubtful 95 54 25 4 - 178
- Loss 195 70 75 25 - 365
NPLs as a % of Group total assets 0.5% 0.3% 0.1% 0.0% 0.1% 1.1%
Non-bank NPLs as a % of non-bank loans in the
respective countries 1/ 2.3% 1.8% 5.5% 3.6% 4.3% 2.4%
Total Cumulative Provisions 936 448 162 61 129 1,736
- Specific provisions 384 152 99 36 29 700
- General provisions 552 296 63 25 100 1,036
Total Cumulative Provisions as a % of:
- Group total assets 0.5% 0.2% 0.1% 0.0% 0.1% 1.0%
- NPLs in the respective countries 96% 98% 73% 98% 62% 90%
- Unsecured NPLs in the respective countries 215% 265% 132% 109% 165% 202%
Details of DBSH Group’s NPLs and provisions at December 31, 2004 are as follows:
In $ millions Singapore
Hong
Non-Performing Loans 958 471 218 73 199 1,919
- Substandard 674 341 107 39 199 1,360
- Doubtful 80 51 23 15 - 169
- Loss 204 79 88 19 - 390
NPLs as a % of Group total assets 0.5% 0.3% 0.1% 0.0% 0.1% 1.1%
Non-bank NPLs as a % of non-bank loans in the
respective countries 1/ 2.2% 2.0% 6.3% 5.0% 4.6% 2.5%
Total Cumulative Provisions 905 443 150 67 136 1,701
- Specific provisions 359 159 97 44 28 686
- General provisions 546 284 53 23 108 1,015
Total Cumulative Provisions as a % of:
- Group total assets 0.5% 0.3% 0.1% 0.0% 0.1% 1.0%
- NPLs in the respective countries 94% 94% 69% 91% 69% 89%
- Unsecured NPLs in the respective countries 221% 257% 125% 99% 95% 186%
Note:
DBS GROUP HOLDINGS LTD AND ITS SUBSIDIARY COMPANIES
2. Non-Performing Loans and Provisions (Continued)
Details of DBSH Group’s NPLs and provisions at June 30, 2004 are as follows:
In $ millions Singapore
Hong Kong
South and Southeast
Asia
Rest of Greater China
Rest Of the
World Total
Non-Performing Loans 965 544 401 122 150 2,182
- Substandard 672 389 282 87 150 1,580
- Doubtful 97 46 29 15 - 187
- Loss 196 109 90 20 - 415
NPLs as a % of Group total assets 0.6% 0.3% 0.2% 0.1% 0.1% 1.3%
Non-bank NPLs as a % of non-bank loans in the
respective countries 1/ 2.4% 2.3% 14.6% 9.1% 4.7% 3.0%
Total Cumulative Provisions 773 425 339 110 172 1,819
- Specific provisions 382 182 155 56 19 794
- General provisions 391 243 184 54 153 1,025
Total Cumulative Provisions as a % of:
- Group total assets 0.5% 0.3% 0.2% 0.1% 0.1% 1.1%
- NPLs in the respective countries 80% 78% 85% 90% 114% 83%
- Unsecured NPLs in the respective countries 188% 214% 117% 97% 114% 156%
Note:
DBS GROUP HOLDINGS LTD AND ITS SUBSIDIARY COMPANIES
2. Non-Performing Loans and Provisions (Continued)
Analysis of Non-Performing Loans by Industry
The following table shows the industry breakdown of the non-performing loans of DBSH Group:
June 30, 2005 March 31, 2005 December 31, 2004 June 30, 2004
In $ millions NPLs
Specific
Provisions NPLs
Specific
Provisions NPLs
Specific
Provisions NPLs
Specific Provisions
Customer loans
Manufacturing 449 190 406 172 365 175 583 234 Building and Construction 161 38 177 55 237 58 251 57
Housing Loans 248 65 242 67 253 67 253 74
General Commerce 245 110 238 98 186 75 187 93 Transportation, Storage and
Communications 33 11 25 9 27 10 45 4
Financial Institutions, Investment and
Holding Companies 189 53 193 56 201 58 128 45 Professionals and Private Individuals
(except Housing Loans) 237 111 245 108 239 105 219 100
Others 173 69 244 72 255 78 351 103
Sub-total 1,735 647 1,770 637 1,763 626 2,017 710
Debt securities 127 51 138 53 138 52 145 65
Contingent items 34 18 20 10 18 8 20 19
Total 1,896 716 1,928 700 1,919 686 2,182 794
Analysis of Non-Performing Loans by Period Overdue
In $ millions June 30, 2005 March 31, 2005 December 31, 2004 June 30, 2004
Non-default 675 800 744 682
Default loans 1,221 1,128 1,175 1,500
Less than 3 months 411 303 339 387
3 to 6 months 169 143 157 172
Over 6 months 641 682 679 941
DBS GROUP HOLDINGS LTD AND ITS SUBSIDIARY COMPANIES
3. Value at Risk and Trading Income
The Group uses a Value at Risk (“VaR”) measure as one mechanism for controlling trading risk. The VaR is calculated using a one-day time horizon and a 99% confidence interval. The following table shows the period-end, average, high and low VaR for the trading risk exposure of the DBSH Group for the period from July 1, 2004 to June 30, 2005.
July 1, 2004 to June 30, 2005
In $ millions As at June 30, 2005 Average High 1/ Low 1/
Interest rate 26.7 28.7 39.6 22.9
FX 11.1 5.9 15.6 2.7
Equity 4.5 6.4 14.6 3.1
Diversification effect (17.9) (14.7) -
-Total 24.4 26.3 35.1 20.7
Note:
1/ The high (& low) VaR figures reported for each risk class did not necessarily occur on the same day as the high (& low) reported for total. A
corresponding diversification effect cannot be calculated and is therefore omitted from the table.
The charts below provide the range of VaR and the daily distribution of trading income in the trading portfolio for the period from July 1, 2004 to June 30, 2005.
Group VaR for Trading Book
0
Daily Distribution of Group Trading Income
DBS GROUP HOLDINGS LTD AND ITS SUBSIDIARY COMPANIES
4.
Change in Accounting Policies
a. In second quarter 2005, DBSH Group changed its accounting policy for investments in joint venture companies. These investments are accounted for by proportionate consolidation, whereby the Group’s share of joint venture companies’ income and expenses, assets and liabilities are included in the consolidated financial statements on a line-by-line basis. The change better reflects the substance and economic reality of the Group’s interests in joint venture companies. Prior to the change, the equity method of accounting was adopted. The accounting policy change has been applied retrospectively, and the comparable financial results have been restated to conform to the new policy. There was no impact on after tax profits and retained earnings. The impact on a line-by-line basis was also not material.
b. In addition, the Council on Corporate Disclosure and Governance (“CCDG”) adopted several new and revised Financial Reporting Standards (“FRS”), which are effective January 1, 2005 for DBSH Group, including:
· FRS 39 Financial Instruments: Recognition and Measurement (revised) · FRS 102 Share-based Payment
· FRS 103 Business Combinations
· Interpretation of FRS (“INT FRS”) 12 Consolidation – Special Purpose Entities (revised) · FRS 1 Presentation of Financial Statements (revised)
Except for the prospective application of FRS 39 and FRS 103, the other accounting standard changes are applied retrospectively, with the comparative financial results restated to conform to the new accounting standards.
The financial impact of the changes in accounting policies are as follows:
Financial Reporting Standards (“FRS”) 39, Financial Instruments: Recognition and Measurement
The implementation of FRS 39 had a significant impact on certain financial assets and liabilities. An opening adjustment was made, representing unrealised gains or losses on certain financial assets and financial liabilities including derivatives to be measured at fair value on January 1, 2005. The differences between carrying amount and fair value were adjusted to revaluation and revenue reserves.
FRS 39 is applied prospectively, and the comparative figures for 2004 are not restated as prescribed by the Standard. On January 1, 2005, the following transitional adjustments were made:
In $ millions
Revaluation reserves as at
January 1, 2005
Revenue reserves as at
January 1,
2005 Total
+/(-) $’m $’m $’m
Fair valuation of:
- Investments (bonds and equities) 292 29 321
- Derivatives - (123) (123)
292 (94) 198
Hedge accounting - (6) (6)
292 (100) 192
Note:
1/ Figures above are shown net of taxes.
FRS 102, Share-based Payment
FRS 102 requires an expense to be recognised where DBSH Group pays for goods or services using shares or other equity instruments (equity-settled transactions), or using other assets equivalent in value to a given number of shares or other equity instruments (cash-settled transactions).
DBS GROUP HOLDINGS LTD AND ITS SUBSIDIARY COMPANIES
FRS 103, Business Combinations
The effect of the adoption of FRS 103 is that upon acquisition of subsidiaries or business undertakings, DBSH Group will include items like intangible assets and contingent liabilities as part of the identifiable assets and liabilities acquired, at their fair values as at the acquisition date. There were no major acquisitions by DBSH Group in first half 2005.
Additionally, the adoption of FRS 103 requires DBSH Group to cease goodwill amortisation to the profit and loss account. Goodwill should also be reviewed for impairment annually (unless an event occurs during the year which requires the goodwill to be tested more frequently) in accordance with FRS 36, “Impairment of Assets” (revised in 2004), from January 1, 2005 onwards. The cessation of goodwill amortisation has resulted in cost savings of $110 million each in the first two quarters of 2005.
Interpretation of FRS (“INT FRS”) 12, Consolidation – Special Purpose Entities
The revised INT FRS 12 has been amended to mandate the consolidation of employee benefit trusts set up for the purpose of an entity’s share-based payment arrangement(s). Arising from consolidation of these trusts, the DBSH shares held by the trusts will be accounted for as “Treasury Shares” in accordance with FRS 32 “Financial Instruments: Disclosure and Presentation”. The impact of INT FRS 12 is as follows:
· the reversal of prior period provisions on Treasury Shares of $44 million and $35 million in revenue reserves as
at January 1, 2004 and January 1, 2005 respectively.
· the recognition of $126 million of DBSH Group Holdings Ltd shares held by the employee benefit trusts for the
purposes of DBSH Group’s Performance Share Plan and Employee Share Plan as at January 1, 2005 (January 1, 2004: $138 million). These shares are netted against the equity of DBSH Group. Treasury Shares stand at $117 million as at March 31 and June 30, 2005.
FRS 1, Presentation of Financial Statements
The revised FRS 1 requires disclosure on the face of the income statement of the following:
· the profit or loss for the period, and
· the allocation of this amount between that attributable to minority interest and that attributable to equity holders of
the parent.
A similar requirement has been added for the statement of changes in equity. FRS 1 also requires disclosure, on the face of the statement of changes in equity, of total income and expenses for the period, showing separately the amounts attributable to equity holders of the parent and to minority interest.
DBS GROUP HOLDINGS LTD AND ITS SUBSIDIARY COMPANIES
Hong Kong Country Results
For second quarter 2005, net profit after taxation for Hong Kong operations on a Singapore GAAP basis declined 17% from second quarter 2004 and 2% from first quarter 2005 to $118 million mainly due to lower operating income and higher operating expenses, partially offset by lower provision charges.
· Net interest income was down 5% from second quarter 2004 mainly due to the narrower spread
between the HKD Prime rate and HIBOR 1/, a run off in higher yielding assets and competitive
price pressures on loan yields. This was partly offset by an increase in customer loans. Compared to first quarter 2005, net interest income was up 7% mainly due to increase in customer loans.
· Non-interest income declined by 25% from second quarter 2004. This is mainly due to
marked-to-market losses on derivatives which do not qualify as hedges under FRS 39 and a decline in income from sales of treasury investment products. Compared to first quarter 2005, non-interest income declined 18% mainly due to gains from DBS Bank (Hong Kong) Limited for divestment of its stake in Banco de Oro Universal Bank, a bank in the Philippines, in first quarter 2005.
· Operating expenses were 8% higher compared to second quarter 2004 and 3% higher compared
to first quarter 2005 mainly due to higher wage costs.
· Provision charge decreased 87% from second quarter 2004 reflecting the stronger economic
environment and property market. The adoption of revised MAS Notice 612 resulted in a write-back of general provisions in the first and second quarter of 2005.
Profit and Loss Account (Based on Singapore Generally Accepted Accounting Principles)
In $ millions
2nd Qtr 2005
2nd Qtr 2004
+/(-) %
1st Qtr 2005
1st Half 2005
1st Half 2004
+/(-) %
Net interest income 220 231 (5) 205 425 464 (8)
Non-interest income 80 106 (25) 98 178 247 (28)
Operating income 300 337 (11) 303 603 711 (15)
Operating expenses (156) (145) 8 (152) (308) (292) 5
Operating profit before provisions 144 192 (25) 151 295 419 (29)
Provisions (4) (30) (87) (8) (12) (58) (79)
Operating profit 140 162 (14) 143 283 361 (22)
Net profit before taxation 140 162 (14) 143 283 361 (22)
Net profit after taxation 118 142 (17) 121 239 311 (23)
Notes: