JURNAL KEU
JURNAL KEU
JURNAL KEU
JURNAL KEU
JURNAL KEUANG
ANG
ANG
ANGAN D
ANG
AN D
AN D
AN DAN PERBANKAN
AN D
AN PERBANKAN
AN PERBANKAN
AN PERBANKAN
AN PERBANKAN
Jurnal Keuangan dan Perbankan
Program Studi Keuangan dan Perbankan
Volume 13
Nomor 1 Januari 2009
Redaksi menerima sumbangan tulisan yang relevan dengan pengembangan ilmu bidang Keuangan dan Perbankan. Tulisan harus asli (bukan plagiat) hasil pemikiran, penelitian dan pendapat disertai acuan/pustaka sebagaimana tulisan ilmiah, dan belum pernah dipublikasikan pada penerbitan lain. Tulisan yang tidak dimuat dalam dua nomor penerbitan berturut-turut dianggap tidak memenuhi syarat dan tidak dikembalikan.
Ketua Editor Sugeng Haryanto, SE, MM
Editor Pelaksana Eko Yuni Prihantono,SE.,ME.
Erni Susana, SH.,MM. Lita Dwipasari,SE.,MM.
Sari Yuniarti,SE.,MM. Yusaq Tomo Ardianto,SE.,MM.
Dewan Pakar (Mitra Bestari)
Prof. Dr. Grahita Chandrarin, Ak.,M.Si. ... Universitas Merdeka Malang Prof. Dr. Imam Ghozali, M.Com.,Akt. ... Universitas Diponegoro Semarang Prof. Kartono Liano, Ph.D. ... Mississippi State University, MS-USA Prof. Dr. Sugeng Wahyudi, MM. ... Universitas Diponegoro Semarang Prof. Supramono, SE.,MBA.,DBA. ... Universitas Kristen Satya Wacana Salatiga Ahmad Erani Yustika, M.Sc., Ph.D. ... Universitas Brawijaya Malang Djoko Wintoro, Ph.D. ... Prasetiya Mulya Business School Jakarta Dr. Harmono, SE.,M.Si. ... Universitas Merdeka Malang Dr. R. Wilopo, Akt. ... STIE Perbanas Surabaya Abdul Mongid, M.Ec. ... STIE Perbanas Surabaya Taufik Saleh, SE., M.Si. ... Bank Indonesia Ri'fat Pasha, SE. ... Bank Indonesia
Sirkulasi dan Pemasaran Drs. Totok Subianto, MM.
Dra. Soma Puspita
Staf Administrasi Abdul Kadir Agus Santoso
K
K
K
K
K
ata Pengantar
ata Pengantar
ata Pengantar
ata Pengantar
ata Pengantar
Dengan segala rahmat dari Allah SWT, JKP Edisi Vol. 13 No. 1 Januari 2009 hadir kembali di tengah-tengah para pembaca.
Penerbitan edisi perdana Volume 13 ini memuat topik-topik di bidang Keuangan yang cukup menarik untuk disimak, di antaranya tentang pengujian Week-four, Monday, Friday dan earning management effect terhadap return saham, kajian kinerja keuangan sektor UKM, debt financing, profitabilitas, financial leverage, serta kinerja saham-saham perusahaan go public di BEI.
Sedangkan topik-topik di bidang Perbankan tentang penguatan stabilitas sistem keuangan melalui peningkatan fungsi intermediasi dan efisiensi, identifikasi penawaran dan permintaan kredit perbankan di Indonesia serta persepsi nasabah terhadap service failure dan strategi service recovery mewarnai artikel-artikel pada penerbitan kali ini. Penulis dalam penerbitan JKP ini banyak berasal dari para akademisi berbagai universitas di seluruh Indonesia.
Terima kasih tak lupa kami sampaikan kepada para penulis, mitra bestari yang telah membantu dalam proses penyuntingan artikel, para pembaca serta pihak-pihak lain atas partisipasinya dalam penerbitan JKP. Kami menyadari bahwa dalam penerbitan JKP ada kekurangan, sehingga kritik dan saran dari berbagai pihak sangat kami harapkan.
Selamat membaca dan semoga bermanfaat.
Januari 2009,
KEUANGAN
Pengujian Week-four, Monday, Friday dan Earnings Management Effect Terhadap Return Saham ... 1 – 14 Sri Dwi Ari Ambarwati
Managing Small Business Enterprise: Social Capital and Financial Approach At Regency Probolinggo... 15 – 27 Harmono
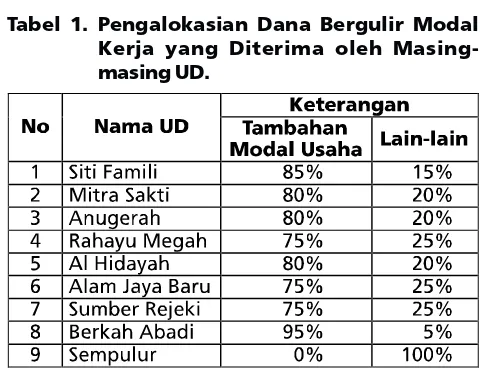
Kinerja Keuangan Pada Usaha Kecil Menengah Penerima Dana Bergulir Modal Kerja di Kabupaten Kediri ... 28 – 37 Jabal Tarik Ibrahim dan Hanif Fitria Hapsari
Analisis Debt Financing Pada Perusahaan Internasional dan Perusahaan Domestik yang Terdaftar di
Bursa Efek Indonesia ... 38 – 51 Nilmawati
Ukuran Perusahaan, Profitabilitas, dan Financial Leverage Terhadap Pengungkapan Tanggung Jawab
Sosial Perusahaan High Profile di BEI ... 52 – 61 Herman Darwis
Perbedaan Actual Return, Abnormal Return, Trading Volume Activity dan Security Return Variability Saham
Sebelum dan Setelah Merger ... 62 –77 Nurussobakh
Pengaruh Free Cash Flow, Profitabilitas, Likuiditas, dan Leverage Terhadap Kebijakan Dividen ... 78– 87 Muhammad Asril Arilaha
Penggunaan Partial Duration dalam Imunisasi Portofolio Obligasi Korporasi ... 88 – 96 Ali Wardhana, Apriani Dorkas Rambu Atahau
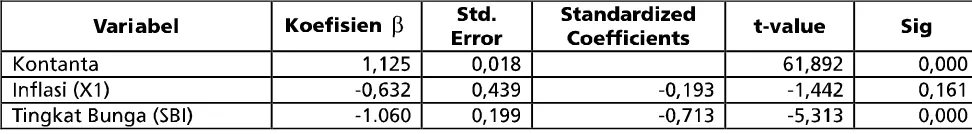
Inflasi dan Tingkat Bunga Terhadap Harga Obligasi Negara Ritel yang Diterbitkan Pemerintah ... 97 – 105 Asih Widajati
Interdependensi Antara Keputusan Investasi, Keputusan Pendanaan dan Keputusan Dividen ... 106 – 119 Linda Purnamasari, Sri Lestari Kurniawati, Melliza Silvi
PERBANKAN
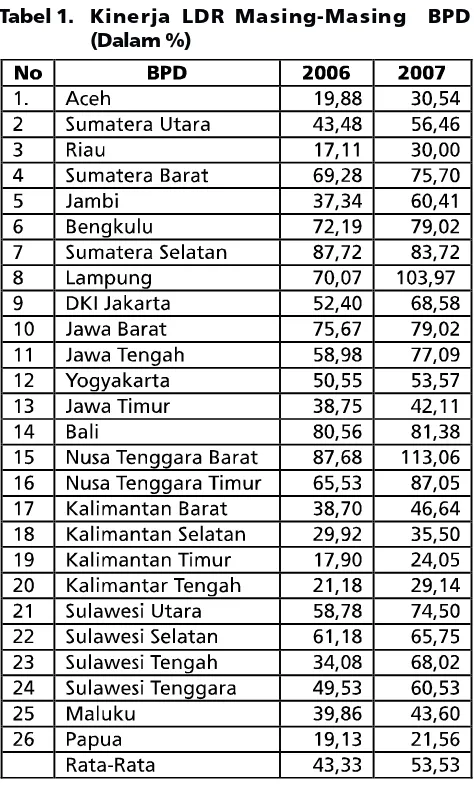
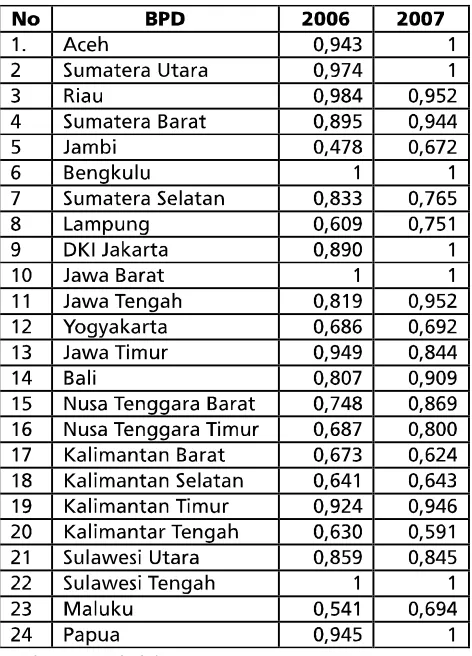
Penguatan Stabilitas Sistem Keuangan Melalui Peningkatan Fungsi Intermediasi dan Efisiensi
Bank Pembangunan Daerah (BPD) ... 120– 134 Endri
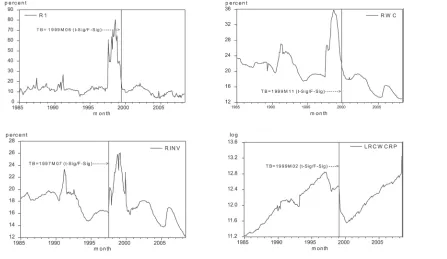
Identifying Bank Lending Channel In Indonesia: A Vector Error Correction Approach With Structural Break ... 135– 147 Akhsyim Afandi
Analisis Penawaran dan Permintaan Kredit Serta Identifikasi Peluang Ekspansi Pembiayaan
Kredit Sektoral di Wilayah Kerja KBI Malang ... 148 – 164 Ri’fat Pasha
Persepsi Nasabah Tentang Layanan Perbankan: Pengaruh Service Failure dan Strategi Service Recovery
Terhadap Behavioral Intentions ... 165 – 175 Yuli Liestyana
Analisis dan Evaluasi Mekanisme Pelaksanaan Pembiayaan Al-musyarakah Pada Bank Syariah ... 176 – 184 Erni Susana
D
D
D
Korespondensi dengan Penulis:
Sri Dwi Ari Ambarwati: Telp. +62 274 486 733 Ext.222. E-mail: [email protected]
Terakreditasi SK. No. 167/DIKTI/Kep/2007
PENGUJIAN WEEK-FOUR, MONDAY, FRIDAY
DAN EARNINGS MANAGEMENT EFFECT
TERHADAP RETURN SAHAM
Sri Dwi Ari Ambarwati
Jurusan Manajemen Fakultas Ekonomi UPN “Veteran” Yogyakarta Jl. SWK 104 (Lingkar Utara) Condong Catur, Sleman, Yogyakarta - 55283
Abstract: ThePurpose of this research was to know the empirical impact of days of the week effect to daily stock return. It used data of LQ-45 manufacturing companies listed during 2006 in Indonesian Stock Exchange and was analyzed using multiple regression through origin without intercept and dummy variables. The findings were: 1) there was impact in days of the week effect phenomenon with stock price, it meant the lowest return was on Monday and the highest return was on Friday; 2) there was no significantly positive impact between week-four effect with stock price. It meant liquidity could not influence trading activity; 3) there was no significantly positive impact between Friday effect and stock price and 4) there was no significantly positive impact between Earnings Management effect and stock price. It meant Earnings Management in April could not influence daily stock return.
Key words: week-four effect, Monday effect, Friday effect, earnings management effect
Perdebatan tentang konsep hipotesis pasar yang efisien atau efficient market hypothesis (EMH) sampai sekarang masih menjadi perdebatan yang menarik di bidang keuangan, masih ada pro dan kontra di kalangan praktisi dan akademisi tentang hipotesis pasar yang efisien. Di satu sisi banyak penelitian yang mengemukakan bukti secara empiris yang mendukung konsep pasar yang efisien, tetapi di sisi lain muncul sejumlah penelitian yang menyatakan adanya anomali pasar, yang merupakan bentuk penyimpangan terhadap hipotesis pasar yang efisien. Anomali pasar tersebut antara lain January effect, size effect, low P/E ratio, winner loser anomaly dan day of the
week effect pattern (Monday effect) (Cahyaningdyah, 2005).
fenomena Monday effect pada bulan April yang disebabkan oleh earning management (earning management effect).
Penelitian dilakukan oleh Sun dan Tong (2002) membuktikan bahwa Monday effect di pasar Amerika Serikat adalah terkonsentrasi pada dua Senin terakhir setiap bulannya. Hal ini disebabkan oleh tuntutan likuiditas investor individual menjelang akhir bulan yang menyebabkan tekanan penjualan menjadi tinggi. Selain itu, penelitian tersebut juga membuktikan bahwa return pada hari Senin yang negatif tersebut dipengaruhi oleh terjadinya return yang negatif pada hari Jumat sebelumnya (Antariksa, 2005). Hal ini didukung pula oleh Wang Li dan Erickson (1997). Antariksa (2005) menguji bahwa pada tahun 1999-2004 terdapat return pasar yang negatif pada hari Senin, dan pada hari lainnya positif. Dengan kata lain terdapat gejala Monday effect di BEI. Gibbons dan Hess (1981) dalam Murtini dan Halomoan (2007) menyimpulkan bahwa return saham rendah atau negatif terjadi pada hari Senin (Monday effect). Miller (1988) dalam Setiyo dan Nurhatmini (2003) menyimpulkan bahwa Monday effect terjadi karena selama akhir pekan hingga pada hari perdagangan Senin, investor memiliki kecenderungan untuk menjual sahamnya daripada membeli saham. Tingginya aksi jual pada hari Senin menurut Dyl dan Maberly (1988) dalam Setiyo dan Nurhatmini (2003) disebabkan oleh adanya kecenderungan informasi yang tidak menyenangkan (unfavorable information) datang ke pasar setelah perdagangan ditutup pada hari Jumat (akhir pekan).
Menurut Cahyaningdyah (2005) fenomena day of the week effect di BEI, dimana return terendah terjadi pada hari Senin (Monday effect) dan return tertinggi pada hari Jumat (weekend effect) pada periode penelitian yaitu tahun 2001-2003. Sedangkan fenomena week-four effect tidak
berhasil diidentifikasi sehingga Monday effect tidak hanya digerakkan oleh return Senin yang negatif di minggu keempat dan kelima. Cahyaningdyah (2005) juga mengungkapkan bahwa return pada hari Senin pada bulan April adalah positif atau lebih tinggi pada bulan yang lainnya. Hal ini disebabkan oleh earning management yang dilakukan oleh perusahaan untuk meningkatkan kinerja keuangan dalam rangka penyampaian laporan keuangan tahunan, tetapi pada penelitian Iramani dan Mahdi (2006), mereka tidak berhasil menemukan bukti menghilangnya Monday effect yang disebabkan oleh earning management effect pada bulan April di BEI pada tahun 2005.
Keanekaragaman argumentasi mengenai Monday effect merupakan fenomena yang menarik untuk diteliti di pasar modal di Indonesia. Penelitian ini bertujuan untuk menguji hari perdagangan terhadap return saham dan fenomena-fenomena yang berkaitan (khususnya fenomena Monday effect yang merupakan bagian dari the day of the week effect) di BEI.
BENTUK EFISIENSI PASAR
Bentuk-bentuk efisiensi pasar terdiri dari 2 golongan yaitu: (1) Efisiensi Pasar Secara Informasi dan, (2) Efisiensi Pasar Secara Keputusan. Efisiensi pasar secara informasi dibagi menjadi 3 bentuk.
Efisiensi Pasar Bentuk Lemah (weak form).
Pasar dikatakan efisien dalam bentuk lemah jika harga-harga dari sekuritas tercermin secara penuh (fully reflect) informasi masa lalu.
Efisiensi Pasar Bentuk Setengah Kuat (semistrong form)
Pasar dikatakan efisien setengah kuat jika harga-harga sekuritas secara penuh mencerminkan (fully reflect) semua informasi yang dipublikasikan (all publicly available information) termasuk informasi yang berada di laporan-laporan keuangan perusahaan emiten.
Efisiensi Pasar Bentuk Kuat (strong form)
Pasar dikatakan efisien setengah kuat jika harga-harga sekuritas secara penuh mencerminkan (fully reflect) semua informasi yang tersedia termasuk informasi yang privat. Untuk informasi yang tidak perlu diolah lebih lanjut, seperti misalnya informasi tentang pengumuman laba perusahaan, pasar akan mencerna informasi tersebut dengan cepat (Jogiyanto, 2003).
POLA WAKTU
RETURN
SAHAM
Pola Intraday (Time of the Day)
Pola ini mengacu pada perilaku return saham dari waktu ke waktu dalam satu hari (time of the day), yaitu return saham secara sistematis akan lebih tinggi atau lebih rendah pada waktu-waktu tertentu dalam satu hari perdagangan.
Pola Harian (Day of the Week)
Pola ini mengacu pada perilaku return saham dari hari ke hari dalam satu minggu, yaitu return saham secara sistematis akan lebih tinggi atau lebih rendah pada hari-hari tertentu dalam satu minggu.
Holiday Effect
Pola ini menunjukkan adanya peningkatan return saham pada hari-hari perdagangan tepat sehari sebelum hari libur nasional. Hari libur didefinisikan sebagai hari perdagangan normal dalam seminggu (Senin sampai Jumat) dimana pada hari tersebut tidak terjadi perdagangan.
Turn of the Month
Pola ini menunjukkan adanya perbedaan (kenaikan) return saham pada hari-hari sebelum dan sesudah pergantian bulan. Hari-hari pada pergantian bulan seringkali diartikan sebagai suatu hari terakhir dari suatu bulan sampai tiga hari pertama bulan berikutnya.
Pola Bulanan (Month of the Year)
Pola ini mengacu pada perilaku return saham dari setiap bulannya pada satu tahun, yaitu return saham secara sistematis akan lebih tinggi atau lebih rendah pada bulan-bulan tertentu dalam satu tahun.
ANOMALI PASAR MODAL
The Day of the Week Effect
Monday Effect
Monday effect adalah suatu seasonal anomaly (anomali musiman) atau calendar effect (efek kalender) yang terjadi pada pasar finansial yaitu ketika return saham secara signifikan negatif pada hari Senin (Mehdian dan Perry dalam Antariksa, 2005).
Week-Four Effect
Week four effect merupakan suatu fenomena yang mengungkapkan bahwa Monday effect hanya terjadi pada minggu keempat untuk setiap bulannya. Sedangkan return hari Senin pada minggu pertama sampai minggu ketiga dianggap tidak signifikan negatif atau sama dengan nol.
Earning Management Effect
Di Indonesia, fenomena tersebut tidak terjadi bulan Januari, melainkan bulan April. Menurut penelitian Cahyaningdyah (2005) dan Murtini dan Halomoan (2007), hal ini disebabkan oleh ketentuan yang ditetapkan BAPEPAM No. 80/ PM/1996 bahwa laporan tahunan harus disertai dengan laporan akuntan dengan pendapat yang lazim dan disampaikan kepada BAPEPAM 120 hari setelah tanggal tahun tutup buku perusahaan. Kemudian banyak perusahaan, baik yang bermasalah maupun yang tidak bermasalah melakukan praktik manajemen laba (earning management) untuk meningkatkan kinerja perusahaan. Kondisi ini diduga return saham pada bulan April akan lebih tinggi dibandingkan pada bulan lainnya (non April) sehingga Monday effect akan menghilang di bulan April.
Penelitian Wang, Li, dan Erickson (1997) dalam Cahyaningdyah (2005) pada sisi lain, mengungkapkan bahwa Monday ffect secara aktual muncul hanya pada Senin minggu keempat dan kelima, sedangkan return Senin minggu pertama sampai minggu ketiga secara statistik tidak signifikan (tidak berbeda dengan nol). Hal
ini berkaitan dengan tuntutan likuiditas investor individual yang jatuh setiap akhir bulan. Sun dan Tong (2002) mengkonfirmasi penelitian Wang, Li, dan Erickson (1997) dalam Cahyaningdyah (2005) tentang fenomena Monday effect yang disebabkan oleh efek minggu keempat dan kelima. Dan mereka menemukan bahwa return hari Senin yang negatif secara aktual terkonsentrasi terutama pada minggu keempat setiap bulan, mereka menyebut fenomena ini sebagai Week-Four Effect.
Penelitian yang dilakukan oleh Jaffe, Westerfield, dan Ma (1989) dalam Antariksa (2005) membuktikan bahwa return pada hari Senin adalah dipengaruhi oleh pasar selama seminggu sebelumnya. Sedangkan Abraham dan Ikenberry (1994) dalam Cahyaningdyah (2005) menemukan keseluruhan rata-rata return Senin adalah negatif, dan secara substansial merupakan konsekuensi dari informasi yang diumumkan pada sesi perdagangan sebelumnya. Jika return Jumat negatif, hampir 80% return Senin berikutnya adalah negatif, dan jika return Jumat positif maka lebih dari 50% return Senin berikutnya adalah positif. Hasil penelitian Abraham dan Ikenberry ini menunjukkan adanya korelasi antara Jumat dan Senin. Menurut mereka Monday Effect digerakkan oleh return negatif yang terjadi pada Jumat sebelumnya (bad Friday).
Rogalski (1984) dalam Cahyaningdyah (2005) mengemukakan adanya hubungan yang menarik antara day of the week effect dengan January effect. Rata-rata return hari Senin di bulan Januari lebih tinggi dibanding bulan lainnya. Tetapi, menurut Cahyaningdyah (2005) dan Murtini dan Halomoan (2007) di Indonesia fenomena ini terjadi di bulan April.
HIPOTESIS
H2 : Return yang terendah (negatif) pada hari Senin di BEI terkonsentrasi pada Senin dua minggu terakhir setiap bulannya (minggu keempat dan kelima).
H3 : Return yang negatif pada hari Senin di BEI dipengaruhi oleh adanya return negatif pada hari Jumat minggu sebelumnya. H4 : Return hari Senin pada bulan April adalah
positif atau cenderung lebih tinggi dibandingkan pada hari Senin bulan lainnya (non April).
METODE
Populasi dan Sampel
Populasi yang digunakan dalam penelitian merupakan perusahaan-perusahaan yang termasuk dalam indeks LQ 45 di BEI, selama kurun waktu Februari 2006 – Januari 2007. Pergantian saham akan dilakukan enam bulan sekali, yaitu setiap awal bulan Februari dan Agustus. Sampel dalam penelitian ini adalah 37 perusahaan. Teknik pengambilan sampel dengan purposive sampling diperlukan untuk menghindari kesalahan spesifikasi dalam penentuan sampel penelitian yang selanjutnya akan berpengaruh terhadap hasil penelitian.
Teknik Pengumpulan Data
Dalam penelitian ini data yang dikumpulkan menggunakan metode dokumentasi yaitu mengambil data yang telah tersedia. Data yang diperoleh berasal dari Bursa Efek Indonesia melalui Pusat Data Pasar Modal Universitas Gadjah Mada (PDPM UGM).
Definisi Operasional Variabel
Variabel Dependen
Variabel tidak bebas dalam penelitian ini adalah return saham harian.
Variabel Independen
Variabel bebas dalam penelitian ini adalah hari perdagangan di BEI (Senin-Jumat), hari Senin dan hari Jumat. Variabel dummy merupakan variabel penjelas dengan skala nominal (nominal scale) yang bernilai 0 atau 1. Nilai DSEN=1 untuk return saham apabila hari t jatuh pada hari Senin dan 0 apabila hari t jatuh pada hari lain. Nilai DSEL=1 untuk return saham apabila hari t jatuh pada hari Selasa dan 0 apabila hari t jatuh pada hari lain. Nilai DRAB=1 untuk return saham apabila hari t jatuh pada hari Rabu dan 0 apabila hari t jatuh pada hari lain. Nilai DKAM=1 untuk return saham apabila hari t jatuh pada hari Kamis dan 0 apabila hari t jatuh pada hari lain. Nilai DJUM=1 untuk return saham apabila hari t jatuh pada hari Jumat dan 0 apabila hari t jatuh pada hari lain.
Uji Hipotesis dan Analisis Data
Analisis data yang digunakan dalam penelitian ini adalah metode analisis kuantitatif berupa analisis regresi linier berganda tanpa intercept (multiple regression through origin). Variabel yang digunakan dalam penelitian ini adalah variabel dummy. Untuk dapat menguji kebenaran hipotesis yang diajukan dan untuk mencapai tujuan penelitian ini digunakan uji t. Variabel dependen dari persamaan-persamaan regresi yang digunakan untuk menguji masing-masing hipotesis penelitian ini adalah return saham harian.
Pengujian Hipotesis Pertama (H1)
Pengujian hipotesis pertama (H1) yaitu apakah hari perdagangan berpengaruh terhadap return saham di BEI digunakan rumus sebagai berikut:
(1) Dimana:
Rt : menunjukkan besarnya
Variabel Dummy : SEN, SEL, RAB, KAM, JUM menunjukkan hari perdagangan dalam satu minggu. Nilai SEN=1 apabila return saham jatuh pada hari Senin dan diberi nilai 0 apabila jatuh pada hari lainnya. Nilai SEL=1 apabila return saham jatuh pada hari Selasa dan diberi nilai 0 apabila jatuh pada hari lainnya RAB, KAM, JUM seperti halnya untuk hari Senin dan Selasa di muka.
b1 – b5 : koefisien regresi untuk
variabel dummy Senin -Jumat
et : error term
Pengujian Hipotesis Kedua (H2)
Pengujian hipotesis kedua (H2) yaitu apakah return yang terendah pada hari Senin di BEI terkonsentrasi pada Senin dua minggu terakhir setiap bulannya (minggu keempat dan kelima). Penelitian ini menggunakan pendekatan seperti yang digunakan Wang, Li dan Erickson (1997) serta Sun dan Tong (2002) dalam Cahyaningdyah (2005), dimana setiap bulan terdapat 5 minggu. Jika hari pertama perdagangan suatu bulan adalah hari Senin, maka hari tersebut menjadi Senin minggu pertama. Akan tetapi, jika kondisi tersebut tidak terjadi, maka tidak ada Senin minggu pertama, sehingga Senin minggu pertama dalam bulan tersebut adalah hari Senin minggu kedua. Pengujian week four ini dilakukan dengan menggunakan model regresi linier berganda seperti persamaan sebagai berikut:
...(2)
... (3)
Dimana:
Rt : menunjukkan besarnya return
saham harian pada hari t.
SEN1 – SEN5 : menunjukkan Senin minggu pertama sampai dengan Senin minggu kelima.
b1 – b5 : koefisien yang menggambarkan rata-rata return hari Senin minggu pertama sampai dengan minggu kelima.Jika benar Monday effect terjadi pada minggu keempat dan kelima, maka b4 dan b5 (persamaan 2) negatif tetapi b1,b2, b3 non negatif/positif.
SEN123 : dummy untuk Senin minggu
pertama, kedua, dan ketiga. Bernilai 1 untuk hari Senin yang jatuh pada minggu pertama, kedua, dan ketiga dan bernilai 0 untuk Senin minggu keempat dan kelima.
SEN45 : dummy untuk Senin minggu
keempat dan kelima. Bernilai 1 untuk hari Senin yang jatuh pada minggu keempat dan kelima dan bernilai 0 untuk Senin minggu pertama, kedua, dan ketiga.
et : error term
Bila return hari Senin negatif secara aktual hanya terkonsentrasi pada minggu kempat dan kelima, sementara return Senin minggu pertama sampai ketiga tidak negatif, maka b2 dalam persamaan 3 akan negatif dan b1 akan positif.
Pengujian Hipotesis Ketiga (H3)
Pengujian hipotesis ketiga (H3) yaitu apakah return negatif yang terjadi pada hari Senin didahului oleh adanya return negatif pada hari Jumat minggu sebelumnya digunakan rumus:
.... (4) .. (5) Dimana:
Rt : menunjukkan besarnya return
b1 – b5 : koefisien regresi
NFM1 – NFM5 :Negative Friday to Monday merupakan dummy interaksi untuk hari Senin yang didahului oleh return hari Jumat yang negatif. NFM1 yang mempunyai nilai 1 untuk return hari Senin minggu pertama yang didahului oleh return hari Jumat yang negatif dan bernilai 0 untuk return hari Senin lainnya. Demikian juga berlaku hal yang sama untuk NFM2 sampai dengan NFM5.
PFM1 – PFM5 :Positive Friday to Monday merupakan dummy interaksi untuk hari Senin yang didahului oleh return hari Jumat yang positif. PFM1 yang mempunyai nilai 1 untuk return hari Senin minggu pertama yang didahului oleh return hari Jumat yang positif dan bernilai 0 untuk return hari Senin lainnya. Demikian juga berlaku hal yang sama untuk NFM2 sampaidengan NFM5.
et :error term
Bila Monday effect digerakkan hanya oleh adanya return hari Jumat yang negatif pada minggu sebelumnya maka koefisien regresi b1 – b5 pada persamaan 4 akan negatif, sementara koefisien regresi b1 – b5 pada persamaan 5 akan positif. Bila Monday effect tidak hanya digerakkan oleh return hari Jumat yang negatif maka koefisien regresi pada persamaan 5 akan negatif juga.
Pengujian Hipotesis Keempat (H4)
Pengujian hipotesis keempat (H4) yaitu apakah return hari Senin pada bulan April adalah positif atau cenderung lebih tinggi daripada return hari Senin pada bulan-bulan lainnya (non April) berkaitan dengan earning management.
Dimana:
Rt : menunjukkan besarnya return
saham pada bulan t.
b1 – b12 : koefisien regresi untuk variabel Dummy hari Senin bulan Januari, Februari, Maret, April, Mei, Juni, Juli, Agustus, September, Oktober, November dan Desember.
Var. dummy : JAN, FEB, MAR, APR, MEI, JUN, JUL, AGS, SEP, OKT, NOV, DES menunjukkan hari Senin pada masing-masing bulan perdagangan. Nilai JAN=1 apabila return saham pada hari Senin jatuh bulan Januari dan diberi nilai 0 apabila jatuh pada bulan lainnya. Nilai FEB=1 apabila return saham pada hari Senin jatuh pada bulan Februari dan diberi nilai 0 apabila jatuh pada bulan lainnya MAR, APR, MEI, JUN, JUL, AGS, SEP, OKT, NOV DES seperti halnya untuk bulan Januari dan Februari di muka.
et : error term
HASIL
Analisis Deskriptif
rendah (ekstrim) dibandingkan dengan return saham yang lain atau dibandingkan dengan return saham yang sama pada hari perdagangan lainnya sehingga total observasi dalam penelitian ini berjumlah 8929 observasi.
Tabel 1. Analisis Deskriptif Return Saham
Hasil Pengujian Hipotesis
Pengujian Hipotesis 1
Data hari perdagangan diubah menjadi variabel dummy yaitu variabel penjelas dengan skala nominal yang bernilai 1 atau 0.
Sumber: Data Primer, diolah (2007)
Dari deskripsi tersebut dapat diketahui adanya return saham rata-rata setiap hari, semua menunjukkan nilai yang positif. Return rata-rata tertinggi terjadi pada hari Rabu dan return rata-rata terendah terjadi pada hari Jumat. Standar deviasi merupakan penyimpangan dari harga mean, sehingga semakin tinggi standar deviasinya maka penyimpangan dari harga rata-rata semakin besar dan data tersebut tinggi fluktuasinya. Nilai standar deviasi paling tinggi terjadi pada hari Rabu dan standar deviasi terendah terjadi pada hari Jumat, sehingga fluktuasi return saham tertinggi terjadi pada hari Rabu dan fluktuasi return saham terendah terjadi pada hari Jumat.
Tabel 2. Hasil Uji Signifikasi Hari Perdagangan Terhadap Return Saham
Sumber data: Primer, diolah (2007)
Rt = -0,0148 SEN + 0,001512 SEL + 0,002412 RAB + 0,001398 KAM + 0,004451 JUM
Berdasarkan hasil perhitungan statistik yang disajikan dalam Tabel 2, untuk keseluruhan observasi menunjukkan adanya return terendah dan signifikan negatif terjadi pada hari Senin karena nilai signifikasinya 0,000 lebih kecil dari nilai a sebesar 0,05 dan return tertinggi terjadi pada hari Jumat dengan nilai signifikasi 0,001 lebih kecil dari nilai a sebesar 0,05, sedangkan return hari Selasa, Rabu dan Kamis menunjukkan nilai positif tetapi tidak signifikan karena nilai signifikasinya lebih besar dari nilai a sebesar 0,05. Return negatif pada hari Senin ini disebut sebagai Monday effect.
Hasil ini mengindikasikan untuk keseluruhan periode pengamatan bahwa hari Senin dan Jumat mempunyai pengaruh terhadap return saham sedangkan hari Selasa, Rabu dan Kamis tidak mempunyai pengaruh terhadap return saham di BEI. Oleh karena itu, Monday effect berhasil teridentifikasi pada keseluruhan observasi dimana return hari Jumat merupakan return tertinggi dibandingkan return hari perdagangan lainnya.
Pengujian Hipotesis 2
Pengujian hipotesis dua bertujuan untuk pengujian week four effect berdasarkan kategorisasi minggu dapat dilihat pada Tabel 3.
Tabel 3. Hasil Uji Signifikasi Return Saham Hari Senin Berdasarkan Kategorisasi Minggu
Data hari perdagangan Senin minggu pertama sampai minggu kelima diubah menjadi variabel dummy yaitu variabel penjelas dengan skala nominal yang bernilai 1 atau 0 dengan menggunakan analisis regresi berganda tanpa intercept. Pola return berdasarkan kategori minggu menunjukkan bahwa return minggu keempat yang negatif namun tidak signifikan atau tidak berpengaruh, sedangkan minggu kelima terjadi return positif dan tidak signifikan. Dengan melihat Tabel 3, dapat disimpulkan bahwa hanya Senin minggu pertama saja yang mempengaruhi return saham di BEI.
Tabel 4. Hasil Uji Signifikansi Week Four Effect
Unstandardized Coefficients Variabel
Beta Std.Error
t Sig.
SEN1 -4.66E-02 .005 -8.621 .000 SEN2 6.150E-04 .006 .109 .913 SEN3 -8.24E-03 .006 -1.463 .144 SEN4 -7.67E-03 .006 -1.346 .178 SEN5 1.304E-02 .013 1.018 .309
Sumber data: Diolah, 2007
Unstandardized Coefficients Variabel
Beta Std.Error
t Sig.
SEN123 -1.89E-02 .003 -5.818 .000 SEN45 -4.25E-03 .005 -.807 .420
Sumber data: Diolah, 2007
kedua dan ketiga mempunyai return yang rendah secara signifikan dibandingkan dengan return pada hari Senin minggu-minggu lainnya.
Pengujian Hipotesis 3
Ringkasan statistik pengujian pengaruh return Jumat yang negatif (bad Friday) terhadap Monday effect di BEI dapat dilihat pada Tabel 5 dan 6.
Tabel 5. Pengaruh Return Bad Friday terhadap Monday Effect (Return Hari Senin Didahului oleh Return Negatif Hari Jumat)
Berdasarkan hasil perhitungan pada Tabel 6 menunjukkan return Jumat positif pada minggu pertama sampai minggu kelima dengan nilai signifikasi 0,000 lebih kecil dari nilai α sebesar 0,05. Hasil pengujian ini mengindikasikan bahwa tidak hanya return Jumat yang negatif yang menggerakkan return Senin yang negatif. Secara keseluruhan return Jumat yang positif juga akan diikuti oleh terjadinya return Senin yang negatif. Dengan demikian tidak ada perbedaan antara return Jumat yang negatif dan return Jumat yang positif dalam menggerakkan terjadinya Monday effect (return Senin yang negatif).
Pengujian Hipotesis 4
Pengujian terakhir dalam penelitian ini adalah untuk membuktikan bahwa rata-rata return pada hari Senin pada bulan April lebih tinggi (positif) daripada return hari Senin pada bulan-bulan lainnya berkaitan dengan earning management yang dilakukan oleh perusahaan LQ45. Data hari perdagangan Senin pada bulan Januari sampai Desember diubah menjadi variabel dummy yaitu variabel penjelas dengan skala nominal yang bernilai 1 atau 0 dengan menggunakan analisis regresi berganda tanpa intercept.
Tabel 7. Hasil Pengujian Earning Management Effect
Unstandardized Coefficients Variabel
Beta Std.Error
T Sig.
NFM1 -1.48 .013 -11.864 .000 NFM2 -1.926-02 .012 -1.614 .107 NFM3 -3.04E-02 .011 -2.695 .007 NFM4 -3.26E-02 .012 -2.712 .007 NFM5 -1.87E-02 .041 -.451 .652
Sumber data: Diolah, 2007.
Berdasarkan hasil perhitungan statistik pada Tabel 5 menunjukkan bahwa return Jumat minggu pertama dengan nilai signifikasi 0,000, minggu ketiga dan minggu keempat dengan nilai signifikasi 0,007 lebih kecil dari nilai a sebesar 0,05, hanya minggu kedua dan kelima yang nilai signifikasinya tidak signifikan.
Tabel 6. Pengaruh Return Bad Friday Terhadap Monday Effect
Unstandardized Coefficients Variabel
Beta Std.Error
T Sig.
PFM1 1.311E-02 .001 11.243 .000 PFM2 1.640E-02 .001 12.674 .000 PFM3 1.331E-02 .001 9.926 .000 PFM4 1.253E-02 .001 9.535 .000 PFM5 2.078E-02 .002 8.538 .000
Sumber data: Diolah, 2007
Unstandardized Coefficients Variabel
Beta Std.Error
T Sig.
JAN 1.087E-02 .009 1.212 .226 FEB 2.369E-03 .009 .264 .792 MAR 6.664E-03 .009 .743 .458 APR 1.122E-04 .010 .011 .991 MEI -2.42E-02 .008 -3.012 .003 JUN -3.10E-03 .009 -.346 .729 JUL -.123 .008 -15.321 .000 AGS -1.23E-03 .010 -.119 .905 SEP -1.71E-03 .009 -.191 .849 OKT -1.21E-03 .009 -.135 .893 NOP -1.27E-03 .009 -.142 .887 DES -3.07E-03 .010 -.298 .767
Berdasarkan Tabel 7 terlihat bahwa pada hari Senin di bulan April adalah positif. Tetapi bila dibandingkan dengan return hari Senin non April, return hari Senin di bulan April tidak lebih tinggi daripada return hari Senin di bulan non April. Walaupun koefisien untuk hari Senin pada bulan April adalah bernilai positif namun apabila dilihat dari nilai signifikansinya 0,991 lebih besar dari nilai a sebesar 0,05 adalah tidak signifikan. Hal ini dapat dijelaskan bahwa tidak terjadi earning management effect di BEI selama Februari 2006 – Januari 2007.
PEMBAHASAN
Secara umum dapat disimpulkan pada Februari 2006 – Januari 2007, fenomena day of the week effect terjadi di Bursa Efek Indonesia. Berdasarkan hasil penelitian ini juga menunjukkan bahwa adanya kesamaan pola return saham harian di bursa efek AS yang menunjukkan bukti bahwa rata-rata return terendah terjadi pada hari Senin dan rata-rata return tertinggi terjadi pada hari Jumat. Hasil penelitian ini berhasil mendukung penelitian Monday effect di pasar modal AS yang dilakukan oleh Fields (1931), French (1980), Lakonischok dan Meberly (1990), Kamara (1997), Mehdian dan Perry (2001) serta Sun dan Tong (2002) dalam Antariksa (2005). Hasil penelitian ini juga berhasil mengkonfirmasi hasil penelitian Monday effect di pasar modal Indonesia yang dilakukan oleh Tahar dan Indrasari (2004).
Ada beberapa alasan yang mengakibatkan terjadinya fenomena Monday effect. Fenomena ini disebabkan oleh adanya informasi yang tidak menyenangkan bagi investor (unfavorable information) lebih banyak masuk pada saat perdagangan saham ditutup (akhir pekan) agar para investor mempunyai waktu luang selama hari libur bursa atau weekend (Sabtu dan Minggu)
untuk mengevaluasi kembali kinerja emiten terhadap informasi yang ada tersebut. Alasan yang lain adalah perilaku psikologi investor yang mempunyai kecenderungan untuk tidak menyukai hari Senin yaitu adalah awal hari kerja sehingga mengakibatkan hari Senin merupakan hari yang membosankan dan menganggap hari Jumat merupakan hari terbaik karena merupakan hari kerja terakhir dan mereka merasa pesimis pada hari Senin dan optimis pada hari Jumat.
Pengujian week four effect dengan menggunakan uji regresi linier berganda tanpa intercept bahwa hanya Senin minggu pertama saja yang mempengaruhi return saham di BEI, sedangkan minggu keempat dan kelima tidak berpengaruh. Hal ini tidak membuktikan bahwa Monday effect adalah terkonsentrasi pada hari Senin minggu keempat dan kelima, atau dua minggu terakhir setiap bulannya.
pada minggu keempat dan kelima. Hal ini bisa terjadi karena masalah tuntutan likuiditas tidak berkaitan dengan investasi di bursa, artinya dana yang diinvestasikan di bursa tidak digunakan untuk memenuhi tuntutan likuiditas pada setiap akhir bulan.
Pengujian pengaruh return Jumat yang negatif (bad Friday) terhadap Monday effect dengan menggunakan uji regresi linier berganda tanpa intercept menunjukkan bahwa tidak hanya return Jumat yang negatif yang menggerakkan return Senin yang negatif. Secara keseluruhan return Jumat yang positif juga akan diikuti oleh terjadinya return Senin yang negatif. Dengan demikian tidak ada perbedaan antara return Jumat yang negatif dan return Jumat yang positif dalam menggerakkan terjadinya Monday effect (return Senin yang negatif). Tetapi hasil ini menunjukkan bahwa adanya korelasi antara return Jumat (negatif dan positif) dan return Senin (negatif).
Pengujian earning management effect dengan menggunakan uji regresi linier berganda tanpa intercept menunjukkan bahwa return pada hari Senin di bulan April adalah positif. Walaupun koefisien untuk hari Senin pada bulan April adalah bernilai positif namun apabila dilihat dari nilai signifikansinya adalah tidak signifikan. Hal ini dapat dijelaskan bahwa tidak terjadi earning management effect di BEI. Seperti yang telah diketahui bahwa pada penelitian sebelumnya oleh Cahyaningdyah (2005) yang menemukan adanya Rogalski effect (earning management effect) yang disebabkan oleh pada bulan April. Hal ini disebabkan karena adanya keharusan para emiten untuk menyampaikan laporan keuangan tahunan yang selambat-lambatnya 120 hari setelah periode tutup buku. Penyampaian laporan keuangan tersebut memberikan reaksi positif terhadap pasar. Akan tetapi pada penelitian ini, penulis tidak menemukan adanya Rogalski effect (earning management effect) pada bulan April selama Februari 2006 – Januari 2007 dimana periode tersebut berbeda dengan periode
manajemen laba, maka angka laba yang dilaporkan tidak mencerminkan nilai intrinsiknya sehingga angka tersebut tidak dapat dipercaya. Akibatnya, gambaran laba tidak dapat mewakili kinerja perusahaan secara fair sehingga akan mengurangi reliabilitas dari laba itu sendiri. Dengan demikian informasi laba tidak menjadi kurang relevan sehingga dapat mempengaruhi investor dalam mengambil keputusan investasi mereka di pasar modal.
KESIMPULAN DAN SARAN
Kesimpulan
Penelitian ini bertujuan: (1) untuk membuktikan secara empiris apakah hari perdagangan berpengaruh terhadap return saham di BEI, (2) untuk membuktikan secara empiris apakah return saham yang terendah (negatif) pada hari Senin di BEI terkonsentrasi pada Senin dua minggu terakhir setiap bulannya (minggu keempat dan kelima), (3) untuk membuktikan secara empiris apakah return negatif pada hari Senin dipengaruhi oleh adanya return negatif pada hari Jumat minggu sebelumnya,(4) untuk membuktikan secara empiris apakah return saham hari Senin di bulan April lebih tinggi (positif) daripada return saham hari Senin pada bulan non April berkaitan dengan earning management yang dilakukan oleh perusahaan LQ-45.
Hasil pengujian terhadap hipotesis pertama ternyata memberikan kesimpulan bahwa hari perdagangan berpengaruh signifikan terhadap return saham harian di BEI pada perusahaan LQ45. Hal ini membuktikan bahwa terjadi fenomena day of the week effect dimana return terendah terjadi pada hari Senin dan tertinggi pada hari Jumat. Hasil empiris ini juga memberikan bukti bahwa terjadi Monday effect di BEI pada tahun 2006.
Hasil pengujian terhadap hipotesis kedua memberikan simpulan bahwa fenomena week four effect tidak berhasil diidentifikasikan. Hal ini mengindikasikan tuntutan likuiditas tidak mempengaruhi aktivitas perdagangan.
Hasil pengujian terhadap hipotesis ketiga memberikan kesimpulan bahwa return hari Jumat sebelumnya ditemukan mempengaruhi return hari Senin, akan tetapi secara keseluruhan juga tidak ada perbedaan antara return hari Jumat yang negatif dan return hari Jumat yang positif dalam menggerakkan terjadinya fenomena Monday effect.
Hasil pengujian terhadap hipotesis keempat memberikan simpulan bahwa earning management effect pada bulan April tidak berhasil diidentifikasikan. Hal ini mengindikasikan bahwa earning management yang dilakukan perusahaan yang berkaitan dengan dengan penyampaian laporan keuangan tahunan tidak berpengaruh terhadap return saham di BEI.
Saran
Bagi investor/calon investor, sebaiknya memperhatikan hari perdagangan saham yang memberikan return terendah pada saat mengambil keputusan investasi, sehingga dapat memaksimukan keuntungan investasinya.
DAFTAR PUSTAKA
Algifari. 1998. Pengaruh Hari Perdagangan terhadap Return Saham di Bursa Efek Jakarta. Thesis (Tidak Dipublikasikan). Universitas Gadjah Mada Yogyakarta.
Antariksa, B. 2005. Fenomena The Monday Effect di Bursa Efek Jakarta. Simposium Nasional Akuntansi VII. Solo
Betty, N. 2004. Analisis The Day of The Week Effect pada Perusahaan LQ45 di Bursa Efek Jakarta, Skripsi (Tidak Dipublikasikan). Universitas Muhammadiyah Yogyakarta.
Cahyaningdyah, D. 2005. Analisis Pengaruh Hari Perdagangan Terhadap Return Saham: Pengujian Week-Four Effect dan Rogalski Effect di Bursa Efek Jakarta. Jurnal Ekonomi dan Bisnis Indonesia, Vol.20, No.2, hal.175-186.
Chukwuogor, C.N. 2006. Stock Market Return Analysis, Day of The Week Effect, Volatility Return: European Financial Market. International Journal Of Finance & Economics.
Iramani & Mahdi. A. 2006. Studi tentang Pengaruh Hari Perdagangan terhadap Return Saham pada BEI. Jurnal Ekonomi Akuntansi, November, hal.63-70.
Isnaini, N. F. 2005. Analisis Pengaruh Day of The Week Effect terhadap Return Saham di Bursa Efek Jakarta. Skripsi (Tidak Dipublikasikan). Universitas Muhammadiyah Yogyakarta.
Jogiyanto, H.M. 2003. Teori Portofolio dan Analisis Investasi. Yogyakarta: BPFE.
Murtini, U. & Halomoan.A.I. 2007. Pengaruh Hari Perdagangan terhadap Return Saham: Pengujian Monday, Week-Four, dan Rogalski Effect di Bursa Efek Jakarta. Jurnal Riset Akuntansi dan Keuangan. Vol.3, No.1, Februari, hal.20-33.
Mishartanti, E. 2005. Pengaruh Antara Earning dan Return Saham terhadap Ketidaktepatwaktuan Laporan Keuangan (Studi Empiris Perusahaan LQ45 yang Terdaftar di BEI Periode 2002 – 2004). Skripsi (Tidak Dipublikasikan). Universitas Pembangunan Nasional “Veteran” Yogyakarta.
Setiyo, I & Nurhatmini, E. 2003. Pengaruh Hari Perdagangan dan Exchange Rate terhadap Return Saham di BEI. Jurnal Wahana, Vol.6, No.1, Februari.
Korespondensi dengan Penulis: Harmono: Telp./Fax. +62341581056. E-mail: [email protected]
Terakreditasi SK. No. 167/DIKTI/Kep/2007
MANAGING SMALL BUSINESS
ENTER-PRISE: SOCIAL CAPITAL AND FINANCIAL
APPROACH AT REGENCY PROBOLINGGO
Harmono
Merdeka University Malang, Economic Faculty
Position as Institution Head of Research and Community Services, and Expert in National Evalua-tion Consultant (NEC) for Impact Study at Urban Poverty Project 2 (UPP-2) 2007/2008. Collaborate
Departemen PU of Central Government of Indonesia Republic, World Bank, and LSPK Malang.
Abstract: This study attempted to analyze management model of small business enterprise in Probolinggo regency. Conceptual framework was based on social capital and financial approach. Terms of finance would be analyzed with financial audit, and social capital consisting of individual behavior, organization behavior in groups, relationship with others and government institution which followed local social norms enhancing goals congruence. Research design integrated both exploratory and confirmatory research. The unit of analysis was small business enterprise, members of community organization Urban Poverty Project-2 in Probolinggo regency. The finding of research indicated four dimensions representing the management model of small business enterprise. They were: 1) financial factor; 2) skill; 3) disciplines for quality; and 4) relationship factor. The next analysis was adjusted with demography cluster. Based on cluster and factors analysis it could be described that, groups in first cluster were 19% concerning in financial and relational factors. The second cluster was just 5% concerning to skill and discipline for quality. The third cluster consisted of 26% concerning to relational, and the forth cluster was as the majority members, 50% of the population, concerning in financial and skill factors, and having significantly correlation between educations and income. This result was appropriate to financial and institution audit.
Key words: financial and institution audit, social capital, small business enterprise
Managing small business processes need management in focusing to customer, emphasize to quality and unique product than economic of scale. Therefore, managing small business enterprise is different from large scale that concern to economic of scale. Usually, for large scale enterprise management model is emphasizing economic of scale and tend to monopolistic market
quality, and relationship factors. To synergize all of these factors will be better management model. Skill factor is described of human resources aspect in working in the firm. When, the firm have high skill to process of products and can fully the needs of customer, that is indicate any synchronized between skill and customer need. And than, the skill factor must be properly with others factors, i.e.: financial; disciplines for quality, and relationship factors.
If they are reviewed from discipline for quality factors, so the meaning that, quality is reflected for specification of product development. In which, described of business processes until get the excellence product from the others. The quality of products must be following by high skill of labors to concern with quality and production process, beginning material handling quality, labors, and factory overhead resources quality, to support products so relevant with market share.
The next is relationship factors; it is describe the customer’s side relationship with marketing strategy of the firm. In order to obtain the characteristics customers clearly that, need identified customer’s wont or customer’s need, supported by well prepared questioners base on sophisticated marketing theory i.e.: marketing mix concept; market orientation; customer focus; and the latest is balanced scorecard concept. And the final is financial factors, after we have already evaluation and synergized of the first–thee factors, for the next stapes is score with financial aspect and balanced each factor to others so that can be obtain balanced management model among all of the factors. The management model with synchronized among customer focus, internal business process, learning and growth perspective, and financial perspective is named the balanced scorecard (Kaplan 1990). Therefore, in the performance evaluation for small business enterprise is similarly with balanced scorecard, and the others hand, dealing with behavior aspects of entrepreneurs will be analysis base on social capital concept.
Social capital can be defined as networks and associated shared norms that facilitate co-operative behavior within and between social groups. Values and shared understandings that are widely seen to affect the quality and quantity of social interaction include trust, honesty, meeting obligations, helping those in need and tolerance. Three main types of social capital have been identified: bonding social capital (connecting similar types of people and groups); bridging social capital (connecting people across social divisions, e.g. age, ethnicity, occupation, locality); and linking social capital (connecting individuals to people in positions of influence in formal institutions e.g. police, schools, banks). A balance between bonding, bridging and linking social capital is necessary to promote social support and wider social connectedness. Dealing with small business enterprise, social capital is relevant in to integrated management model to support the synergizing of overall management perspective
MANAGING BUSINESS PROCESSES
Management of Large-Scale Business Processes. At the next level down, line managers, process managers, or management teams are responsible for the overall success of large-scale business processes. They are concerned with assuring that the sub processes are coordinated and that they work smoothly to achieve the strategic goals of the specific business process. At the other hand, for small business processes management need focusing to customer, emphasize to quality and unique product than economic of scale. Therefore, managing small business enterprise is rather different from large-scale. Based on the finding this research, for managing small business enterprise needed four factors, there are customer’s focus, care to quality, skill, and financial factors. (3) Management Activities. At the next level, we have managers who are concerned with the day-to-day operation of a specific process or activity. Many studies have suggested that the easiest way to rapidly improve a given business process is to improve the way it’s managed on a day-to-day basis; order to every non value added activity can be eliminated. (4) The Management of Process Redesign or Improvement Projects for small business enterprise. This type of management focuses on a specific project with a specific goal: the redesign or improvement of a process. Day-to-day managers may be involved in the project redesign or improvement effort, but the management of a change project is essentially different than the ongoing management of a process or activity. The planning of redesign must be integrated with within and between organizations function to achieve optimizes performance. (5) The Design and Use of Automated Systems to Manage a Process. Recently, theorists have begun to talk about using software languages to model and control the execution of automated processes. This approach, with its focus on IT modeling, systems techniques and Internet techniques like XML, emphasizes the use of software tools to control and modify automated
processes. Whole books have been written about each of these different types of process management. In this issue of managing small business enterprise depend on unique of product and external demand. If the market need expected the product have IT modeling that SBE must adapt to market competitions characteristic. But in the most weaknesses for small business enterprises that, less capital, don’t have any skill, and marketing. Therefore need, training for labor, and have synergies with government polices and donors.
IMPLEMENTATION OF MANAGING SBE
Some of procedure in managing and job functions for Small Business Enterprise can be illustrated at figure 1:
• Define the Overall Process. Determine its goals, its boundaries, how it interfaces with other processes, what facilities are needed, and what work will be accomplished. • Plan, Schedule and Budget. Determine how
to create the needed facilities, how to hire the employees needed, and how to establish the relationships necessary to interact with other processes. You will need a schedule to determine what will happen in what order, and a budget to establish what it will cost. You will also need to create a budget to pay for the on going activities involved in the process, including salaries and the acquisition of supplies.
• Define Measures, Policies and Business Rules. You will need to define an external goal that you can use to determine if the process output meets the goal of the process. You will also need to define internal goals, as needed, for employees and subprocesses or activities that can be used to measure outputs of subprocesses and activities. And you will need to define policies and business rules to assure that the performance of the process will conform with company policies, safety and legal requirements, an appropriate practices necessary for the success of the process.
• Create and Provision Process. When
everything is planned, budgeted and approved, you will need to rent the space and hire the people. You will need to provide any training needed to prepare the employees. If software is required, you will need to acquire it. Then you will need to begin accepting inputs and generating outputs to test and improve the workflow until output measures can be met.
• Monitor Ongoing Process. Once the process is functioning properly, establish specific measures of performance and a schedule on which to monitor the process to assure that the process continues to meet its output goals.
• Control the Process by Diagnosing and Correcting Problems. The people performing the process will need feedback. If they are performing correctly or exceptionally well, they need to be told. Appropriate rewards need to be given. These may include citations, bonuses, raises or promotions. If the process begins to turn out defective outputs, you will need to be able to diagnosis the problem. Faults must be identified and minimized or eliminated. In some cases, procedures must be altered, the workspace redesigned, software altered, or suppliers
notified that inputs are inadequate. As necessary, people must be told they are performing inadequately, given additional training, docked, or fired. Figure 1 provides an overview that suggests how a manager interacts with an ongoing process.[1] It also suggests the various tasks we considered when we discussed creating a new process into two broad activities: Planning and Organizing, and Monitoring and Controlling, and shows, in a very general way, how they relate to a process that is being executed. This is an arbitrary way of grouping the functions, but we find it useful. Managers at all levels have these same general concerns. At the strategic level, the executive focuses on organization.
SOCIAL CAPITAL
Although social capital stile developing theory, it is relevance and have any relationship with the others concept (i.e. economy; sociology, anthropology, and also psychology) even though in practice among them can’t be separate only one aspect. Therefore, in this case adopt social capital and combined with economy, and the others to construct of model and variables in order to get information completely for managing small business enterprise.
networks and cooperation. A central aim of this project is to explore the relationship between these elements and, consequently, to provide a more profound understanding of the concept of social capital and relationship with economy for managing small business enterprise. It should be pointed out that in this research plan we do not restrict ourselves to any particular definition of social capital. Moreover, social capital is treated either as an independent or as a dependent variable in empirical studies. The causal direction depends on the research question to be answered, and is clarified within each subproject.
This project studies social capital and its elements from three different perspectives. First, we will follow those economists and rational choice theorists who have analysed the patterns of reciprocal cooperation that may emerge in repeated interactions. In this approach, cooperation is explained primarily by actors’ mutual benefit gained by strategies of conditional
cooperation. As a result of successful experiences of cooperation, norms of cooperation are expected to emerge, as well as trust in others’ willingness to cooperate. Hence, trust is understood as a result of previous cooperative solutions to collective action problems, but the mutually reinforcing relationship between trust and cooperation is also emphasized.
The second approach typical in sociological models, considers shared norms and values as well as factors like familiarity and friendship as the basis of trust and cooperation. In this approach, trust is considered the precondition or at least a facilitator of cooperation rather than its outcome. (Gambetta 2000.) Partly similar to the sociological approach, in political science structure is often treated as an explanation of human behaviour. The structural method considers macro variables, such as the political system or social class, and even physical variables, such as geographical location or demographic size, as independent variables.
Actors’ behaviour is analysed in relation to the system(s) they interact in (Giddens 1981, Jervis 1997). Correspondingly, a structural model might state that, for example, a certain type of democratic system nourishes trust and promotes cooperation. The third approach of our project is based on democratic theory, following the contributions of such authors as Rousseau, Mill and de Tocqueville and, later, theorists of participatory and deliberative democracy. These theories focus on how people adopt and act according to the norms, values and obligations that define democratic citizenship. Following this approach, it can be argued that certain democratic values and norms, such as the sense of civic duty, mutual respect, impartiality and commitment to rational discussion may facilitate trust among individuals. We examine whether democratic institutions and norms increase certain aspects of social capital.
A more traditional assumption in the political science literature (e.g. Putnam 1993) is that social capital sustains democracy. It has been argued that social capital among citizens enhances trust in democratic institutions and practices. This argument raises several questions. For example, what does it mean that people trust in democratic institutions? Do they expect the institutions to benefit them personally or to treat all claims and opinions neutrally or impartially? (Cf. Barry 1995.) When discussing the relationship between social capital and trust in public institutions, one should also consider the “dark sides” of social capital (Putnam 2000, Field 2003). In public decision-making and administration, certain types of networks of trust and reciprocity may be considered signs of weak public morality and corruption. In this respect, it is relevant to make the distinction between inward-looking networks pursuing the benefit of the members only and outward-looking networks dedicated to the pursuit of the public good. Another widely used distinction is between bonding social capital, i.e. exclusive connections between like-minded people, and bridging social
capital, i.e. inclusive connections between social cleavages. Our purpose is to give these concepts a more solid theoretical foundation by relating them to such concepts as reciprocity and impartiality.
The previous activities of the scholars involved in this project support the goals of the project. Dag Anckar has specialized in the problem of democratisation (Anckar 2002). Kimmo has specialized in comparative research on electoral behaviour (e.g. Grönlund 2003) and Kaisa Herne in decision making experiments (e.g. Herne 1999). Maija Setälä has specialized in democratic theory (e.g. Setälä 1999).
FINANCIAL AUDIT
Based on job description clearly so, operational of SBE will be hence cost effectiveness and helping auditing processes for improving task control. When every activity can be responsible and has audited that, SBE will be getting value added activity and any have good competitive advantage. Therefore, for getting good managing SBE can be sport by describe of financial audit in bellow:
Based on financial audit reporting, management can be analyzing of every activity and organization line, and than to make decision for better operation organization. By cross checking between activity and financial condition, the management will get usefulness for correct and improving task sustainability.
Some factors for Prior Research Harmono (2002) Nirwanto and Harmono (2006), and Harmono (2007) describe that any tree factors for empowerment of community development (e.g. productivity; accessibility; and competitiveness). And than combine with characteristic cluster have formatted consist of tree clusters. The first cluster have 13% members from 98 respondents perceive less on poverty reduction program, does not
perceive positively the significant factors invented. On average have secondary and high school level of education, the lower income if compare with two others clusters. Second, 26% form respondent concern to third factor, they perceive to become success must competitiveness; excellence product; and have any saving for sustainability strategy. And the finally, is cluster tree have 63% of members attaint to hold of factors they are productivity; accessibility; and competitiveness. If small business enterprise concern in that factors and supported by financial factor that mention is balances scorecard management model. In generally when management applied this model can get the balanced management and improving accurately for competitiveness and sustainability. Illustrated for detail prepared in Figure 2.
RESEARCH METHOD
This study is a combination of exploratory and descriptive research as a Small Business Enterprise management model. The unit of analysis is the members of community organization of Urban Poverty Project-2 (UPP-2) project in Probolinggo City. Those members belong to self-sustain groups in tree villages, Pakistaji, Kebonsari Kulon, and Wiroborang. The area is characterized by education level and small industries management model.
As an exploratory research its objective is to discover ideas and insights based on sufficient
concept and prior research and empirical logic. Factor analysis rely on the four dimensions of skill, discipline for quality, relationship, and financial perspective. Economic, and environment as the basis of empowerment. The target group is classified into clusters that represent each behavior as they perceive against empowerment underlined.
Based on the cluster and the respective demography a model prototype is designed in order to come up with appropriate instrument— in this case training modules—in poverty reduction as the goal to be accomplished. The variables estimated are described in Table 1.
Variable Dimensions Indicator Scale
Economic (financial)
1. Economical 2. Payback due 3. Productive 4. Technology based 5. Funding
6. Efficiency 7. Entrepreneurship 8. Consumerism 9. Income 10. Saving
11. competitiveness Ordinal (Interval) Ordinal (Interval) Ordinal (Interval) Ordinal (Interval) Ordinal (Interval) Ordinal (Interval) Ordinal (Interval) Ordinal (Interval) Ordinal (Interval) Ordinal (Interval) Ordinal (Interval) Social 1. Access to institutions
2. Organizing 3. Work ethic 4. Independent 5. Timely
6. Access to information 7. Networking
8. Human resource 9. Integrating 10. Perceived poverty
Ordinal (Interval) Ordinal (Interval) Ordinal (Interval) Ordinal (Interval) Ordinal (Interval) Ordinal (Interval) Ordinal (Interval) Ordinal (Interval) Ordinal (Interval) Ordinal (Interval) Ordinal (Interval) Empowerment
Environment 1. Sanitation 2. Hygiene
3. Physical environment 4. Security
5. Esthetics Ordinal (Interval) Ordinal (Interval) Ordinal (Interval) Ordinal (Interval) Ordinal (Interval) Demography Group identity 1. Name
2. Origin 3. Ethnic group 4. Religion 5. Education 6. Type of business 7. Occupation 8. Age 9. Sex 10. Income
Nominal Nominal Nominal Nominal Ordinal (Interval) Nominal Nominal Ordinal Nominal Ratio
Purposive sampling is the technique to acquire respondents among the members of Community Group (CG) UPP-2 program, i.e. Pakistaji, Kebonsari Kulon, and Wiroborang 300 CG each CG consists of 3-4 members, all of them in Probolinggo regency.
The data analysis technique are descriptive with factor and cluster analysis with following model:
Xi = Ai1 F1 + Ai2F2 + Ai3F3 + . . . + AimFm + ViUi
Where:
Xi = i-th standard variable
Aij = regression coefficient of i-th variable against common factor j
F = common factor
Vi = regression coefficient of standard variable i against unique factor i
Ui = unique factor for i-th variable m = number of factor
Unique factors are corelated one another with common factors. Common factor is a linear combination of several observed variables, and illustrated below:
Fi = Wi1X1 + Wi2X2 + Wi3X3 + . . . + WikXik
Where:
Fi = estimated i-th factor
Wi = weight or coefficient of factor score k = number of variable
The assumption is that the variables estimated are standardized and the sample size is at least 4-5 times as many observations as there are variables. Conducting factor analysis the following procedure are taken: a) formulate the problem; b) construct the correlation matrix; c) determine the number of factors; d) rotate factors (ortogonal, varimax, and diagonal); e) interpret factors invented; f) calculate factor scores and select surrogate variables; and finally g) determine the best model fit.
Cluster analysis is chosen as a technique to classify objects into relatively homogenous groups or clusters. The steps involved in cluster analysis are as follows: a) formulate the problem; b) select a distance measure; c) select a clustering procedure; d) decide on the number of clusters; e) interpret and profile clusters formed; and f) assess the validity of clustering.
This is nonhierarchical or agglomerative type and the number of cluster matches the number of factors invented. Variables are clustered based on the distance of similarity of each member characterized by its culture, and demography. This technique uses k-means clustering method and the steps are taken to acquire sequential threshold, parallel threshold, and optimizing partitioning or optimizing procedure assisted by quick cluster program from SPSS.
Nonhierarchical clustering starts with cluster center then group all objects into the threshold. Parallel threshold method determine cluster centers all at once. Reliability and validity are done by: 1) clustering the same data of different distance; 2) compare the results of several experiments to stabilize; 3) do different clustering and compare results; 4) test with split technique and compare; and 5) delete variables at random, clustering and compare.
Data are standardized by transformation to
Z-score:
(is mean and s is standard deviation).
RESEARCH FINDINGS
behavior against the empowerment of SBE based on the dimensions under study. The summary of the results are illustrated on Figure 3. It obviously said that the longer they are in business and perceive positively to empowerment against poor performance of SBE, including skill, discipline for quality, relationship, and financial. And the other hand, from demography indicating level of education have any correlation with income, the meaning of this condition is reflected that a higher education level will be more income. Describing of this result in detail can be follow to Figure 3.
At the others aspects for supporting to construct small business management model can be illustrated by cluster of demography. Based on cluster analysis have four clusters will be synchronize with that factors for getting criteria of management model namely; first cluster have 28 or 19% members is concern to factor 1 and 4 with
demography characteristic: Un educated 11%; elementary school 36%; Junior high school 29%; senior high school 29%; and strata I 4%.
The second cluster consist of 5% members of cluster concern to factor 2 and 3, with demography characteristic: UN educated 33%; elementary school 50%; and Junior high school 17%. The third cluster have 26% members of cluster concern just to factor 4 with demography characteristic: elementary school 22%; and Junior high school 17%; senior high school 56%; and strata I 8%. The final cluster 50% from population about 72 people attend to factors 1 and 2; with demography characteristic: un educated 13%; elementary school 32%; and Junior high school 27%, and strata I 1%. With integrated preparation of out-put data analysis can be illustrated to following Figure 3.
!
"
#$
% ! & ' " '
( ) ' * + ,(%
+,
-. '
- $' / 0 "
- $'
! " " +1 -+111 +11 -2 3 # 3
1 $' 0 ' " +1
+
-+1, %
+,
, 4 %5 0 ' '
'
)! 6 7)!62 8 59 6 ' 76 8 - 59 : & ' ' 7:& 8
%59 & ' ' 7 & 8 59 0 5
1 4 5 0 -; ' ' '
)!62 --59 6 (59 0 :& 15
- -, 4 5
' '
6 59 )& 59 & ' ' 7 & 8 59 0 ,5
1 4 (5 0 ; ' ' )!62 -59 6 - 59 :& 159 & 159 0 5 < 6 = > ?@ ?A " +, -9 +( ( ( ; . ; -+ +, +, 1 + 11
+ 1
,
DISCUSSION
Based on data analysis, obtained four factors and four clusters, basically both of factors and cluster can be synergized to build of creative management model for SBE and supporting by demography characteristic. The first is financial factor, they are consist of five element i.e. ability to pay, conservatism to borrow of fund, conservatism in managing loan, stressing to manage competitive intelligent, and need for saving. It is reflected of financial management of SBE. Look at the financial factors carefully, and synergizes to others factors will be empowerment to manage of SBE.
The second is skill factor, this ones are consist of three element i.e. information technology for competitive strategy, need high skill human resources, and use of technology to produce of quality product. Third factor is discipline for quality, element of this factors consist of independent and concern in sanitation, quality for competitive strategy, and the impotency of discipline and hard working. And the final factor is relationship, these is dealing with some element i.e. the impotency of organization and networking, impotency of government access, and networking with key person of government.
Based on a forth factors, we can analysis and synchronize among all factors will be getting SBE management model, integrated and synergized with clusters and demography factors. Experts mention of this model are management based balanced scorecard (Kaplan, 1990, Harmono, 2007). Clearly, explanation of this model can be illustrated at the Figure.
Here after, we have discussed about factors analysis, if joint with cluster analysis will be getting integrated management model of SBE. Based on cluster analysis with use of level education for cluster criteria can be indicated four cluster. The members of cluster one are 28 people or 19% from the sample. They are tend to factor 1 and factor 4,
in this case can be identified that the peoples in to cluster one have unique criteria, they are include the good people because of them have skill and conservatism in funding for their business
The members of cluster two are just 7 people or 5%. They have characteristic tend to factor one and factor two. In this case can indicating carefully in financial and emphasizing to skill of labor. The people in this cluster can be categorized in conservatism group. Where its can be indicating of Probolinggo regency people in Small Business Management Model.
The next cluster is cluster 3 (three), where here just tend to relationship aspect less to focus to thee-others factor i.e. financial, skill, and concern to quality. Therefore, base on this case, this cluster can be classified as just wont to get advantage from the donor or government, and unfairness just only to become dependent people. If we connecting to managing of SBE, if management just concern to one aspect namely relationship not to combine with skill of labor, financial aspect and good quality, so that the firm will not in good position. With the finding the characteristic this cluster, we suggesting to combine with three-others factors.
attaint of demography characteristic i.e. good education, high income, experience, age in productive, and on going business period about 3 or 4 years ago.
Indirect effect when the small business enterprise has good financial performance, reflected by financial audit. So that, some factors and cluster will be proper with financial strategy. Therefore, in rebuild management model beside attend to management factors and demography characteristic is better if considering financial performance, for getting SBE.
CONCLUSION AND SUGGESTION
Conclusion
Factors that constitute the behavior of the members of Small Business at P2KP project from the dimensions of social, economic, and environment at level of Local Government consist of Pakistaji, Kebonsari Kulon, and Wiroborang. The area is characterized by education level and small industries are consecutively, a.Financial aspect; b. Skill of labor; c. Discipline for quality and d. Concern to relationship for competitiveness.
Based on some factors in this research finding, we also found clusters can synchronized to these factors for to get Small Business Management Model. The management model in which comparing some aspect in here marketing, product, human perspective, and financial aspect namely is managing base balanced scorecard.
Clusters with positive attitude including productive, independent, have high accessibility, disciplinary and timely proved to have high competitiveness and successful in managing the credit loan for running and expanding the business. Those clusters possess above perception are also proved to have positive attitude towards
hygiene, sanitation, esthetics, and neat environment regardless of the subsidy and external aid.
Based on findings and significant then appropriate actions should be taken; training and education seem the right ones. Various methods can be developed to fulfill the needs as awareness is they key to fight poverty in developing countries and improving managing SBE. Practical training on entrepreneurship and all aspects pertaining to business as a self help remedy. Practical, efficient and effective, as well as fun methods should be developed and implemented.
Suggestion
Suggesting for future policies to rebuild the management model of small business enterprise need to synergize of some factors there are 1) financial factor; 2) skill; 3) disciplines for quality; and 4) relationship factor. And than four this factors as good as adjusted with demography characteristic and financial strategic. So that will be gotten small business enterprise management model.
And the others hand, for construct of management model must supported by financial audit for financial strategies.
REFERENCES
Alisyahbana, A.S. & Manning, C. 2006. Labor Market Dimensions of Poverty in Indonesia. BIES - Bulletin of Indonesian Economic Studies, Vol.42, No.2, August, pp.235-261.
Anckar, D. 2002a. Democratic Standard and Performance in Twelve Pacific Micro States. Pacific Affaires, Vol.75, No.2, pp.207-225.
Benu, F. 2002. Economic Community Development and Empowering of Community Economy. Seminar Article at Province NTT .pp.1-22.
Bourdieu, P. 1986. Forms of Capital, in J. G. Richardson (ed.): Handbook of Theory and Research for the Sociology and Education, pp. 241-260.
Daley, A. & Fane, G. 2002. Anti-poverty Programs in Indonesia. Bulletin of Indonesian Economic Studies, Vol.38, No.3, 309-31.
Gambetta, D. 2000. Can We Trust Trust? In Diego Gambetta (ed.): Trust: Making and Breaking Cooperative Relations. Electronic Edition, Department of Sociology, University of Oxford, Chapter 13, pp. 213-237. Didownload tgl. 20 September 2008. http:// www.sociology.ox.ac.uk/papers/gambetta 213-237.pdf.
Giddens, A. 1981. A Contemporary Critique of Historical Materialism. London: Macmillan.
Grönlund, K. 2003. Voter Turnout in Politically Homogeneous and Dichotomous Contexts. A Com