T H E J O U R N A L O F H U M A N R E S O U R C E S • 45 • 3
Incidence of Childhood Obesity
Daniel L. Millimet
Rusty Tchernis
Muna Husain
A B S T R A C T
Given the recent rise in childhood obesity, the School Breakfast Program (SBP) and National School Lunch Program (NSLP) have received renewed attention. Using panel data on more than 13,500 primary school students, we assess the relationship between SBP and NSLP participation and (rela-tively) long-run measures of child weight. After documenting a positive as-sociation between participation and child weight, we find evidence of non-random selection into the SBP. Allowing for such selection is sufficient to alter the results, indicating that the SBP is a valuable tool in the current battle against childhood obesity, whereas the NSLP exacerbates the cur-rent epidemic.
I. Introduction
As is quite evident from recent media reports, childhood obesity is deemed to have reached epidemic status in the US. Data from the National Health and Nutrition Examination Survey (NHANES) I (1971–74) and NHANES 2003– 2004 indicate that the prevalence of overweight preschool-aged children, aged two to five years, increased from 5 percent to 13.9 percent over this time period.1Among
1. Overweight is defined as an age- and gender-specific body mass index (BMI) greater than the 95th percentile based on growth charts from the Center for Disease Control (CDC).
Daniel Millimet is a professor of economics at Southern Methodist University. Rusty Tchernis is an as-sociate professor of economics at Georgia State University. Muna Husain is an assistant professor at Kuwait University. The authors wish to thank two anonymous referees, Steven Haider, Elaina Rose, Ja-yjit Roy, seminar participants at University of Alabama-Birmingham, Emory University, Georgetown University Public Policy Institute, Georgia State University, IUPUI, and conference participants at Texas Camp Econometrics and the Western Economic Association International Annual Meetings. The data used in this article can be obtained beginning February 2011 through January 2014 from Daniel Millimet, Department of Economics, SMU, Dallas, TX 75275-0496. Tel: (214) 768 3269. Fax: (214) 768 1821.
E-mail: millimet@mail.smu.edu.
school-aged children, the prevalence has risen from 4 percent to 18.8 percent for those aged six to eleven; 6.1 percent to 17.4 percent for those aged 12–19 years.2
In light of this, policymakers have acted in a number of different directions, particularly within schools. Aside from these recent actions, two longstanding federal programs have been met with renewed interest: the School Breakfast Program (SBP) and the National School Lunch Program (NSLP). Given that more than 30 million children are affected by these programs on a daily basis, and that the infrastructure for these programs already exists, it is the relationship between the SBP, NSLP, and child weight that we analyze here. Specifically, we have three objectives. First, assess the relationship between participation in both school nutrition programs and child weight using data collected afterthe most recent, large-scale reforms of the pro-grams. Second, analyze the process by which children select into the SBP and NSLP. Finally, assess the impact of such selection on our ability to infer a causal relation-ship.
Our results are striking, yielding three salient findings. First, both SBP and NSLP participation in first grade are associated with greater child weight in third grade and a greater change in child weight between first and third grades. However, we find strong evidence of nonrandom selection into the SBP on the basis of prekin-dergarten weight trajectories; children who gained weight at a faster rate prior to kindergarten are more likely to participate. Consonant with Schanzenbach (2009), the evidence of such self-selection is much weaker for the NSLP. Finally, in nearly all cases, the positive associations between SBP participation and child weight are found to be extremely sensitive to nonrandom selection; even a modestamount of positive selection is sufficient to eliminate, if not reverse, the initial results for SBP. Moreover, allowing for modest positive selection into the SBP leads to adetrimental effect of NSLP participation on child weight; ignoring nonrandom selection into SBP biases the impact of the NSLP toward zero. The beneficial effect of the SBP, and the deleterious impact of the NSLP, strengthens the findings in Bhattacharya, Currie, and Haider (2006) and Schanzenbach (2009), respectively.
The remainder of the paper is organized as follows. Section II provides back-ground information, both on the school nutrition programs themselves, as well as the previous literature. Section III presents a simple theoretical framework for think-ing about school nutrition programs. Section IV describes the empirical methodol-ogy, data, and results, while Section V concludes.
II. Background
A detailed account of the institutional features of the SBP and NSLP is provided in Millimet, Tchernis, and Husain (2008). Most pertinent, however, are the nutritional requirements established by Congress in 1995 under the “School Meals Initiative for Healthy Children” (SMI). The SMI represented the largest re-form of the programs since their inception, and places restrictions on the nutritional content of meals (Lutz, Hirschman, and Smallwood 1999). Schools failing to meet
these restrictions are not eligible for federal funding.3For breakfast, SMI stipulates that no more than 30 percent of the meal’s calories be derived from fat, and less than 10 percent from saturated fat. Breakfasts also must provide one-fourth of the Recommended Dietary Allowance (RDA) for protein, calcium, iron, Vitamin A, Vitamin C, and contain an age-appropriate level of calories. For lunches, the same restrictions on fat apply, except lunches must provide one-third of the RDA for protein, calcium, iron, Vitamin A, Vitamin C, and an age-appropriate level of cal-ories. In addition, all meals are recommended to reduce levels of sodium and cho-lesterol, as well as increase the level of dietary fiber.
In terms of the prior literature, the SBP and NSLP have each been studied to some extent. These studies can be loosely categorized into three groups: (i) assess-ments of the nutritional content of meals offered, (ii) noncausal assessassess-ments of the association between child outcomes and (student- or school-level) participation in the SBP or NSLP, and (iii) causal assessments of participation in the SBP or NSLP. The third group is most relevant to our study. Within this group, Gleason and Suitor (2003) focus on NSLP participation and use student-level fixed effects to control for nonrandom selection. The authors find that NSLP participation increases intake of nutrients, but also increases intake of dietary fat. Hofferth and Curtin (2005) obtain instrumental variables (IV) estimates of the impact of NSLP participation using public school attendance as the instrument; SBP participation is treated as exoge-nous. The authors find no impact of either program, but the IV estimates are very imprecise. Bhattacharya, Currie, and Haider (2006) analyze the effects of SBP avail-ability in the school on nutritional intake, employing a difference-in-differences strat-egy (comparing in-school versus out-of-school periods in schools participating and not participating in the SBP). The authors conclude that SBP availability does not impact caloric intake, but does have nutritional benefits. Finally, Schanzenbach (2009) utilizes panel data methods, as well as a regression discontinuity (RD) ap-proach that exploits the sharp income cutoff for eligibility for reduced-price meals, to assess the impact of the NSLP. She finds that NSLP participation increases the probability of being obese due to the additional calories provided by school lunches. We add to this literature in two important ways. First, we assess the long-run relationship between participation inboththe SBP and NSLP program and children’s weight using data after the reforms enacted under the SMI should have been fully implemented. Second, we assess the nature of selection into both programs, and examine the sensitivity of the estimated program effects to nonrandom selection.
III. Data
The data are obtained from the Early Childhood Longitudinal Study-Kindergarten Class of 1998–99 (ECLS-K). Collected by the U.S. Department of
Education, the ECLS-K follows a nationally representative cohort of children throughout the United States from fall and spring kindergarten, fall and spring first grade, and spring third grade. The sample includes 17,565 children from 994 schools. We measure participation in school nutrition programs during spring first grade.4 However, we measure the health status of each child either in spring third grade or as the change from fall first grade to spring third grade. Thus, we are analyzing more of the long-run relationship between child health and participation in the two programs, as in Schanzenbach (2009).
To measure child health, we utilize data on the age (in months) and gender of each child, as well as data on the weight and height of each child. We construct five measures of child health: body mass index (BMI) in logs, growth rate in BMI from fall first grade to spring third grade, change in BMI percentile over the same time span, and indicators for overweight and obesity status, where percentiles are determined based on age- and gender-specific growth charts.5Children with missing data for gender and race are dropped from our sample. Particular care was needed to clean the data on child age, height, and weight, and this is detailed in Millimet, Tchernis, and Husain (2008).
To control for parental and environmental factors, we include the following co-variates in the analysis: child’s race (white, black, Hispanic, Asian, and other) and gender, child’s birth weight, household income, mother’s employment status, mother’s education, number of children’s books at home, mother’s age at first birth, an indicator if the child’s mother received WIC benefits during pregnancy, region, city type (urban, suburban, or rural), and the amount of food in the household. Finally, we also include higher order and interaction terms involving the continuous variables, as well as fall kindergarten measures of child health.6Missing values for the control variables are imputed and imputation dummies are added to the control set.
The final sample contains 13,531 students, of which 3,074 participate in neither the SBP nor NSLP, 3,347 participate in both, and 116 (6,994) participate in the SBP (NSLP) only. Summary statistics are provided in Millimet, Tchernis, and Husain (2008). The average BMI during spring third grade is 18.4, up from 16.3 in fall kindergarten. The average growth rate in BMI over this time span is 11.2 percent, and the average increase in BMI percentile is 1.4 units (from 61.0 to 62.4). Finally, while 11.3 percent (25.7 percent) of entering kindergarten children were obese (over-weight), 17.2 percent (32.3 percent) of third grade students were obese (overweight). Also noteworthy, the observable attributes of participants and nonparticipants in the school nutrition programs do differ. Specifically, participants in both the SBP and NSLP are more likely to be nonwhite, reside in the south, live in a poor household
4. The relevant questions were also asked in the spring kindergarten wave. However, the fact that many students attend half-day kindergarten programs adds an additional element of nonrandom selection into school meal programs. In Millimet, Tchernis, and Husain (2008) we present results using participation measured during kindergarten; the results are similar.
with a less educated mother, have fewer children’s books in the home, and have a mother who was more likely to have given birth while a teenager.
IV. Empirics
A. Preliminaries1. Model
We begin by assessing the impact of school nutrition programs on child health utilizing typical regressions that control for the covariates mentioned in the previous section plus school fixed effects. The basic estimating equation is given by
y ⳱x ⳭD Ⳮ D Ⳮ␣Ⳮε ,
(1) is is 1 1is 2 2is s is
where yis is a measure of health for student i in school ,s D1is⳱1 for all SBP participants (zero otherwise) andD2i⳱1for all NSLP participants (zero otherwise), are school fixed effects, and is a mean zero error term. For OLS estimation
␣ ε
s is
of Equation 1 to yield a consistent estimate of1 and2, participation in the SBP and NSLP must be independent of the error term conditional onxand . The school␣
fixed effects account for school-level unobservables potentially correlated with the availability of and participation in school nutrition programs. In addition, measuring child weight as the change from first to third grade in some specifications, and the inclusion of lagged dependent variable terms inx in all specifications, accounts for time invariant student-level attributes as well.
2. Results
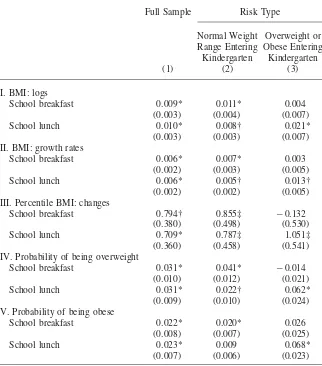
Estimates are presented in Table 1. Column 1 utilizes the full sample, while the specifications in Columns 2 and 3 relax the assumption that school nutrition pro-grams (and the control variables) have identical effects across children. Since chil-dren entering kindergarten overweight or obese are the most likely targets of any policies designed to combat the recent rise in childhood obesity, we allow for het-erogeneous effects by risk type. Column 2 estimates Equation 1 using the subsample of children entering kindergarten with a BMI below the 85th percentile (“normal” weight); Column 3 uses the subsample of students entering with a BMI between above the 85th percentile (“overweight” or “obese”).
Table 1
Preliminary Results: School Fixed Effects
Full Sample Risk Type
Normal Weight Range Entering Kindergarten
Overweight or Obese Entering Kindergarten
(1) (2) (3)
I. BMI: logs
School breakfast 0.009* 0.011* 0.004
(0.003) (0.004) (0.007)
School lunch 0.010* 0.008† 0.021*
(0.003) (0.003) (0.007)
II. BMI: growth rates
School breakfast 0.006* 0.007* 0.003
(0.002) (0.003) (0.005)
School lunch 0.006* 0.005† 0.013†
(0.002) (0.002) (0.005)
III. Percentile BMI: changes
School breakfast 0.794† 0.855‡ ⳮ0.132
(0.380) (0.498) (0.530)
School lunch 0.709* 0.787‡ 1.051‡
(0.360) (0.458) (0.541)
IV. Probability of being overweight
School breakfast 0.031* 0.041* ⳮ0.014
(0.010) (0.012) (0.021)
School lunch 0.031* 0.022† 0.062*
(0.009) (0.010) (0.024)
V. Probability of being obese
School breakfast 0.022* 0.020* 0.026
(0.008) (0.007) (0.025)
School lunch 0.023* 0.009 0.068*
(0.007) (0.006) (0.023)
participation is positive and statistically and economically meaningful. For example, NSLP participation is associated with a 6.8 percent increase in the probability of being obese in third grade.
In sum, the preliminary results are consistent with an equal, positive association between SBP and NSLP participation and child weight, but different associations across subsamples defined by risk type. However, each subsample yields a positive association between at least one of the programs and third grade child weight; the results differ, though, in terms of to which program the positive effect is attributed.
B. Nonrandom Selection into School Nutrition Programs
Because the preliminary estimation results are susceptible to bias from selection on student-level unobservables that affect weight trajectories (as opposed to weight in levels), we first look for evidence of self-selection into either program on the basis of such trajectories. After this, we assess the sensitivity of the preliminary results to such selection utilizing the methods developed in Altonji, Elder, and Taber (2005).
1. Preprogram Health Outcomes
Despite controlling for time invariant student-level attributes in the baseline model, the estimates will be biased if there is positive selection into either program on the basis of expected future changes in child weight. We explore this possibility by examining selection into the programs on the basis of weight growth prior to kin-dergarten.
To proceed, we follow the strategy of Schanzenbach (2009) and reestimate our models using the growth rate in weight from birth to kindergarten entry as the dependent variable.7 In the full sample, we obtain positive, statistically significant coefficients for both programs, although the association is stronger for SBP (SBP⳱0.015, s.e. ⳱0.005;NSLP⳱0.009, s.e.⳱0.004). When we split the sample risk type, we continue to obtain a strong statistical association between SBP partic-ipation and weight trajectories prior to kindergarten; NSLP particpartic-ipation is at best weakly related to weight growth prior to kindergarten.8
These findings suggest that the estimated effects of SBP participation reported in Table 1 are upward biased. Equally important, however, is the fact that not only does positive selection into the SBP bias the regression coefficients on SBP partic-ipation upward, it most likely biases the regression coefficients on NSLP partici-pation downward given the positive covariance between SBP and NSLP participa-tion. Thus, despite the lack of overwhelming evidence of any direct selection bias associated with NSLP participation, particularly once we condition on risk type,
7. The specifications used are analogous to those in Table 1, with the addition of child height measured during fall kindergarten (along with corresponding higher order and interaction terms) as covariates and the omission of child birth weight as a covariate. In addition, we drop observations for which birtweight is missing.
8. For children entering kindergarten in the normal weight range, we obtainSBP⳱0.015 (s.e.⳱0.005)) andNSLP⳱0.007 (s.e.⳱0.004). For children entering kindergarten either overweight or obese, we obtain
and ).
failure to address selection into the SBP biases the estimates of the NSLP effect.9 To quantify exactly how sensitive the results are to selection into the SBP program, we turn to the methods developed in Altonji, Elder, and Taber (2005).
2. Bivariate Probit Model
To assess the impact of positive selection into the SBP, we first employ the bivariate probit model utilized in Altonji, Elder, and Taber (2005). The model is given by
y⳱I
(
xⳭ D Ⳮ D Ⳮε 0)
(2) i i 0 1 1i 2 2i i
D1i⳱I
(
xi0Ⳮ2D2iⳭi0)
where I(•)is the indicator function, ε,N2
(
0,0,1,1,)
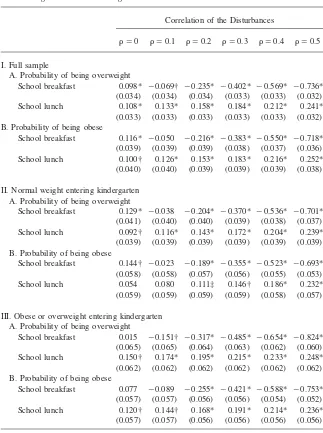
, y is a binary measure of child weight, and D1 andD2represent SBP and NSLP participation, respectively. The set of covariates, , is identical to Table 1 when we use the full sample, butx excludes the lagged variable terms when we split the sample by risk type. The parametercaptures the correlation between unobservables that impact child weight and the likelihood of SBP participation;0 implies positive selection on unob-servables.Given the bivariate normality assumption, the model is technically identified even absent an exclusion restriction. However, to assess the role of selection into the SBP without formally relying on the distributional assumption, Altonji, Elder, and Taber (2005) constrain to different values and examine the estimates of the remaining parameters. Here, we set to 0, 0.1, . . . , 0.5, representing an increasing amount of positive selection on unobservables into the SBP. The results are presented in Table 2.
The results are dramatic. First, across both outcomes and all data samples, the positive effect of SBP participation disappears when ⳱0.1, and is negative and statistically significant in all cases when ⱖ0.2. Second, consistent with our earlier hypothesis, the coefficients on NSLP increase with ; in most cases, the positive coefficient on NSLP participation is statistically significant in all specifications when
.
ⱖ0.2
In sum, the results indicate that the positive associations documented earlier be-tween SBP participation and child weight are extremely sensitive to selection on unobservables; even a modest amount of positive selection eliminates or even re-verses the previous results. In addition, allowing for positive selection into the SBP indicates that the NSLP leads to greater child weight. Thus, conditioning on SBP participation, but allowing for positive selection into the SBP, yields NSLP effects that are consistent with the contemporaneous relationship documented in Schanzen-bach (2009) using alternative methodologies. Our findings are also consistent with findings from the SNDA-2 analysis of school meals conducted in 1998–99. The SNDA-2 study found that the average percent of calories derived from fat (saturated
9. For simplicity, consider the simple regression modely⳱␣ⳭxⳭε, where $x$ includes only SBP and NSLP participation dummies. The expectation of the OLS estimate,limE[ˆ], equalsⳭ(x⬘x)ⳮ1x⬘ε. Assuming limCov(SBP,ε)0 and limCov(NSLP,ε)⳱0, conditional on the other element ofx, and
Table 2
Sensitivity Analysis: Bivariate Probit Results with Different Assumptions Concerning Correlation Among the Disturbances
Correlation of the Disturbances
⳱0 ⳱0.1 ⳱0.2 ⳱0.3 ⳱0.4 ⳱0.5
I. Full sample
A. Probability of being overweight
School breakfast 0.098* ⳮ0.069† ⳮ0.235* ⳮ0.402* ⳮ0.569* ⳮ0.736* (0.034) (0.034) (0.034) (0.033) (0.033) (0.032)
School lunch 0.108* 0.133* 0.158* 0.184* 0.212* 0.241*
(0.033) (0.033) (0.033) (0.033) (0.033) (0.032) B. Probability of being obese
School breakfast 0.116* ⳮ0.050 ⳮ0.216* ⳮ0.383* ⳮ0.550* ⳮ0.718* (0.039) (0.039) (0.039) (0.038) (0.037) (0.036)
School lunch 0.100† 0.126* 0.153* 0.183* 0.216* 0.252*
(0.040) (0.040) (0.039) (0.039) (0.039) (0.038)
II. Normal weight entering kindergarten A. Probability of being overweight
School breakfast 0.129* ⳮ0.038 ⳮ0.204* ⳮ0.370* ⳮ0.536* ⳮ0.701* (0.041) (0.040) (0.040) (0.039) (0.038) (0.037)
School lunch 0.092† 0.116* 0.143* 0.172* 0.204* 0.239*
(0.039) (0.039) (0.039) (0.039) (0.039) (0.039) B. Probability of being obese
School breakfast 0.144† ⳮ0.023 ⳮ0.189* ⳮ0.355* ⳮ0.523* ⳮ0.693* (0.058) (0.058) (0.057) (0.056) (0.055) (0.053)
School lunch 0.054 0.080 0.111‡ 0.146† 0.186* 0.232*
(0.059) (0.059) (0.059) (0.059) (0.058) (0.057)
III. Obese or overweight entering kindergarten A. Probability of being overweight
School breakfast 0.015 ⳮ0.151† ⳮ0.317* ⳮ0.485* ⳮ0.654* ⳮ0.824* (0.065) (0.065) (0.064) (0.063) (0.062) (0.060)
School lunch 0.150† 0.174* 0.195* 0.215* 0.233* 0.248*
(0.062) (0.062) (0.062) (0.062) (0.062) (0.062) B. Probability of being obese
School breakfast 0.077 ⳮ0.089 ⳮ0.255* ⳮ0.421* ⳮ0.588* ⳮ0.753* (0.057) (0.057) (0.056) (0.056) (0.054) (0.052)
School lunch 0.120† 0.144† 0.168* 0.191* 0.214* 0.236*
(0.057) (0.057) (0.056) (0.056) (0.056) (0.056)
fat) was 3 percent (12 percent), which still exceeds the requirements instituted under the SMI. Breakfasts, on average, met the SMI requirements, deriving 26 percent (9.8 percent) of calories from fat (saturated fat).10Moreover, a vast research touts the importance of eating breakfast; skipping breakfast is associated with overall higher caloric intake (for example, Morgan, Zabik, and Stampley 1986; Stauton and Keast 1989). On the other hand, the FNS found that even a dietitian could not select a low fat lunch provided by the NSLP in 10–35 percent of schools.
Prior to continuing, a few comments are warranted. First, while the Altonji, Elder, and Taber (2005) approach is informative, it does provide a different type of infor-mation than applied researchers are accustomed. Specifically, we are not arriving at point estimates of the effects of participation. While that should be the goal of future work, obtaining consistent point estimates of the effect of participation (as opposed to program availability, as in Bhattacharya, Currie, and Haider 2006) requires a valid instrument. While the RD strategy pursued in Schanzenbach (2009) is promising, one might worry that the treatment effect being identified is only valid for students near the income thresholds used in the subsidy eligibility rules. Thus, the point estimates may not apply to a student chosen at random from the population. In light of this, we believe the preceding analysis to offer valuable insight: Modest positive selection into the SBP implies a beneficial effect of participation on child health and an adverse effect of NSLP participation.
Second, while we do not know the true value of (and, indeed, cannot know it absent a valid exclusion restriction or reliance on the bivariate normality assump-tion), a value around 0.1–0.2 does not seem unreasonable since important factors, such as parental height and weight, family size, and genetic endowments, are not included in the set of observables. Moreover, we did estimate the bivariate probit models without constraining ; thus, the models are identified from the parametric
assumption. We obtain estimates ofˆ between 0.21 and 0.27 in the full sample and subsample of children entering kindergarten overweight or obese, and between 0.37 and 0.41 for children entering kindergarten in the normal weight range.
Finally, we exploited the identification strategy used in Schanzenbach (2009). Specifically, we used binary indicators for having a household income below 130 percent and 185 percent of the federal poverty line as exclusion restrictions and we augmentedxto include a fourth order polynomial for the ratio of household income to the poverty line. The estimates ofare quite similar, albeit the exclusion restric-tions are only statistically significant at conventional levels in the subsamples defined by risk type.
3. Extent of Selection on Unobservables
Altonji, Elder, and Taber (2005) offer an alternative method for assessing the role of unobservables, applicable to continuous outcomes as well. Intuitively, the idea is to assess how much selection on unobservables there must be, relative to the amount of selection on observables, to fully account for the positive association between
SBP participation and child weight under the null hypothesis of no average treatment effect.
The (normalized) amount of selection on unobservables is formalized by the ratio
E
[
D1⳱1]
ⳮE[
D1⳱0]
(3)
Var()
whereD1denotes SBP participation as above andcaptures unobservables in the outcome equation (that is,␣Ⳮε in Equation 1). Similarly, the (normalized) amount of selection on observables is formalized by the ratio
˜ ˜
E
[
xoD1⳱1]
ⳮE[
xoD1⳱0]
(4) ˜
Var
(
xo)
wherexo is the set of observables included in the outcome equation ( ) andx D2in Equation 1) and˜ is the corresponding parameter vector. The goal is to assess how large the selection on unobservables in Equation 3 must be relative to the selection on observables in Equation 4 to fully account for the positive association between SBP and child weight documented in Table 1.
To begin, express actual SBP participation as
D ⳱x Ⳮ
(5) 1i oi i
and substitute this into Equation 1. Equation 1 becomes
˜
y⳱x
(
Ⳮ )
Ⳮ Ⳮ.(6) i oi 1 1 i i
The probability limit of the OLS estimator of 1in Equation 6 is given by
Cov
(
,)
Var(
D1)
plimˆ ⳱ Ⳮ ⳱ Ⳮ
{
E[
D⳱1]
ⳮE[
D ⳱0]}
.(7) 1 1 1 1 1
Var
(
)
Var()Under the assumption of equal normalized amounts of selection on observables and unobservables, the bias term in Equation 7 is
˜ ˜
Cov
(
,)
Var(
D1)
E[
xoD1⳱1]
ⳮE[
xoD1⳱0]
⳱ Var
(
)
.(8)
冦
˜冧
Var
(
)
Var(
)
Var(
xo)
Under the null hypothesis that1⳱0,˜ can be consistently estimated from Equation 6 using either OLS or a probit model and constraining 1 to be zero. Using the estimated ˜ and variance of the residual (which is unity when Equation 6 is esti-mated via probit), along with sample values ofVar
(
D1)
andVar(
)
yields an esti-mate of the asymptotic bias under equal degrees of selection on observables and unobservables.affecting child weight (with the remaining factors being captured by ) and no factorε
(observed or unobserved) plays too large of role in the determination of child weight, then the estimated treatment effect should be interpreted as not robust if the ratio is less one.
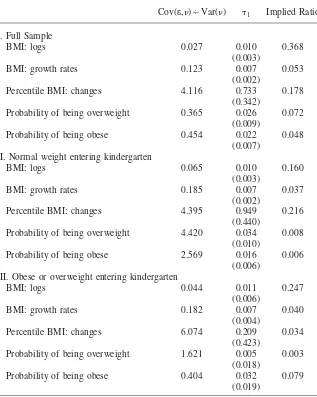
The results are given in Table 3. Across all samples and measures of child health, the ratio is never greater than 0.37 and often smaller than 0.08. Thus, if the (nor-malized) amount of selection on unobservables is even one-quarter the (nor(nor-malized) amount of selection on observables, and often even 10 percent, the positive effects of SBP participation are completely explained.
As in the bivariate probit model, this model does not yield point estimates of the treatment effect. Nonetheless, it provides very useful information consonant with the bivariate probit findings: Even a modest amount of selection on unobservables is sufficient to explain the positive association between SBP participation and child weight.
C. Final Robustness Checks
We perform two final robustness checks of our analysis. First, because the 116 responses indicating participation in the SBP, but not the NSLP, may reflect mea-surement error, or students sufficiently different from the remainder of the sample, we redid the analysis omitting these observations. The results are unaffected and are available upon request.
Second, we estimate the average treatment effect (ATE) of each program using propensity score matching (PSM). Now quite commonplace in economics and other disciplines, PSM estimation yields three potential benefits over regression methods (Smith and Todd 2005). First, it is a semiparametric estimator in that one does not need to specify a functional form for potential outcomes. Second, issues of common support are explicitly addressed.11Third, the robustness of PSM estimates to selec-tion on unobservables may be gauged using Rosenbaum bounds (Rosenbaum 2002). In the interest of brevity, and because Rosenbaum bounds have become more widely used in economics, we do not provide the formal details. Instead, we note that the objective is to obtain bounds on the significance level of a one-sided test for no treatment effect under different assumptions concerning the role of unob-servables in the treatment selection process. Specifically, upper bounds on the p-value for the null of zero average treatment effect are obtained for different p-values ofC, whereCreflects the relative odds ratio of two observationally identical children receiving the treatment. Thus, C is unity in nonexperimental data free of “hidden bias” from selection on unobservables; higher values of C imply an increasingly important role of unobservables. For example, C⳱2 implies that observationally identical children can differ in their relative odds of treatment by a factor of two.
Results are omitted for brevity, but confirm the findings presented here (see Mil-limet, Tchernis, and Husain 2008). Specifically, the PSM estimates indicate a
Table 3
Sensitivity Analysis: Amount of Selection on Unobservables Relative to Selection on Observables Required to Attribute the Entire SBP Effect to Selection Bias
Cov(ε,)⳰Var() 1 Implied Ratio
I. Full Sample
BMI: logs 0.027 0.010 0.368
(0.003)
BMI: growth rates 0.123 0.007 0.053
(0.002)
Percentile BMI: changes 4.116 0.733 0.178
(0.342)
Probability of being overweight 0.365 0.026 0.072 (0.009)
Probability of being obese 0.454 0.022 0.048
(0.007) II. Normal weight entering kindergarten
BMI: logs 0.065 0.010 0.160
(0.003)
BMI: growth rates 0.185 0.007 0.037
(0.002)
Percentile BMI: changes 4.395 0.949 0.216
(0.440)
Probability of being overweight 4.420 0.034 0.008 (0.010)
Probability of being obese 2.569 0.016 0.006
(0.006) III. Obese or overweight entering kindergarten
BMI: logs 0.044 0.011 0.247
(0.006)
BMI: growth rates 0.182 0.007 0.040
(0.004)
Percentile BMI: changes 6.074 0.209 0.034
(0.423)
Probability of being overweight 1.621 0.005 0.003 (0.018)
Probability of being obese 0.404 0.032 0.079
(0.019)
tive and statistically significant association between participation in either program and child weight. However, the results are not found to be robust. In the vast majority of cases, the positive effects of SBP participation are sensitive to hidden bias if . In the PSM literature, is usually interpreted as “small,” implying that
Cⱖ1.6 C2
our PSM estimates are not robust.
V. Conclusion
Given the importance of breakfast, as well as the nutritional require-ments imposed on schools under the SBP and the NSLP, these programs are viewed by many as a crucial component of attempts to combat childhood obesity. That said, empirical research on the causal impact of these programs after the reforms instituted under the School Meals Initiative for Healthy Children has been lacking. Using panel data on more than 13,500 students from kindergarten through third grade, we assess the relatively long-run relationship between SBP and NSLP participation and child weight.
Our analysis yields a consistent picture of the effects of school nutrition programs. First, SBP participation is likely related to unobservables correlated with trajectories for child weight (in addition to child weight in levels), whereas there is much weaker evidence that NSLP participation is affected by selection on unobservables (particu-larly after conditioning on risk type). Second, ignoring this selection biases estimates of the average treatment effect of SBP (NSLP) participation upward (downward) regardless of whether one examines measures of child weight in levels or changes. Finally, allowing for even modest positive selection into the SBP is sufficient to yield a negative (positive) causal effect of SBP (NSLP) participation on child weight. Thus, consonant with the results in Bhattacharya, Currie, and Haider (2006) and Schanzenbach (2009), the analysis does not point to the SBP as a contributing factor to the current obesity epidemic, and the SBP may actually constitute a valuable tool in the battle, but the NSLP is contributing to the problem.
Future work is warranted to address two key questions. First, are exclusion re-strictions available in order to identify consistent estimation of the causal effects of participation in the SBP and NSLP? Second, what are the mechanisms by which the NSLP appears to be contributing to the rise in childhood obesity?
References
Altonji, Joseph G., Todd E. Elder, and Christopher R. Taber. 2005. “Selection on Observed and Unobserved Variables: Assessing the Effectiveness of Catholic Schools.”Journal of Political Economy113(1):151–84.
Bhattacharya, Jayanta, Janet Currie, and Steven Haider. 2006. “Breakfast of Champions? The School Breakfast Program and the Nutrition of Children and Families.”Journal of Human Resources41(3):445–66.
Hofferth, Sandra L., and Sally Curtin. 2005. “Poverty, Food Programs, and Childhood Obesity.”Journal of Policy Analysis and Management24(4):703–26.
Lutz, Steven M., Jay Hirschman, and David M. Smallwood. 1999. “National School Lunch and School Breakfast Policy Reforms. InAmerica’s Eating Habits: Changes and Consequences, ed. Elizabeth Frazao, 371–84. Washington, D.C.: Economic Research Service/USDA.
Millimet, Daniel L., Rusty Tchernis, and Muna Husain. 2008. “School Nutrition Programs and the Incidence of Childhood Obesity.” Discussion Paper 3664, IZA: Institute for the Study of Labor, Bonn, Germany.
Morgan, Karen J., Mary E. Zabik, and Gary L. Stampley. 1986. “The Role of Breakfast in a Diet Adequacy of the U.S. Adult Population.”Journal of the American College of Nutrition5(6):551–63.
Schanzenbach, D. W. 2009. “Do School Lunches Contribute to Childhood Obesity?” Journal of Human Resources. 44(3):684–709.